| Param | Original file | Final file |
|---|---|---|
| Filename | modeM0/AS1A12_022T01_9000005540_40430cztM0_level2.fits | modeM0/AS1A12_022T01_9000005540_40430cztM0_level2_quad_clean.evt |
| Size (bytes) | 337,150,080 | 96,373,440 |
| Size | 321.5 MB | 91.9 MB |
| Events in quadrant A | 2,915,200 | 670,125 |
| Events in quadrant B | 2,818,718 | 685,461 |
| Events in quadrant C | 2,745,848 | 634,929 |
| Events in quadrant D | 3,583,026 | 553,174 |
| Mode M0 | |||
|---|---|---|---|
| Quadrant | BADHDUFLAG | Total packets | Discarded packets |
| A | 0 | 11831 | 3 |
| B | 0 | 11373 | 2 |
| C | 0 | 11262 | 2 |
| D | 0 | 14063 | 2 |
| Mode M9 | |||
|---|---|---|---|
| Quadrant | BADHDUFLAG | Total packets | Discarded packets |
| A | 0 | 24 | 0 |
| B | 0 | 24 | 0 |
| C | 0 | 24 | 0 |
| D | 0 | 25 | 0 |
| Mode SS | |||
|---|---|---|---|
| Quadrant | BADHDUFLAG | Total packets | Discarded packets |
| A | 0 | 108 | 0 |
| B | 0 | 108 | 0 |
| C | 0 | 108 | 0 |
| D | 0 | 108 | 0 |
| Quadrant | Total seconds | Saturated seconds | Saturation percentage |
|---|---|---|---|
| A | 5356 | 16 | 0.298730% |
| B | 5356 | 12 | 0.224048% |
| C | 5356 | 48 | 0.896191% |
| D | 5356 | 471 | 8.793876% |
Noise dominated data is calculated using 1-second bins in cleaned event files. If a bin has >2000 counts, and if more than 50% of those come from <1% of pixels, then it is considered to be noise-dominated and hence unusable.
| Quadrant | # 1 sec bins | Bins with >0 counts | Bins with >2000 counts | High rate bins dominated by noise | Noise dominated (total time) | Noise dominated (detector-on time) | Marked lightcurve |
|---|---|---|---|---|---|---|---|
| A | 7329 | 5357 | 3 | 3 | 0.04% | 0.06% | 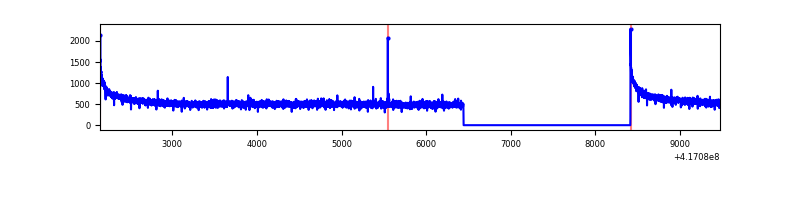 |
| B | 7329 | 5357 | 3 | 3 | 0.04% | 0.06% | 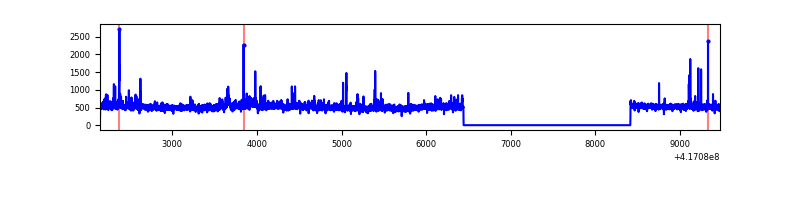 |
| C | 7329 | 5357 | 40 | 40 | 0.55% | 0.75% | 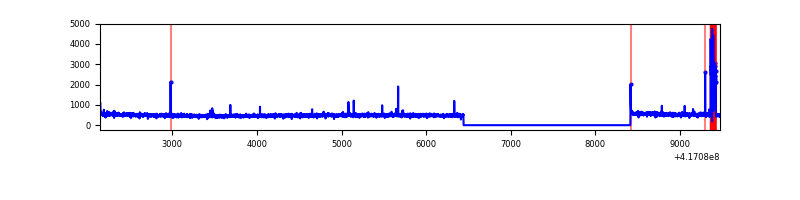 |
| D | 7329 | 5357 | 120 | 120 | 1.64% | 2.24% | 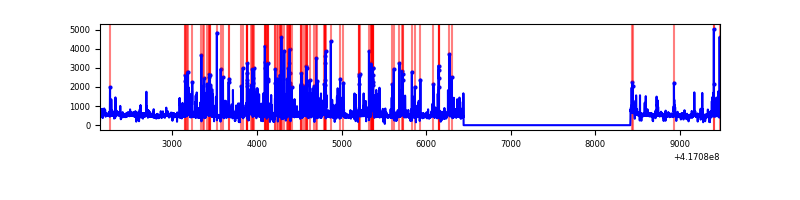 |
Top three noisy pixels from each quadrant. If the there are fewer than three noisy pixels in the level2.evt file, extra rows are filled as -1
| Pixel properties | Quadrant properties | ||||||
|---|---|---|---|---|---|---|---|
| Quadrant | DetID | PixID | Counts | Sigma | Mean | Median | Sigma |
| A | 10 | 83 | 465931 | 3641.66 | 631 | 619 | 127.8 |
| A | 13 | 252 | 7335 | 52.56 | 631 | 619 | 127.8 |
| A | 3 | 137 | 6818 | 48.52 | 631 | 619 | 127.8 |
| B | 3 | 112 | 252448 | 2162.09 | 621 | 606 | 116.5 |
| B | 4 | 170 | 54224 | 460.32 | 621 | 606 | 116.5 |
| B | 5 | 255 | 39168 | 331.06 | 621 | 606 | 116.5 |
| C | 15 | 214 | 235458 | 1695.25 | 601 | 604 | 138.5 |
| C | 14 | 254 | 134469 | 966.28 | 601 | 604 | 138.5 |
| C | 5 | 250 | 14283 | 98.74 | 601 | 604 | 138.5 |
| D | 12 | 227 | 895160 | 6300.17 | 583 | 568 | 142.0 |
| D | 12 | 191 | 153158 | 1074.62 | 583 | 568 | 142.0 |
| D | 12 | 128 | 143888 | 1009.33 | 583 | 568 | 142.0 |
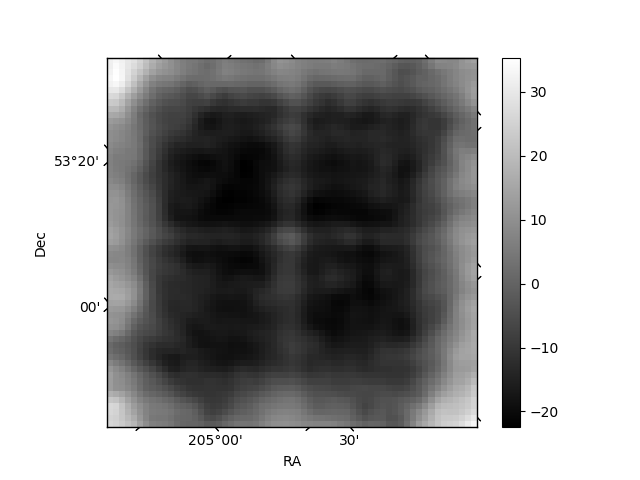
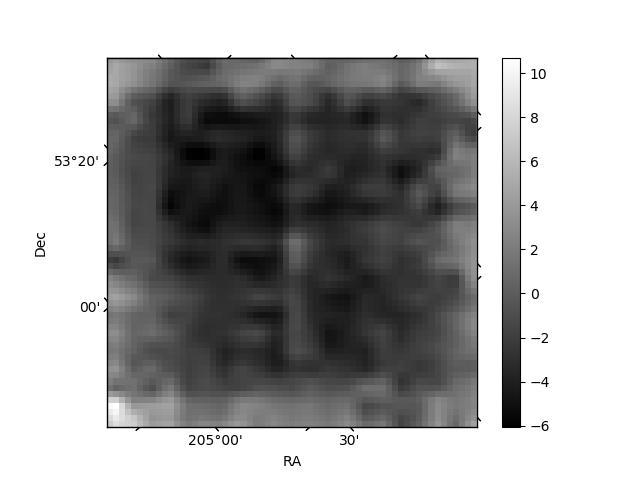
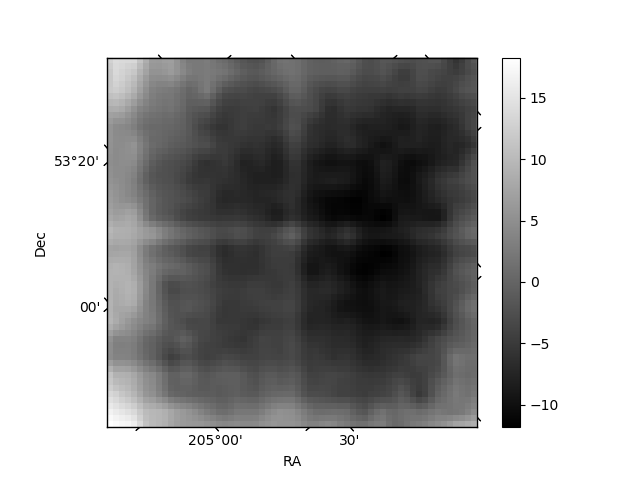
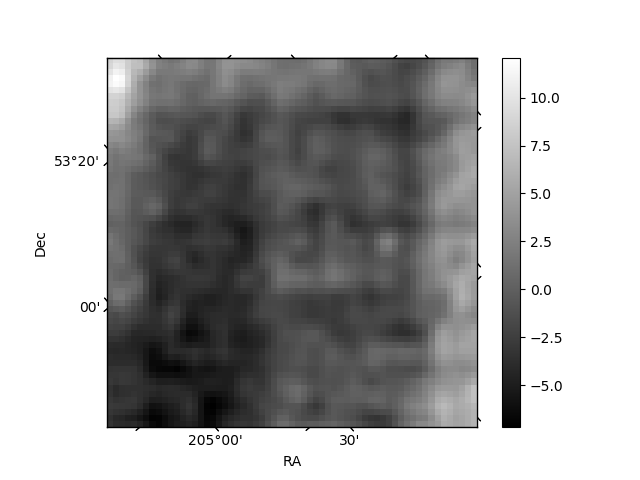
Histogram calculated using DETX and DETY for each event in the final _common_clean file
| Quadrant A | 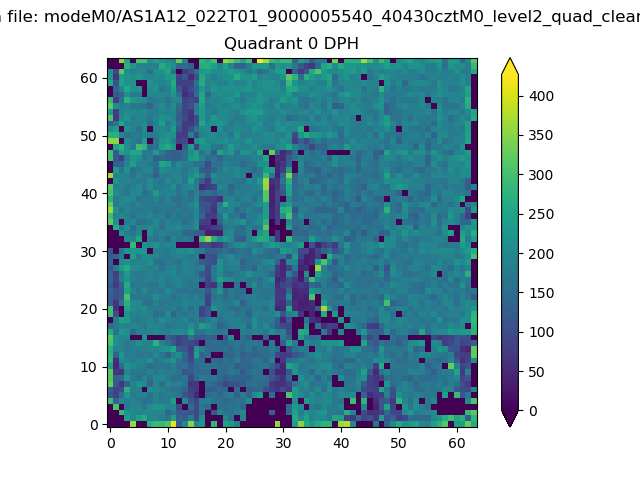 |
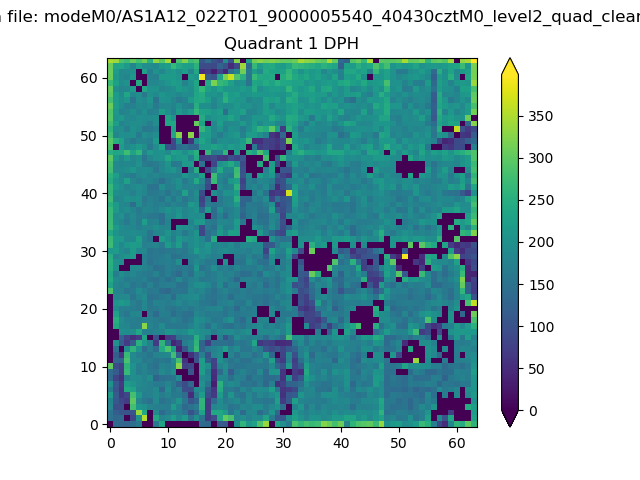 |
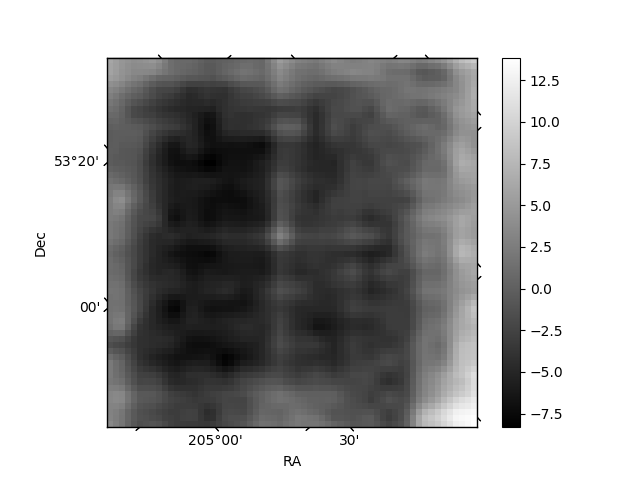
Quadrant B |
|---|---|---|---|
| Quadrant D | 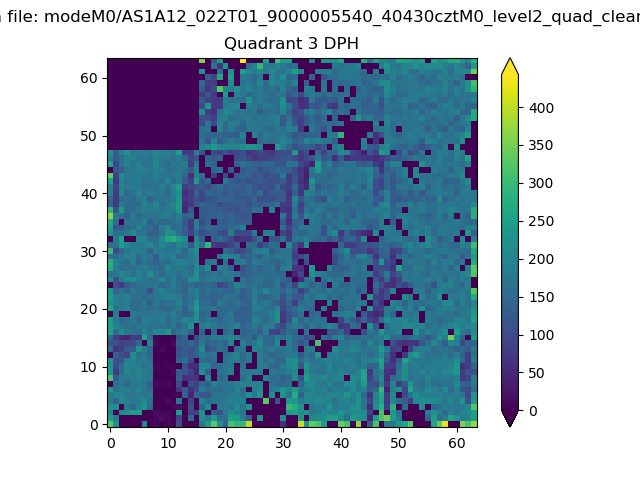 |
 |
Quadrant C |
| Plot type | Count rate plots | Images |
|---|---|---|
| Comparison with Poisson distribution Blue bars denote a histogram of data divided into 1 sec bins. Red curve is a Poisson curve with rate = median count rate of data. |
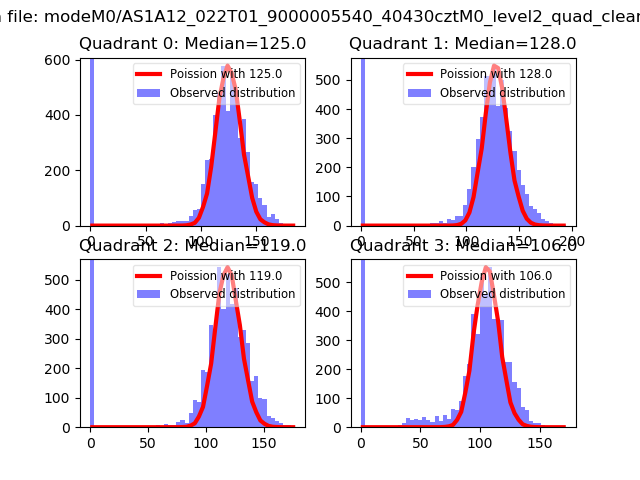 |
 |
| Quadrant-wise count rates Data is divided into 100 sec bins |
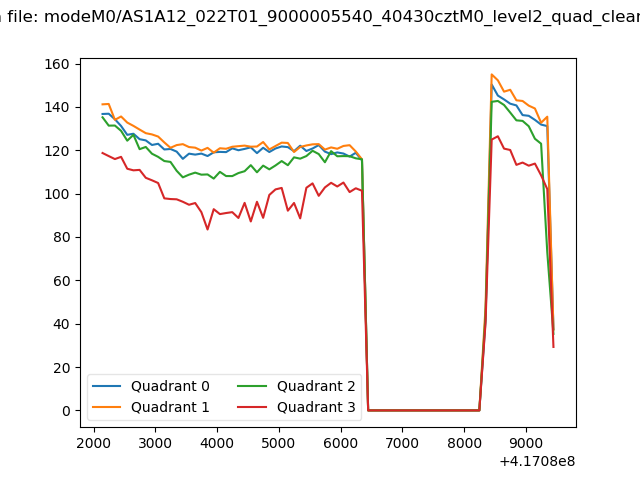 |
|
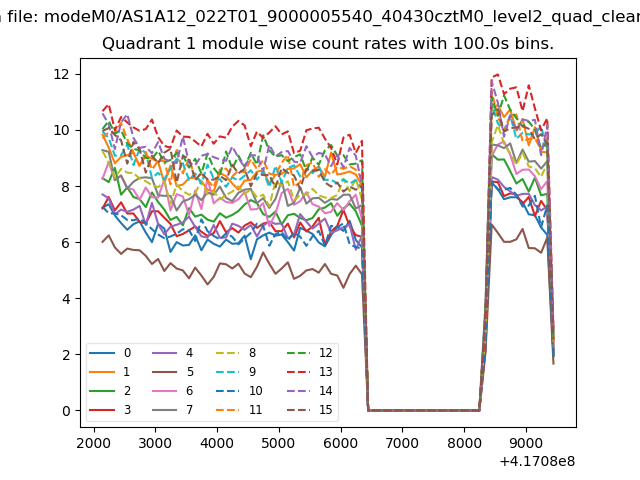
| Module-wise count rates for Quadrant A Data is divided into 100 sec bins |
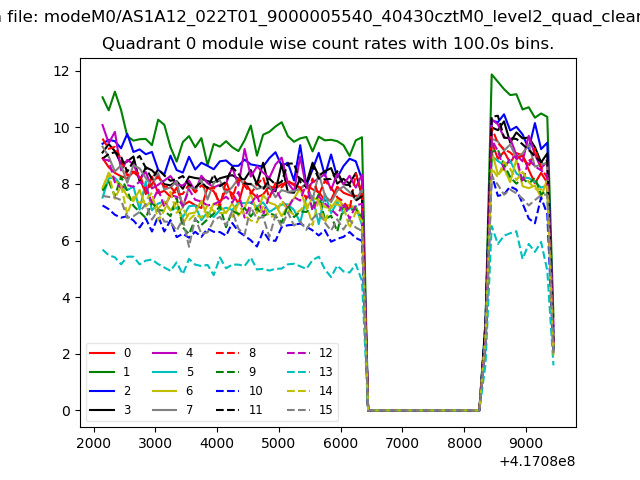 |
 |
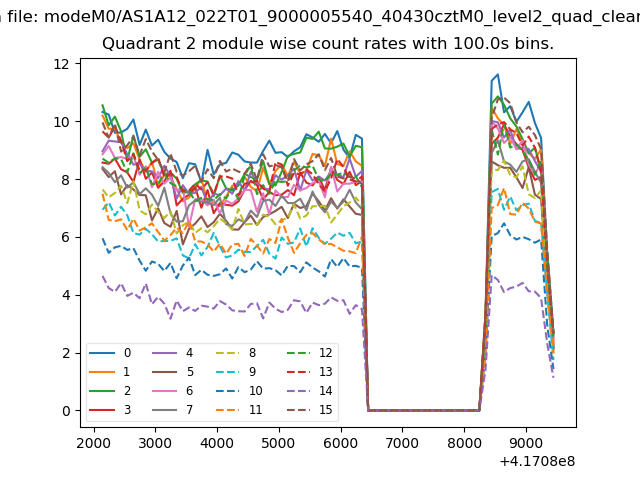
| Module-wise count rates for Quadrant B Data is divided into 100 sec bins |
 |
 |
| Module-wise count rates for Quadrant C Data is divided into 100 sec bins |
 |
 |
| Module-wise count rates for Quadrant D Data is divided into 100 sec bins |
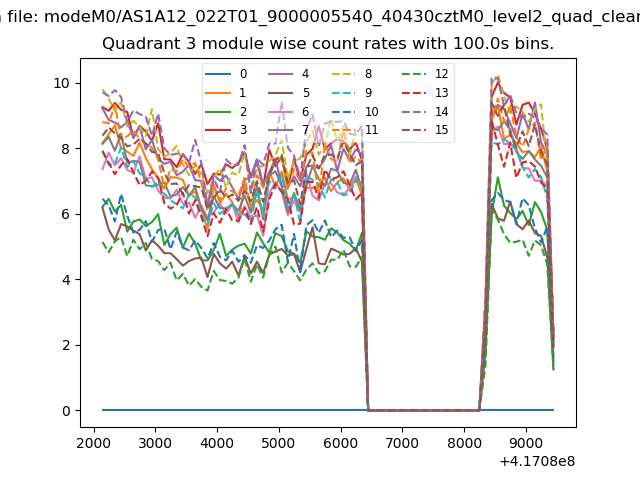 |
 |
| Parameter | Plot |
|---|---|
| CZT HV Monitor | 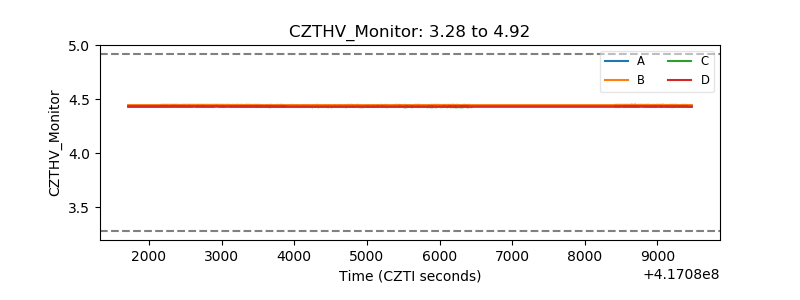 |
| D_VDD | 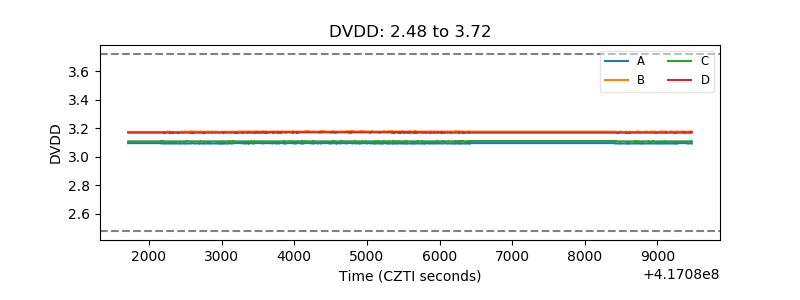 |
| Temperature 1 | 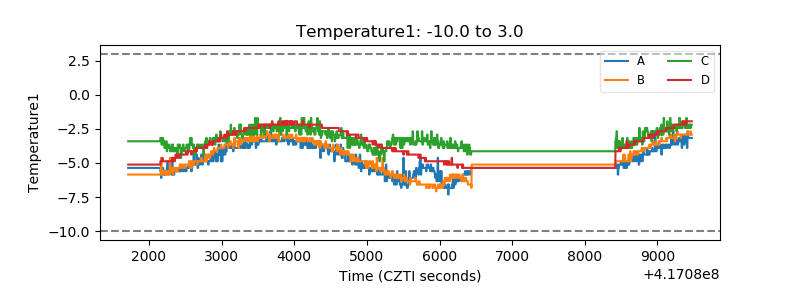 |
| Veto HV Monitor | 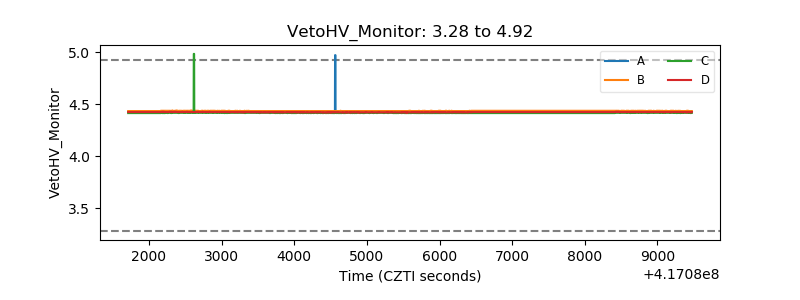 |
| Veto LLD | 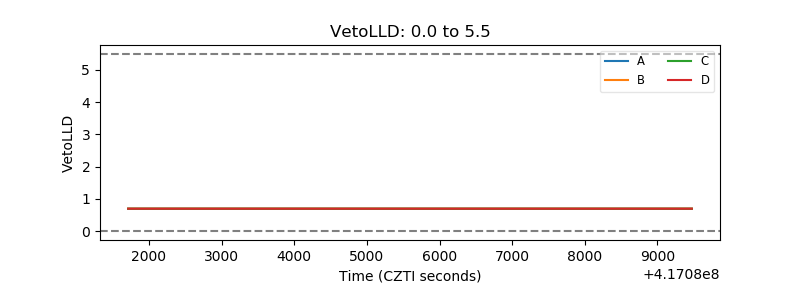 |
| Alpha Counter | 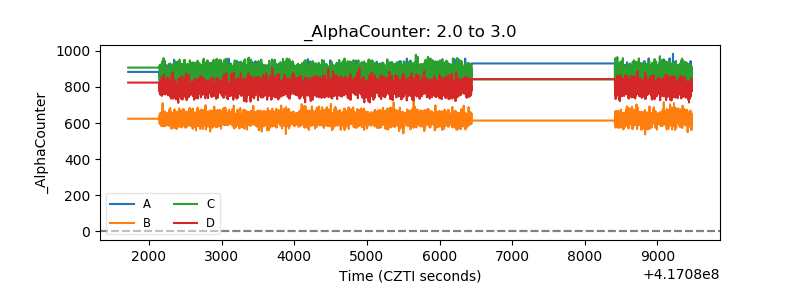 |
| _CPM_Rate | 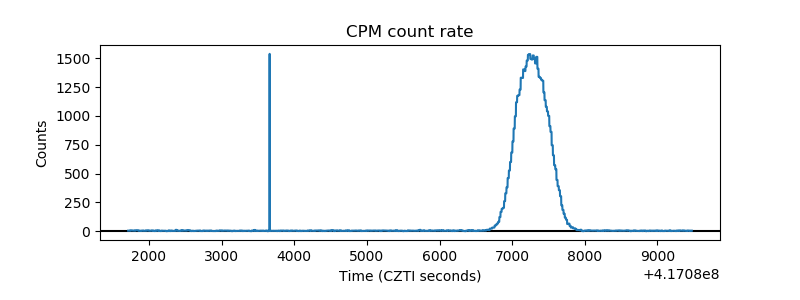 |
| CZT Counter |  |
| +2.5 Volts monitor | 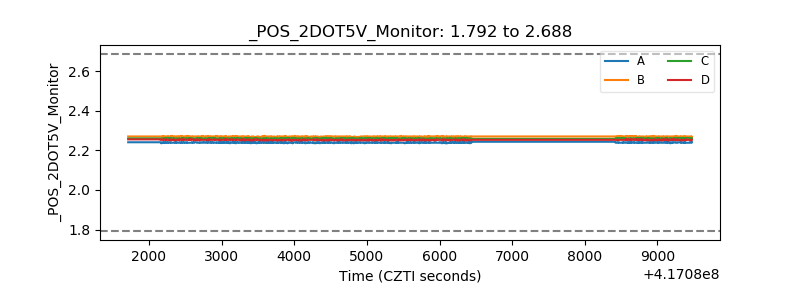 |
| +5 Volts monitor | 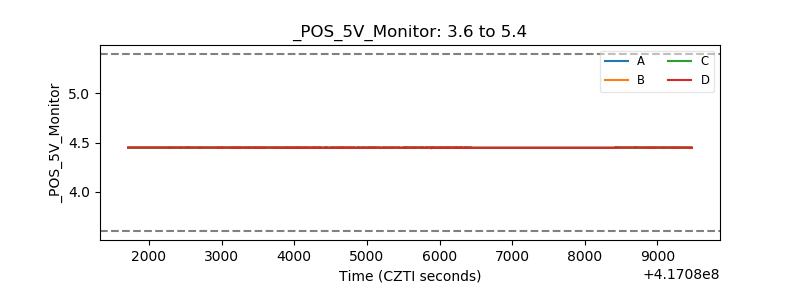 |
| _ROLL_ROT | 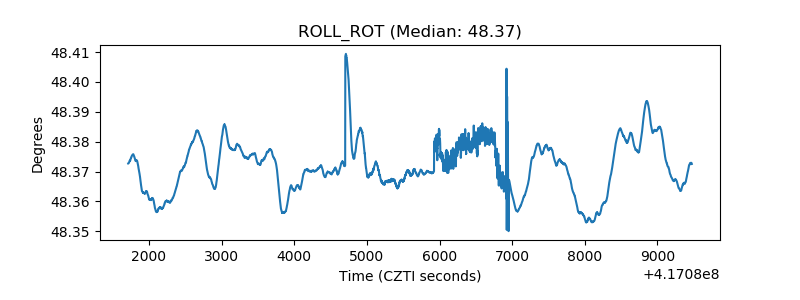 |
| _Roll_DEC | 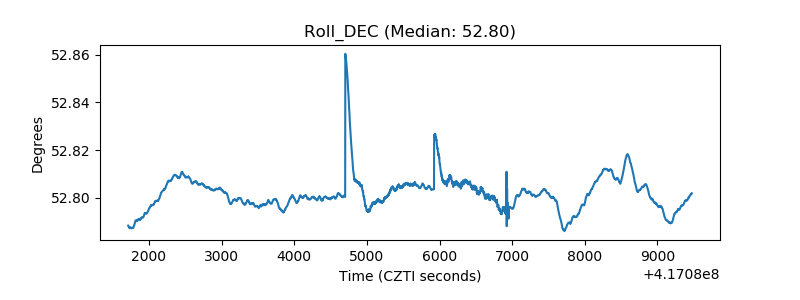 |
| _Roll_RA | 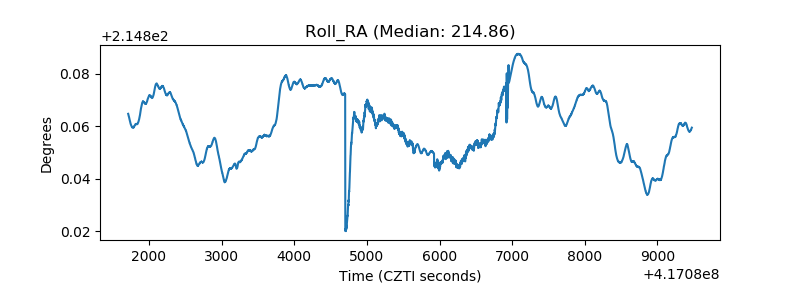 |
| Veto Counter | 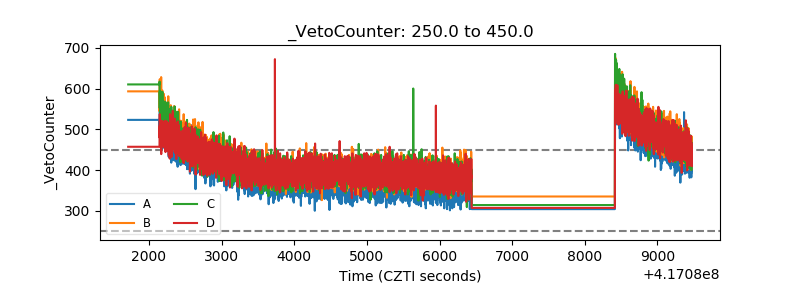 |