| Param | Original file | Final file |
|---|---|---|
| Filename | modeM0/AS1A12_022T01_9000005540_40431cztM0_level2.fits | modeM0/AS1A12_022T01_9000005540_40431cztM0_level2_quad_clean.evt |
| Size (bytes) | 321,065,280 | 97,297,920 |
| Size | 306.2 MB | 92.8 MB |
| Events in quadrant A | 2,991,592 | 680,374 |
| Events in quadrant B | 2,692,903 | 699,150 |
| Events in quadrant C | 2,877,878 | 644,046 |
| Events in quadrant D | 2,917,388 | 559,467 |
| Mode M0 | |||
|---|---|---|---|
| Quadrant | BADHDUFLAG | Total packets | Discarded packets |
| A | 0 | 12037 | 3 |
| B | 0 | 10807 | 2 |
| C | 0 | 11474 | 2 |
| D | 0 | 11948 | 2 |
| Mode M9 | |||
|---|---|---|---|
| Quadrant | BADHDUFLAG | Total packets | Discarded packets |
| A | 0 | 24 | 0 |
| B | 0 | 24 | 0 |
| C | 0 | 24 | 0 |
| D | 0 | 25 | 0 |
| Mode SS | |||
|---|---|---|---|
| Quadrant | BADHDUFLAG | Total packets | Discarded packets |
| A | 0 | 104 | 0 |
| B | 0 | 104 | 0 |
| C | 0 | 104 | 0 |
| D | 0 | 104 | 0 |
| Quadrant | Total seconds | Saturated seconds | Saturation percentage |
|---|---|---|---|
| A | 5195 | 15 | 0.288739% |
| B | 5195 | 3 | 0.057748% |
| C | 5195 | 59 | 1.135707% |
| D | 5195 | 423 | 8.142445% |
Noise dominated data is calculated using 1-second bins in cleaned event files. If a bin has >2000 counts, and if more than 50% of those come from <1% of pixels, then it is considered to be noise-dominated and hence unusable.
| Quadrant | # 1 sec bins | Bins with >0 counts | Bins with >2000 counts | High rate bins dominated by noise | Noise dominated (total time) | Noise dominated (detector-on time) | Marked lightcurve |
|---|---|---|---|---|---|---|---|
| A | 7258 | 5196 | 5 | 5 | 0.07% | 0.10% | 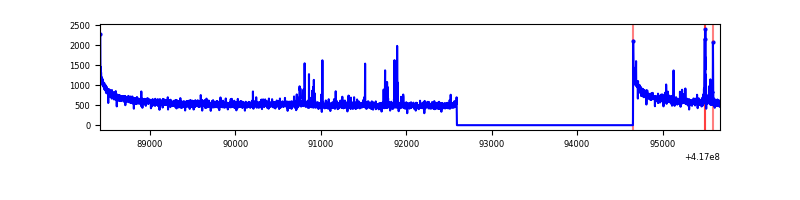 |
| B | 7258 | 5196 | 2 | 2 | 0.03% | 0.04% | 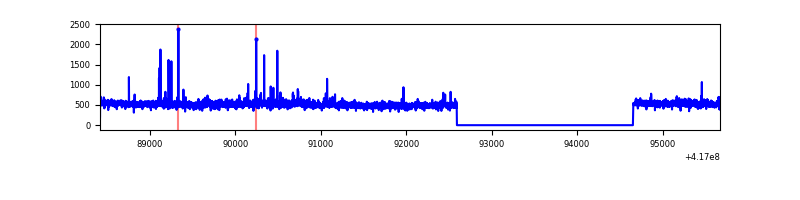 |
| C | 7258 | 5196 | 53 | 53 | 0.73% | 1.02% | 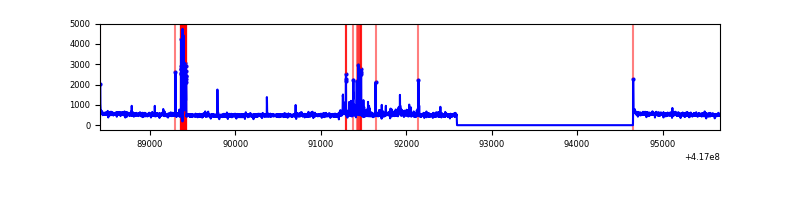 |
| D | 7258 | 5195 | 36 | 36 | 0.50% | 0.69% | 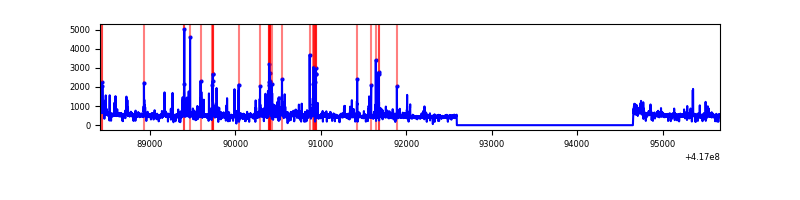 |
Top three noisy pixels from each quadrant. If the there are fewer than three noisy pixels in the level2.evt file, extra rows are filled as -1
| Pixel properties | Quadrant properties | ||||||
|---|---|---|---|---|---|---|---|
| Quadrant | DetID | PixID | Counts | Sigma | Mean | Median | Sigma |
| A | 10 | 83 | 462355 | 3658.47 | 628 | 618 | 126.2 |
| A | 2 | 79 | 56876 | 445.75 | 628 | 618 | 126.2 |
| A | 13 | 248 | 25120 | 194.14 | 628 | 618 | 126.2 |
| B | 3 | 112 | 206664 | 1783.77 | 618 | 603 | 115.5 |
| B | 4 | 170 | 39942 | 340.54 | 618 | 603 | 115.5 |
| B | 12 | 111 | 14142 | 117.2 | 618 | 603 | 115.5 |
| C | 15 | 214 | 226449 | 1639.03 | 601 | 606 | 137.8 |
| C | 14 | 254 | 217483 | 1573.96 | 601 | 606 | 137.8 |
| C | 5 | 250 | 61427 | 441.4 | 601 | 606 | 137.8 |
| D | 2 | 250 | 250408 | 1771.43 | 582 | 567 | 141.0 |
| D | 12 | 227 | 162245 | 1146.33 | 582 | 567 | 141.0 |
| D | 12 | 191 | 153069 | 1081.27 | 582 | 567 | 141.0 |
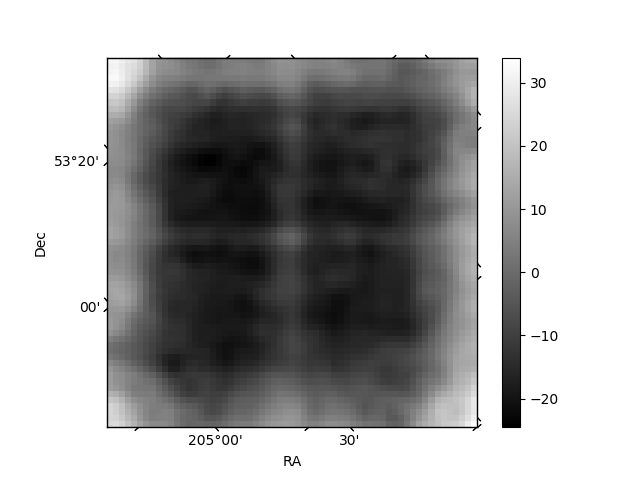
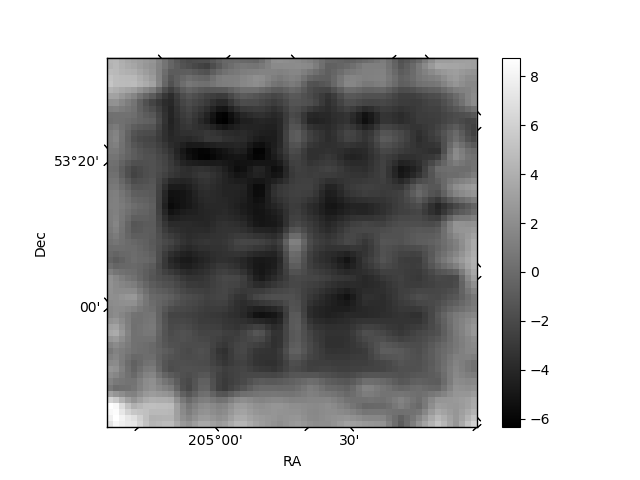
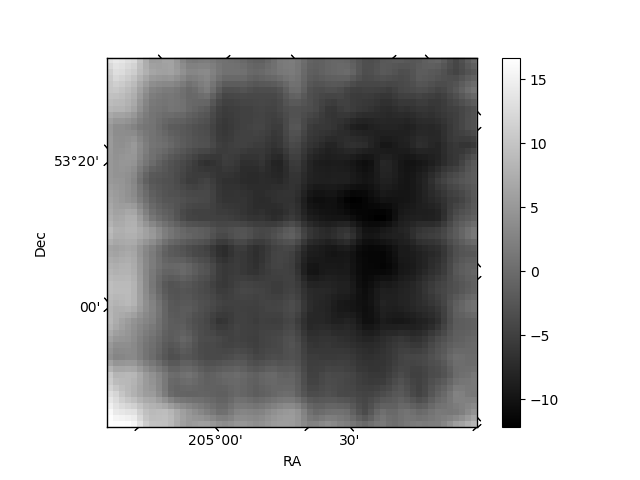
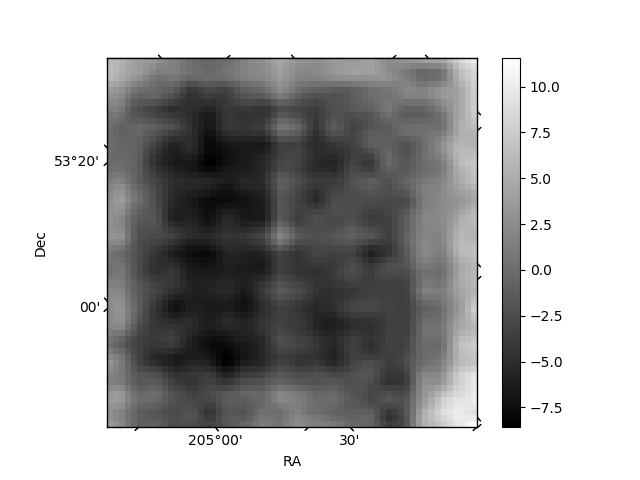
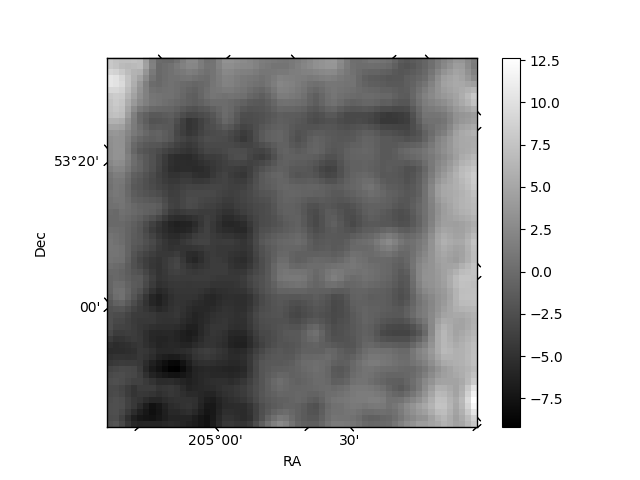
Histogram calculated using DETX and DETY for each event in the final _common_clean file
| Quadrant A | 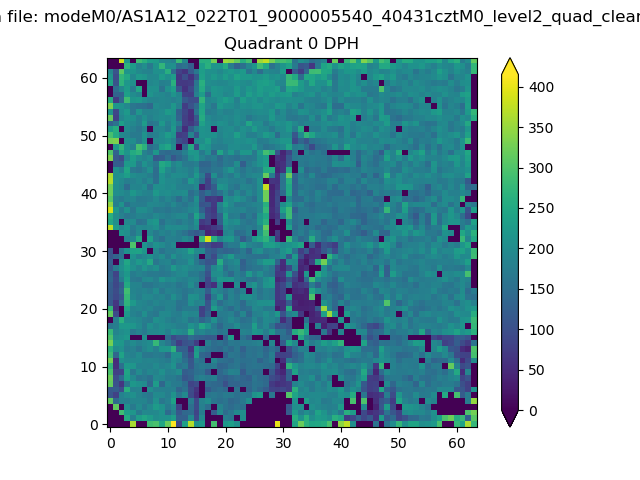 |
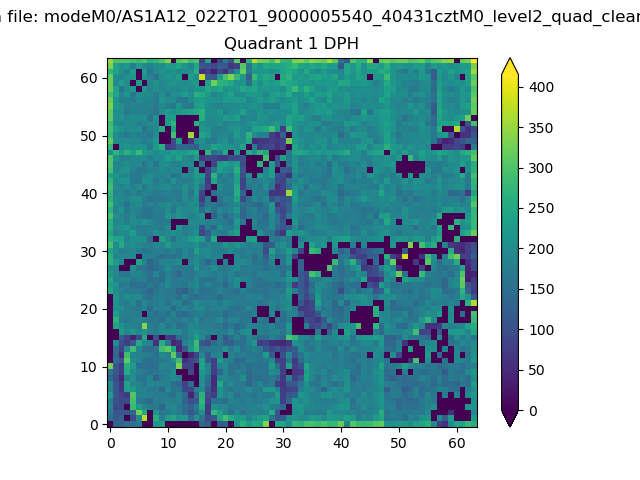 |
Quadrant B |
|---|---|---|---|
| Quadrant D | 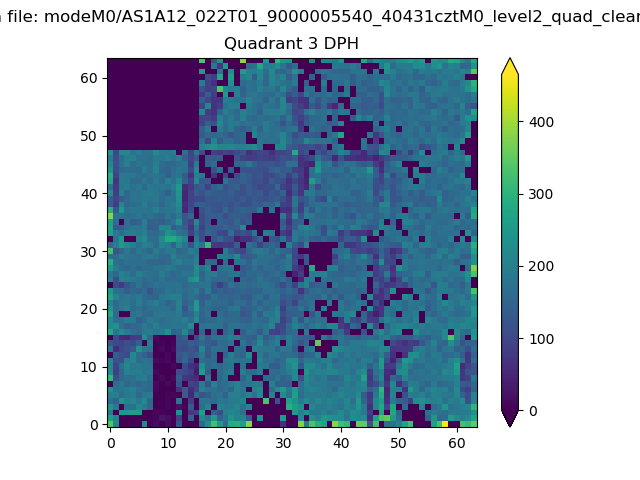 |
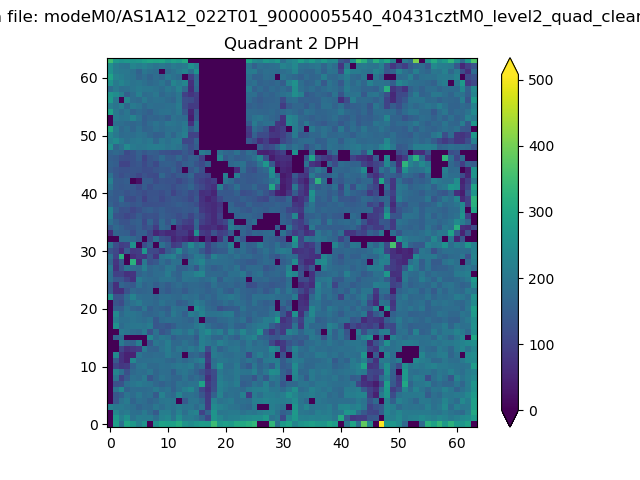 |
Quadrant C |
| Plot type | Count rate plots | Images |
|---|---|---|
| Comparison with Poisson distribution Blue bars denote a histogram of data divided into 1 sec bins. Red curve is a Poisson curve with rate = median count rate of data. |
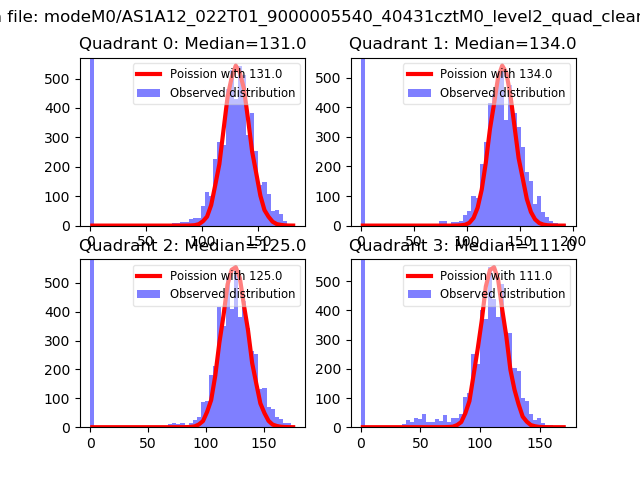 |
 |
| Quadrant-wise count rates Data is divided into 100 sec bins |
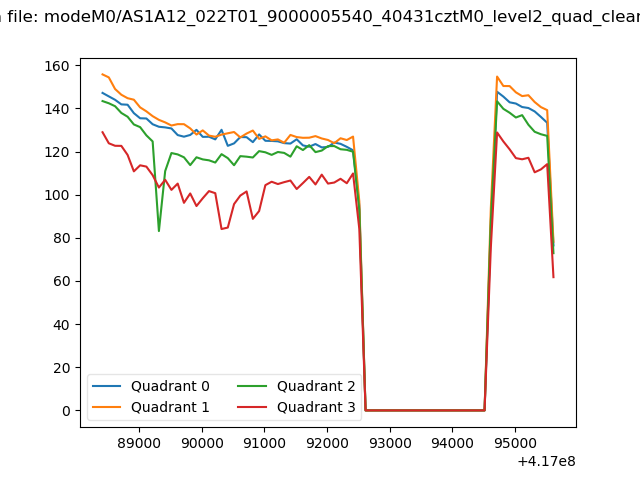 |
|
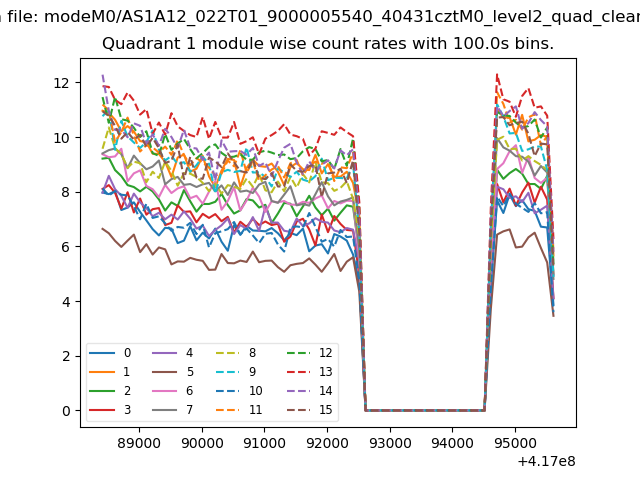
| Module-wise count rates for Quadrant A Data is divided into 100 sec bins |
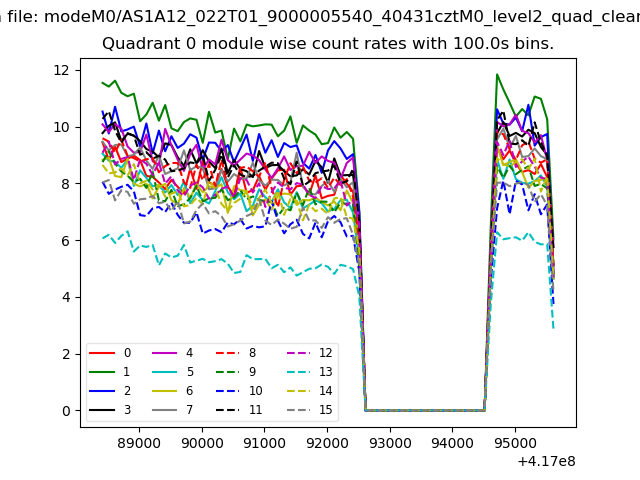 |
 |
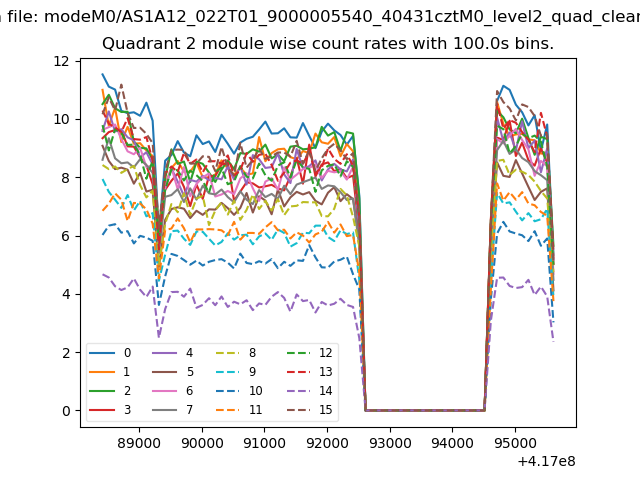
| Module-wise count rates for Quadrant B Data is divided into 100 sec bins |
 |
 |
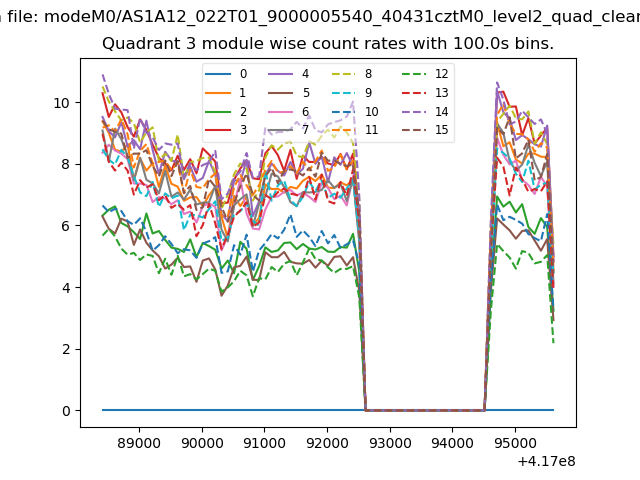
| Module-wise count rates for Quadrant C Data is divided into 100 sec bins |
 |
 |
| Module-wise count rates for Quadrant D Data is divided into 100 sec bins |
 |
 |
| Parameter | Plot |
|---|---|
| CZT HV Monitor | 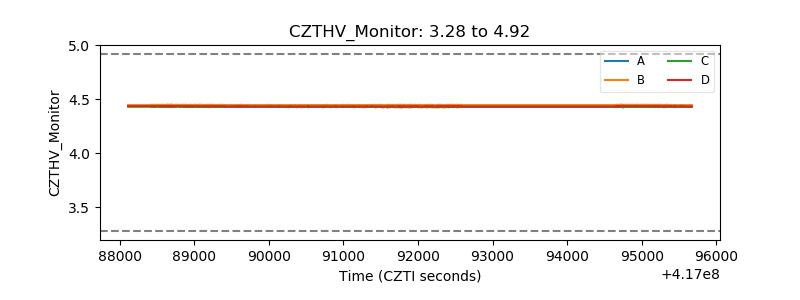 |
| D_VDD | 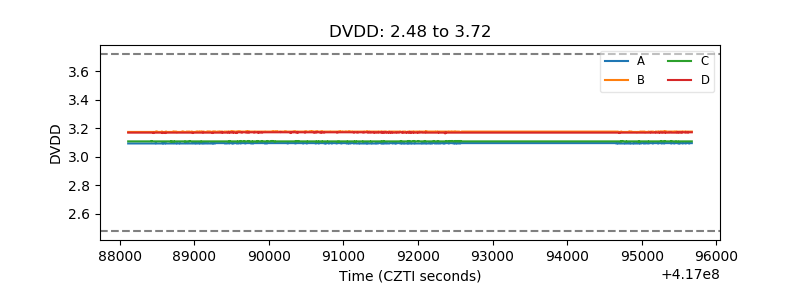 |
| Temperature 1 | 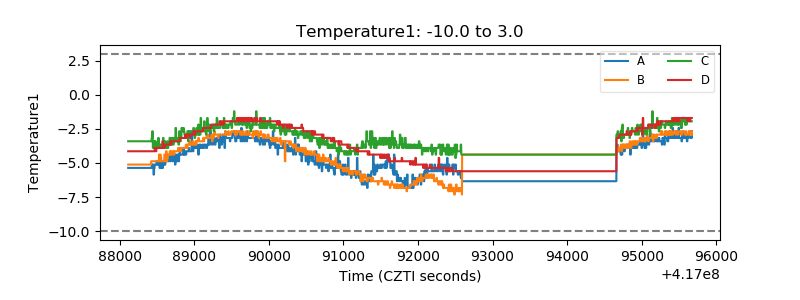 |
| Veto HV Monitor | 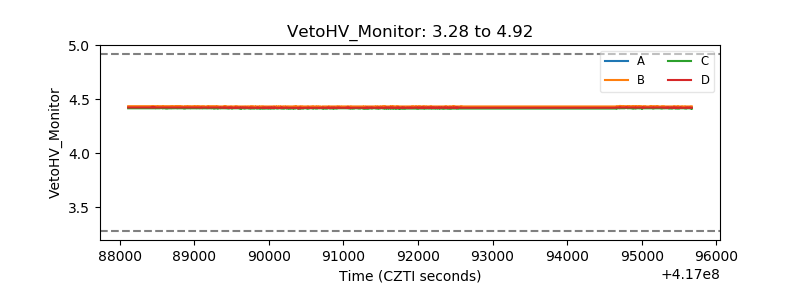 |
| Veto LLD | 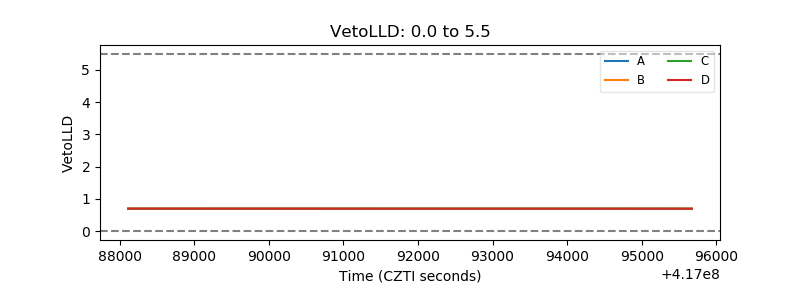 |
| Alpha Counter | 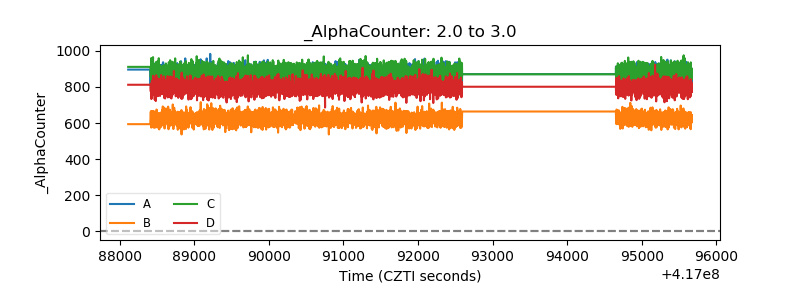 |
| _CPM_Rate |  |
| CZT Counter | 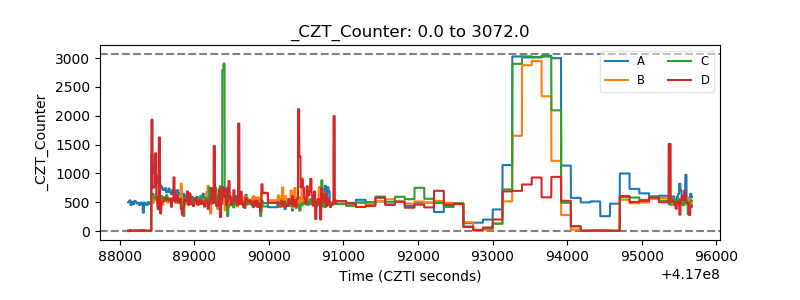 |
| +2.5 Volts monitor |  |
| +5 Volts monitor | 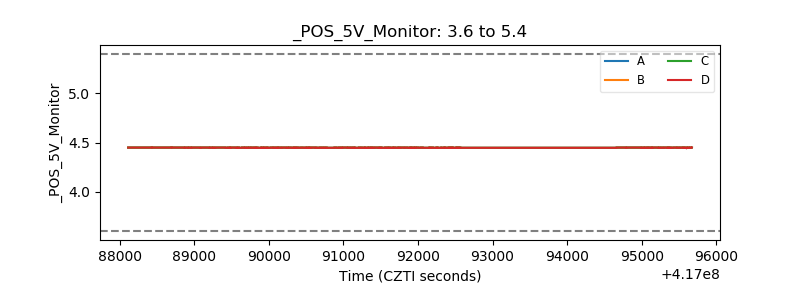 |
| _ROLL_ROT | 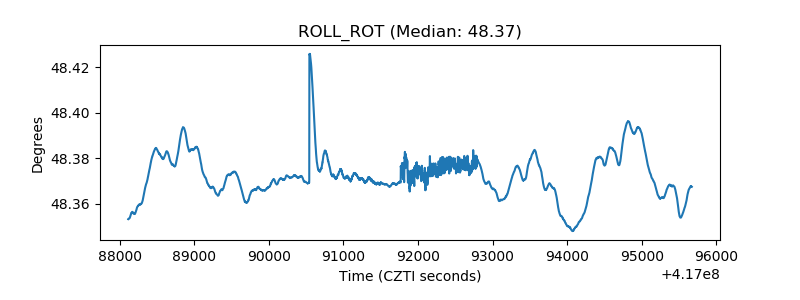 |
| _Roll_DEC | 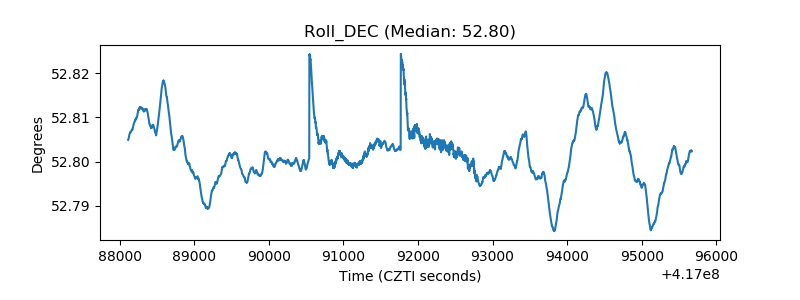 |
| _Roll_RA | 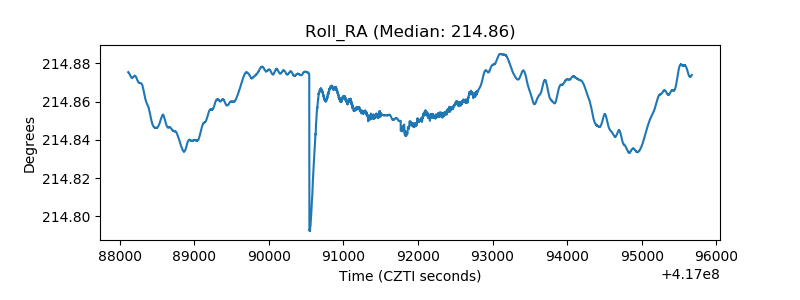 |
| Veto Counter | 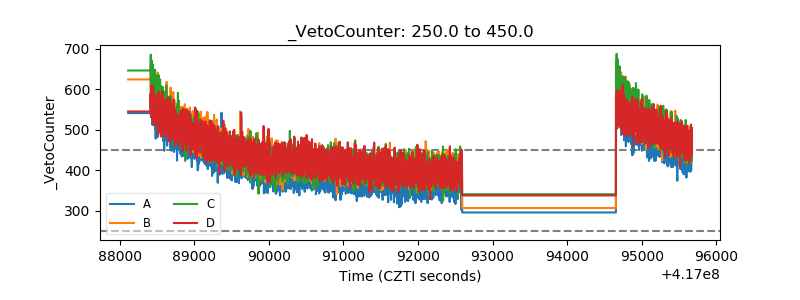 |