| Param | Original file | Final file |
|---|---|---|
| Filename | modeM0/AS1A12_022T01_9000005540_40432cztM0_level2.fits | modeM0/AS1A12_022T01_9000005540_40432cztM0_level2_quad_clean.evt |
| Size (bytes) | 312,891,840 | 96,252,480 |
| Size | 298.4 MB | 91.8 MB |
| Events in quadrant A | 3,013,574 | 670,100 |
| Events in quadrant B | 2,595,475 | 688,635 |
| Events in quadrant C | 2,595,285 | 642,908 |
| Events in quadrant D | 2,975,762 | 552,144 |
| Mode M0 | |||
|---|---|---|---|
| Quadrant | BADHDUFLAG | Total packets | Discarded packets |
| A | 0 | 12230 | 3 |
| B | 0 | 10606 | 2 |
| C | 0 | 10564 | 2 |
| D | 0 | 12153 | 2 |
| Mode M9 | |||
|---|---|---|---|
| Quadrant | BADHDUFLAG | Total packets | Discarded packets |
| A | 0 | 32 | 0 |
| B | 0 | 32 | 0 |
| C | 0 | 32 | 0 |
| D | 0 | 33 | 0 |
| Mode SS | |||
|---|---|---|---|
| Quadrant | BADHDUFLAG | Total packets | Discarded packets |
| A | 0 | 104 | 0 |
| B | 0 | 104 | 0 |
| C | 0 | 104 | 0 |
| D | 0 | 104 | 0 |
| Quadrant | Total seconds | Saturated seconds | Saturation percentage |
|---|---|---|---|
| A | 5156 | 33 | 0.640031% |
| B | 5156 | 5 | 0.096974% |
| C | 5156 | 5 | 0.096974% |
| D | 5156 | 450 | 8.727696% |
Noise dominated data is calculated using 1-second bins in cleaned event files. If a bin has >2000 counts, and if more than 50% of those come from <1% of pixels, then it is considered to be noise-dominated and hence unusable.
| Quadrant | # 1 sec bins | Bins with >0 counts | Bins with >2000 counts | High rate bins dominated by noise | Noise dominated (total time) | Noise dominated (detector-on time) | Marked lightcurve |
|---|---|---|---|---|---|---|---|
| A | 7280 | 5157 | 17 | 17 | 0.23% | 0.33% | 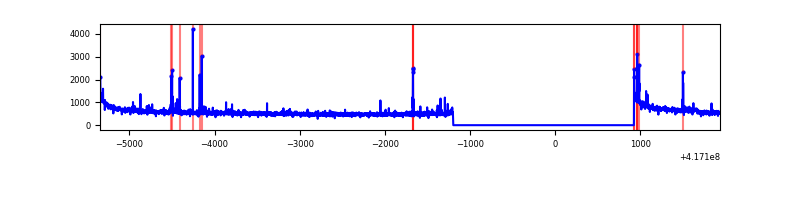 |
| B | 7280 | 5157 | 1 | 1 | 0.01% | 0.02% | 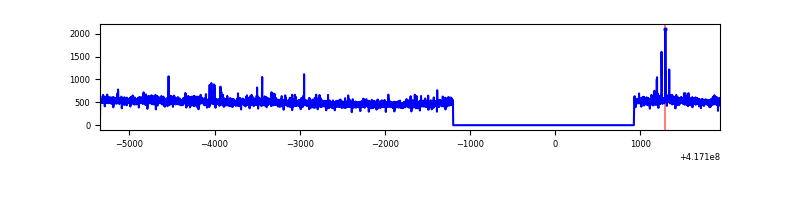 |
| C | 7280 | 5157 | 1 | 1 | 0.01% | 0.02% | 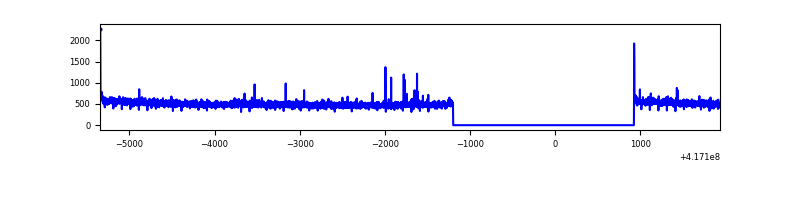 |
| D | 7280 | 5157 | 52 | 52 | 0.71% | 1.01% | 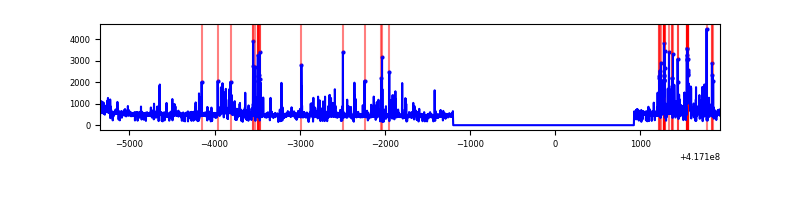 |
Top three noisy pixels from each quadrant. If the there are fewer than three noisy pixels in the level2.evt file, extra rows are filled as -1
| Pixel properties | Quadrant properties | ||||||
|---|---|---|---|---|---|---|---|
| Quadrant | DetID | PixID | Counts | Sigma | Mean | Median | Sigma |
| A | 10 | 83 | 469792 | 3797.29 | 616 | 607 | 123.6 |
| A | 15 | 235 | 52215 | 417.68 | 616 | 607 | 123.6 |
| A | 13 | 248 | 45459 | 363.0 | 616 | 607 | 123.6 |
| B | 3 | 112 | 134316 | 1162.9 | 610 | 594 | 115.0 |
| B | 4 | 170 | 50800 | 436.61 | 610 | 594 | 115.0 |
| B | 12 | 111 | 13906 | 115.77 | 610 | 594 | 115.0 |
| C | 15 | 214 | 222259 | 1625.92 | 599 | 605 | 136.3 |
| C | 5 | 250 | 13033 | 91.16 | 599 | 605 | 136.3 |
| C | 0 | 10 | 12418 | 86.65 | 599 | 605 | 136.3 |
| D | 13 | 171 | 205853 | 1485.54 | 571 | 556 | 138.2 |
| D | 12 | 191 | 149353 | 1076.7 | 571 | 556 | 138.2 |
| D | 2 | 250 | 142998 | 1030.72 | 571 | 556 | 138.2 |
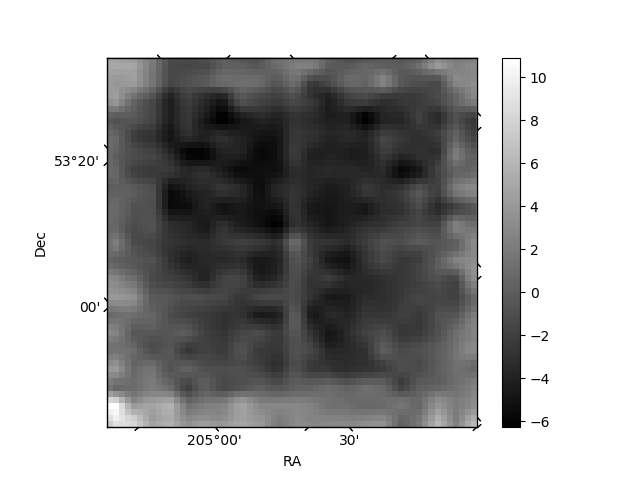
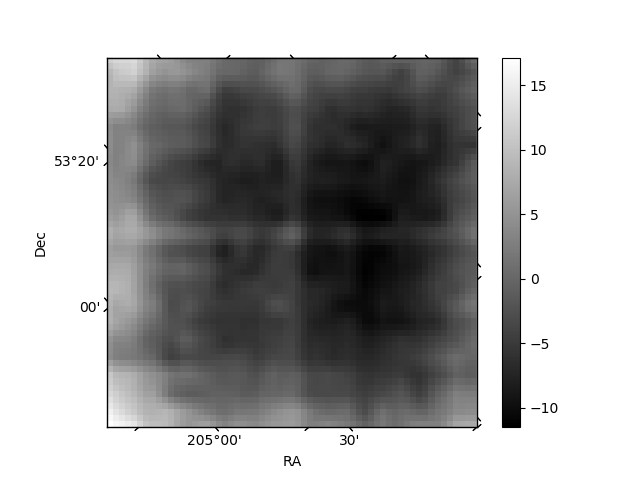
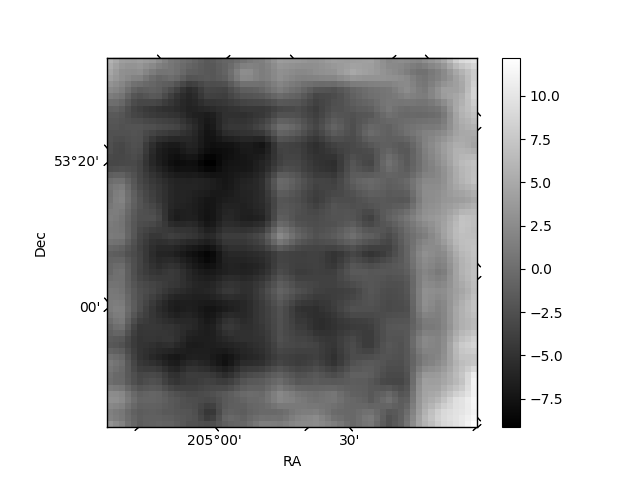
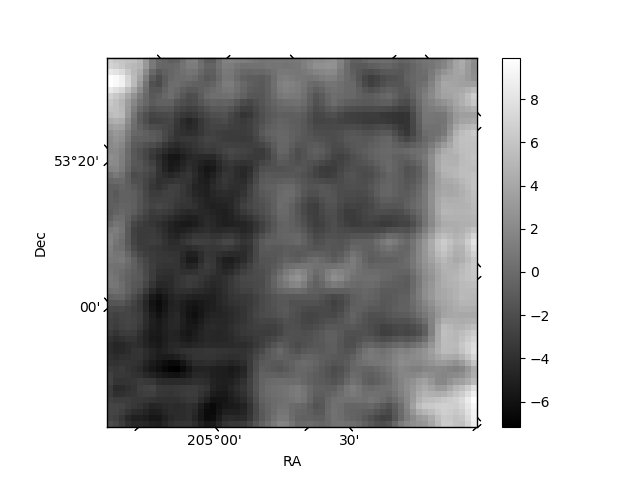
Histogram calculated using DETX and DETY for each event in the final _common_clean file
| Quadrant A | 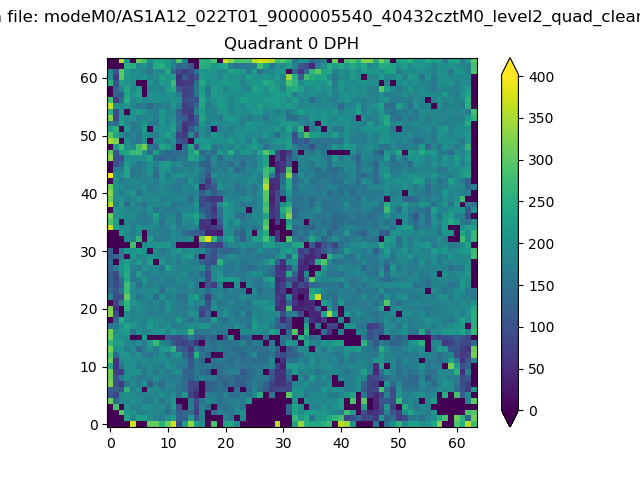 |
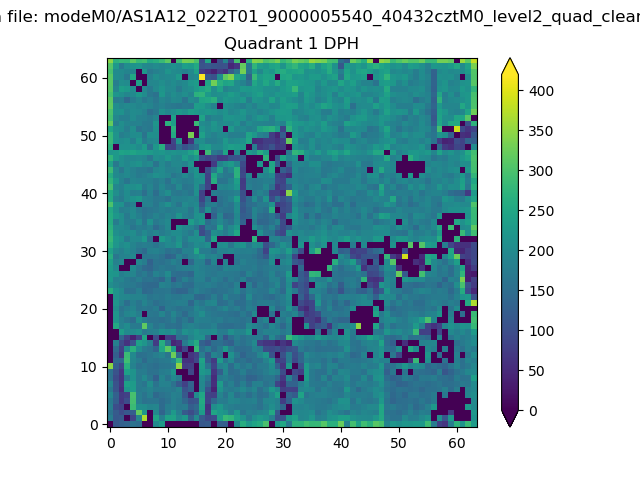 |
Quadrant B |
|---|---|---|---|
| Quadrant D | 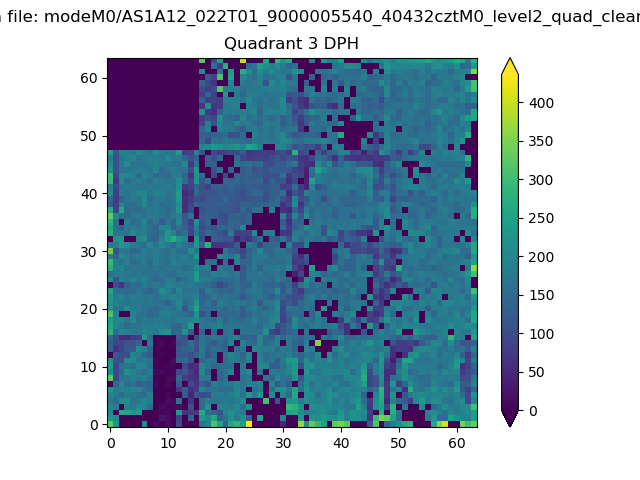 |
 |
Quadrant C |
| Plot type | Count rate plots | Images |
|---|---|---|
| Comparison with Poisson distribution Blue bars denote a histogram of data divided into 1 sec bins. Red curve is a Poisson curve with rate = median count rate of data. |
 |
 |
| Quadrant-wise count rates Data is divided into 100 sec bins |
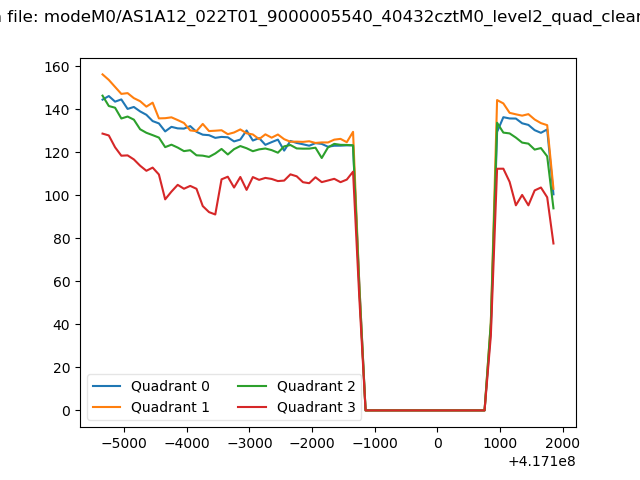 |
|
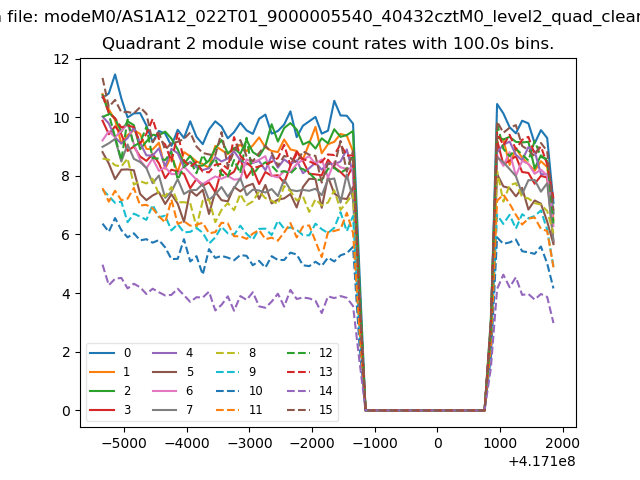
| Module-wise count rates for Quadrant A Data is divided into 100 sec bins |
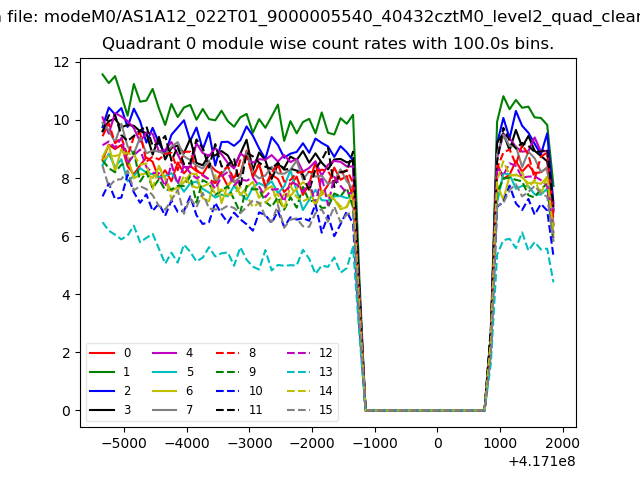 |
 |
| Module-wise count rates for Quadrant B Data is divided into 100 sec bins |
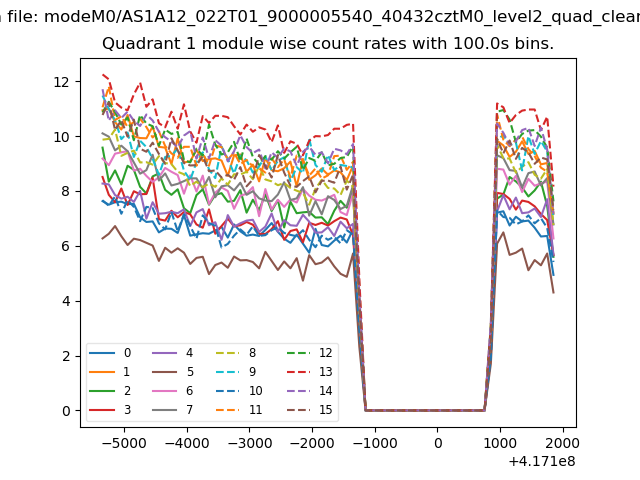 |
 |
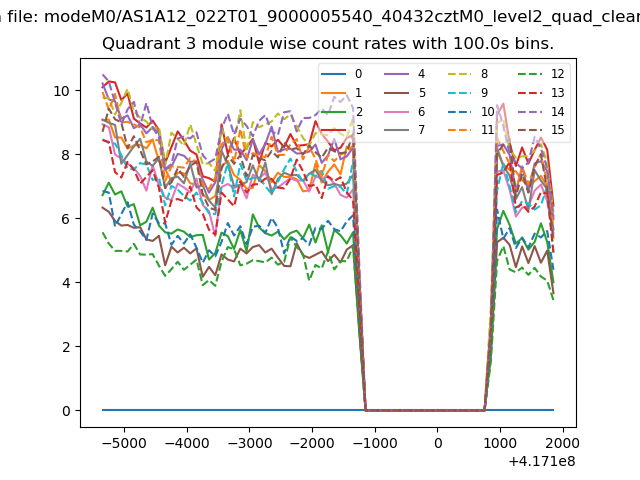
| Module-wise count rates for Quadrant C Data is divided into 100 sec bins |
 |
 |
| Module-wise count rates for Quadrant D Data is divided into 100 sec bins |
 |
 |
| Parameter | Plot |
|---|---|
| CZT HV Monitor |  |
| D_VDD | 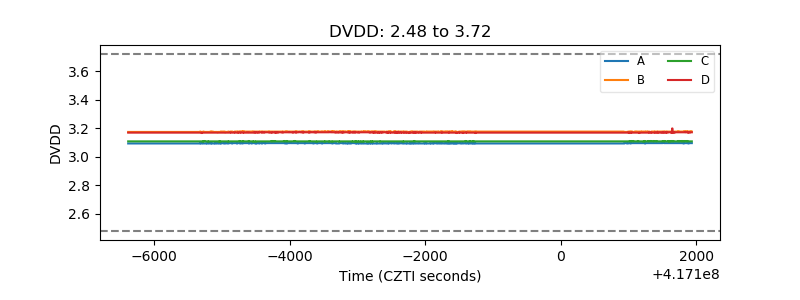 |
| Temperature 1 | 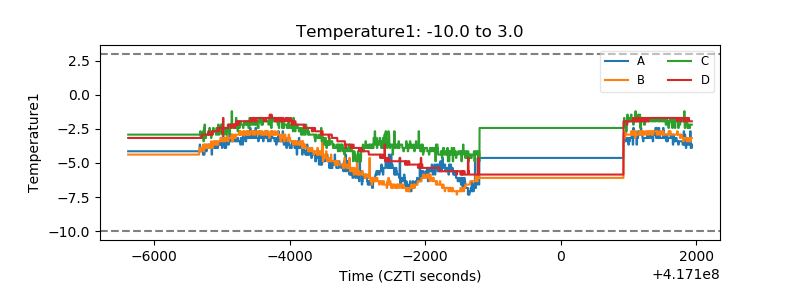 |
| Veto HV Monitor | 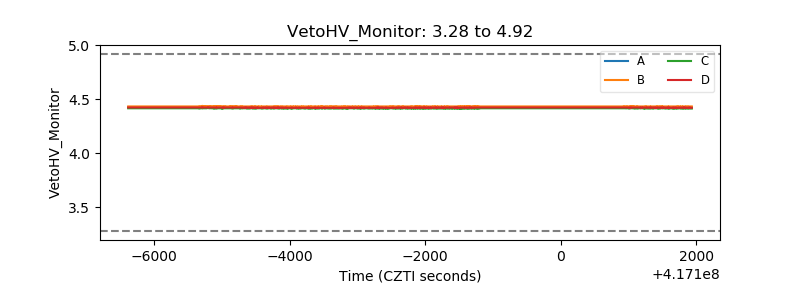 |
| Veto LLD | 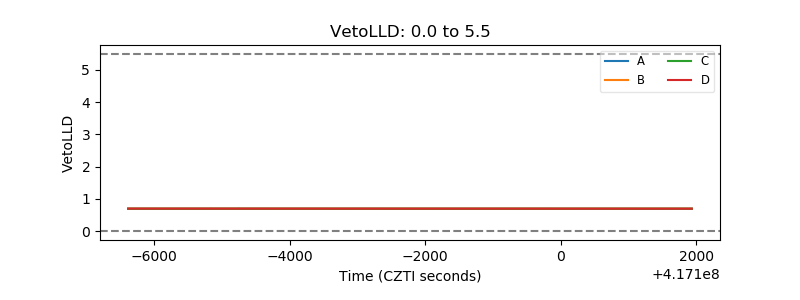 |
| Alpha Counter | 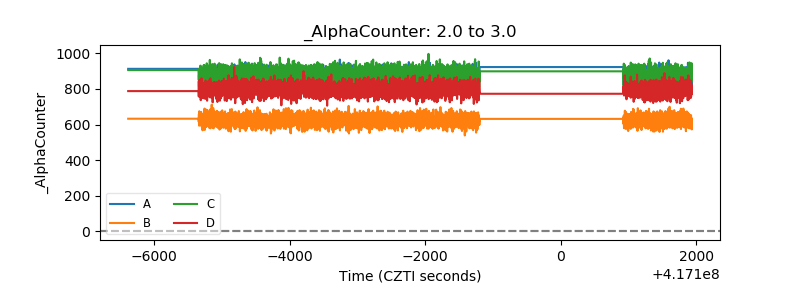 |
| _CPM_Rate | 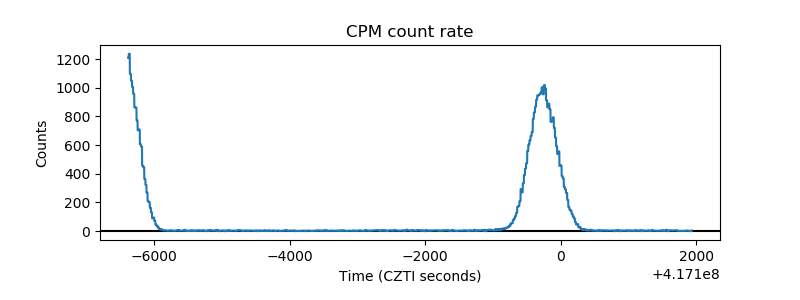 |
| CZT Counter |  |
| +2.5 Volts monitor | 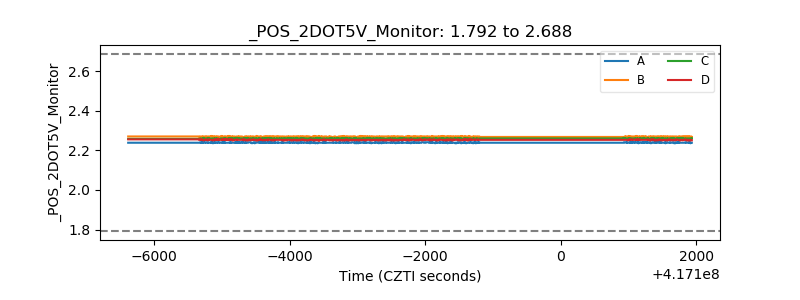 |
| +5 Volts monitor | 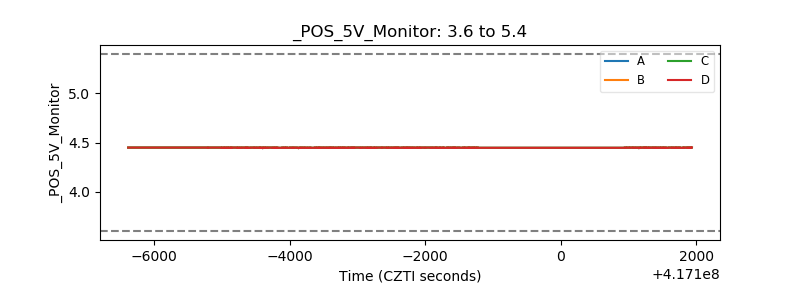 |
| _ROLL_ROT | 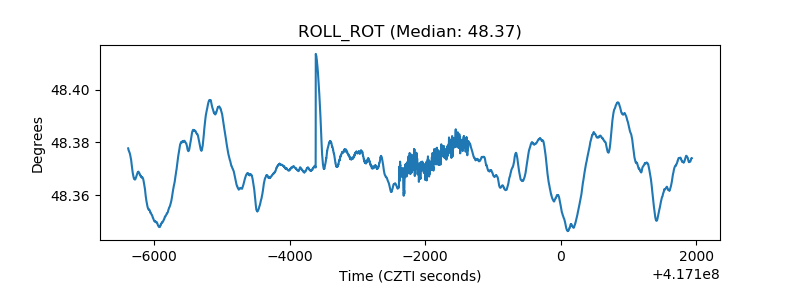 |
| _Roll_DEC | 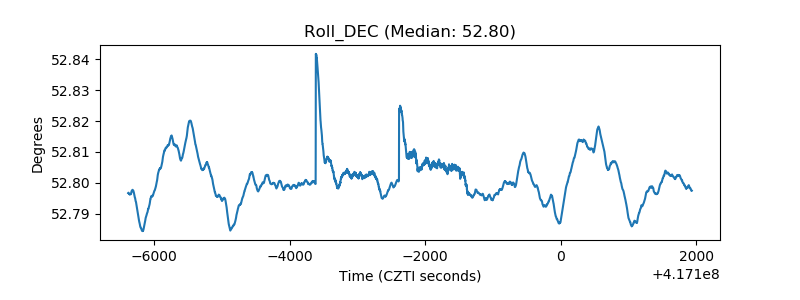 |
| _Roll_RA | 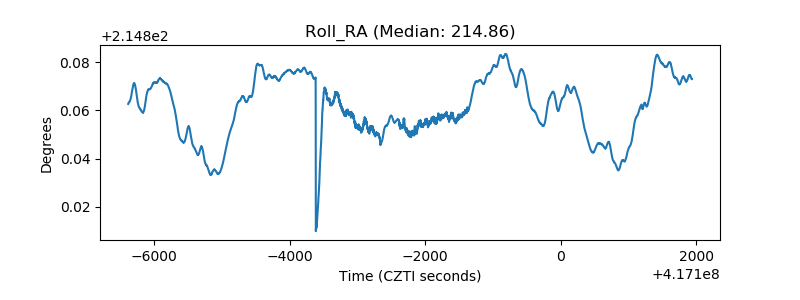 |
| Veto Counter | 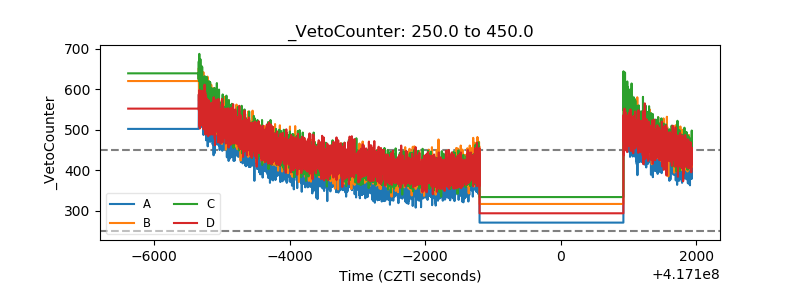 |