| Param | Original file | Final file |
|---|---|---|
| Filename | modeM0/AS1A12_022T01_9000005540_40433cztM0_level2.fits | modeM0/AS1A12_022T01_9000005540_40433cztM0_level2_quad_clean.evt |
| Size (bytes) | 304,767,360 | 89,565,120 |
| Size | 290.6 MB | 85.4 MB |
| Events in quadrant A | 2,816,524 | 620,785 |
| Events in quadrant B | 2,410,532 | 634,991 |
| Events in quadrant C | 2,436,704 | 597,766 |
| Events in quadrant D | 3,226,699 | 507,371 |
| Mode M0 | |||
|---|---|---|---|
| Quadrant | BADHDUFLAG | Total packets | Discarded packets |
| A | 0 | 11553 | 3 |
| B | 0 | 10255 | 2 |
| C | 0 | 10154 | 2 |
| D | 0 | 12959 | 2 |
| Mode M9 | |||
|---|---|---|---|
| Quadrant | BADHDUFLAG | Total packets | Discarded packets |
| A | 0 | 25 | 0 |
| B | 0 | 25 | 0 |
| C | 0 | 25 | 0 |
| D | 0 | 26 | 0 |
| Mode SS | |||
|---|---|---|---|
| Quadrant | BADHDUFLAG | Total packets | Discarded packets |
| A | 0 | 102 | 0 |
| B | 0 | 102 | 0 |
| C | 0 | 102 | 0 |
| D | 0 | 102 | 0 |
| Quadrant | Total seconds | Saturated seconds | Saturation percentage |
|---|---|---|---|
| A | 5011 | 27 | 0.538815% |
| B | 5011 | 6 | 0.119737% |
| C | 5011 | 4 | 0.079824% |
| D | 5011 | 492 | 9.818400% |
Noise dominated data is calculated using 1-second bins in cleaned event files. If a bin has >2000 counts, and if more than 50% of those come from <1% of pixels, then it is considered to be noise-dominated and hence unusable.
| Quadrant | # 1 sec bins | Bins with >0 counts | Bins with >2000 counts | High rate bins dominated by noise | Noise dominated (total time) | Noise dominated (detector-on time) | Marked lightcurve |
|---|---|---|---|---|---|---|---|
| A | 7133 | 5012 | 11 | 11 | 0.15% | 0.22% | 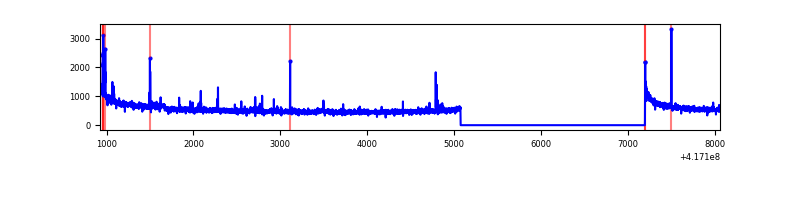 |
| B | 7133 | 5012 | 2 | 2 | 0.03% | 0.04% | 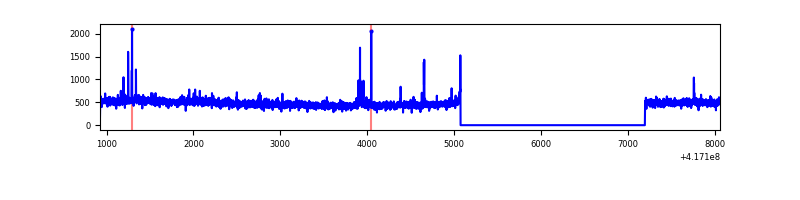 |
| C | 7133 | 5012 | 1 | 1 | 0.01% | 0.02% | 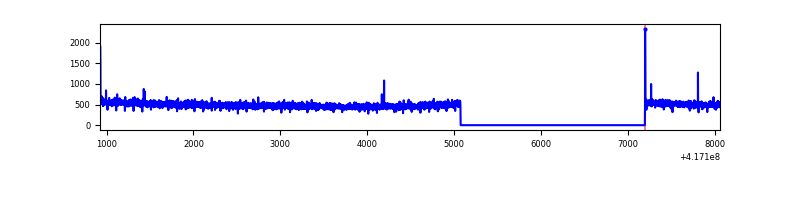 |
| D | 7133 | 5012 | 88 | 88 | 1.23% | 1.76% | 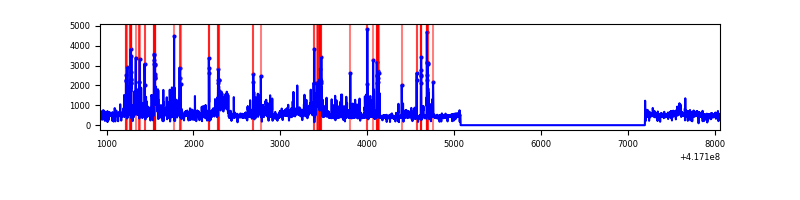 |
Top three noisy pixels from each quadrant. If the there are fewer than three noisy pixels in the level2.evt file, extra rows are filled as -1
| Pixel properties | Quadrant properties | ||||||
|---|---|---|---|---|---|---|---|
| Quadrant | DetID | PixID | Counts | Sigma | Mean | Median | Sigma |
| A | 10 | 83 | 467556 | 4038.14 | 574 | 565 | 115.6 |
| A | 15 | 235 | 52622 | 450.14 | 574 | 565 | 115.6 |
| A | 2 | 79 | 34374 | 292.35 | 574 | 565 | 115.6 |
| B | 3 | 112 | 85726 | 781.94 | 572 | 557 | 108.9 |
| B | 4 | 170 | 45906 | 416.35 | 572 | 557 | 108.9 |
| B | 4 | 171 | 20420 | 182.36 | 572 | 557 | 108.9 |
| C | 15 | 214 | 218231 | 1680.1 | 563 | 568 | 129.6 |
| C | 0 | 10 | 11224 | 82.25 | 563 | 568 | 129.6 |
| C | 5 | 250 | 9077 | 65.68 | 563 | 568 | 129.6 |
| D | 12 | 227 | 424214 | 3248.56 | 533 | 517 | 130.4 |
| D | 13 | 171 | 196849 | 1505.31 | 533 | 517 | 130.4 |
| D | 12 | 128 | 176912 | 1352.45 | 533 | 517 | 130.4 |
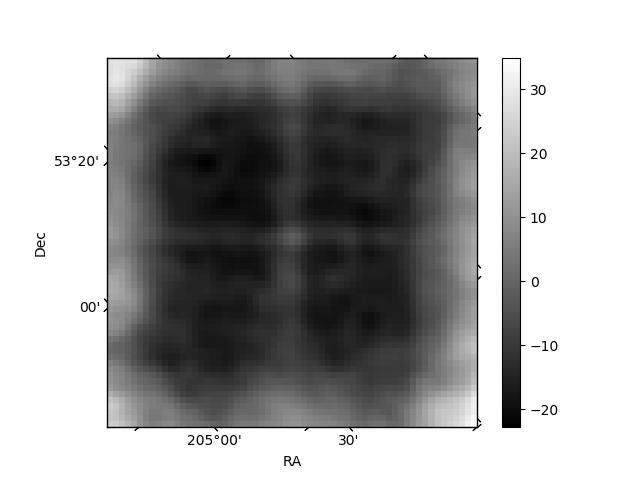
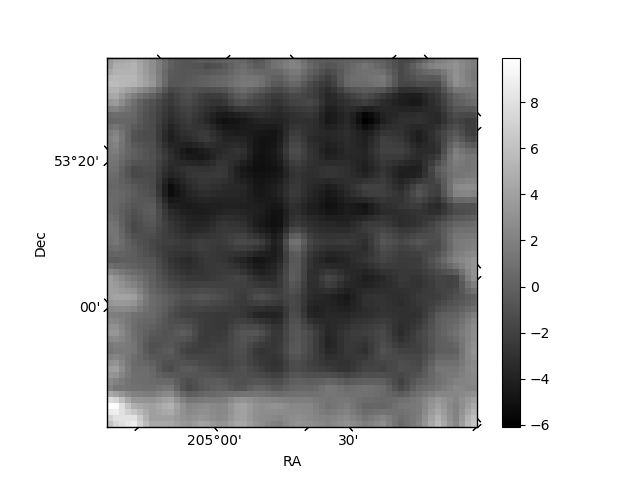
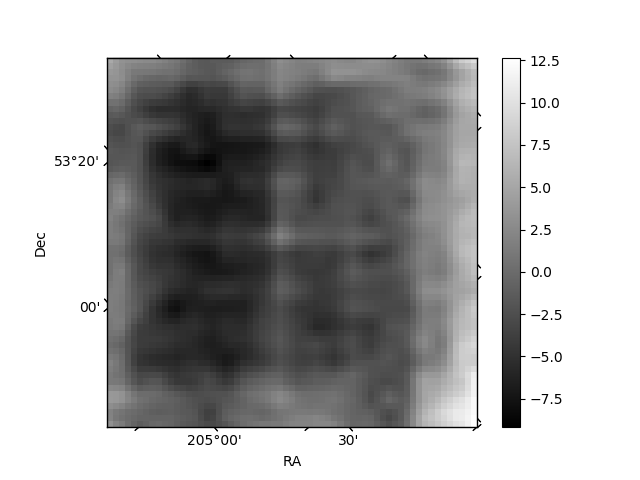
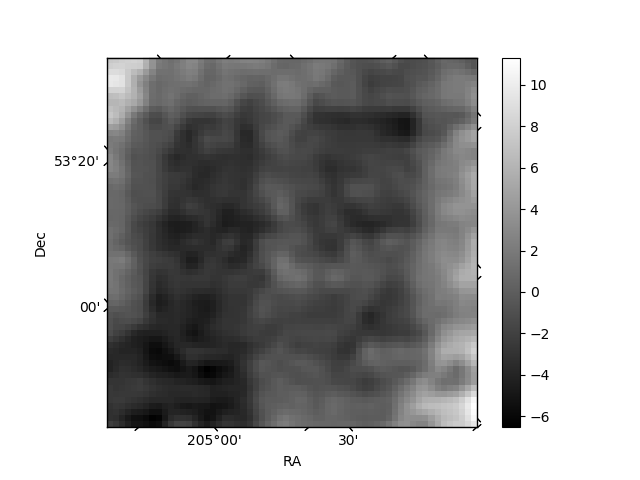
Histogram calculated using DETX and DETY for each event in the final _common_clean file
| Quadrant A | 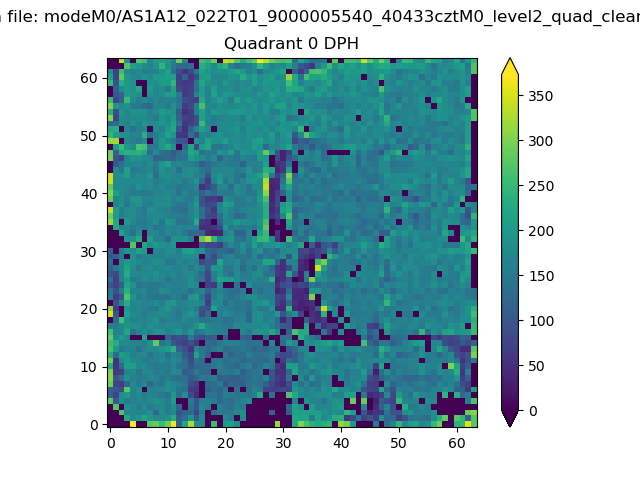 |
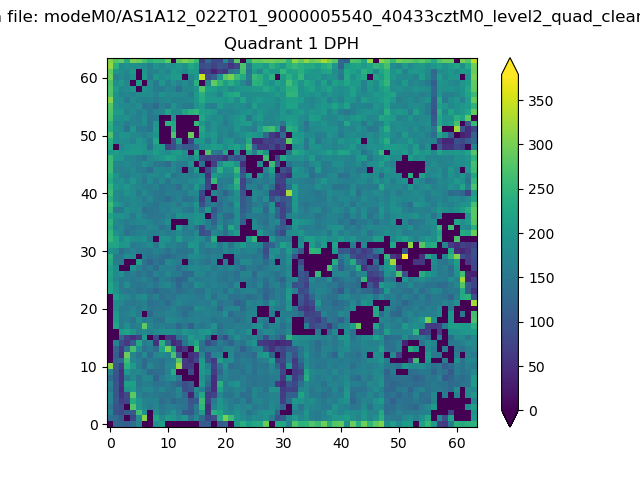 |
Quadrant B |
|---|---|---|---|
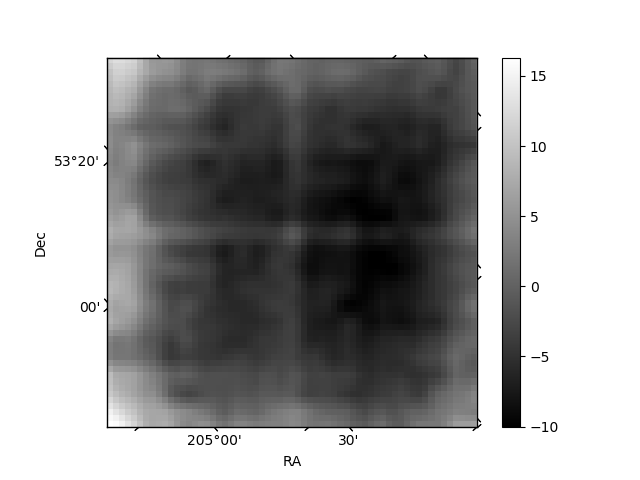
| Quadrant D | 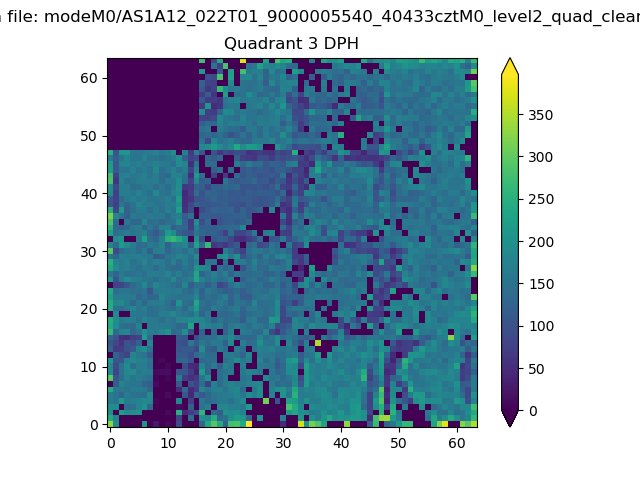 |
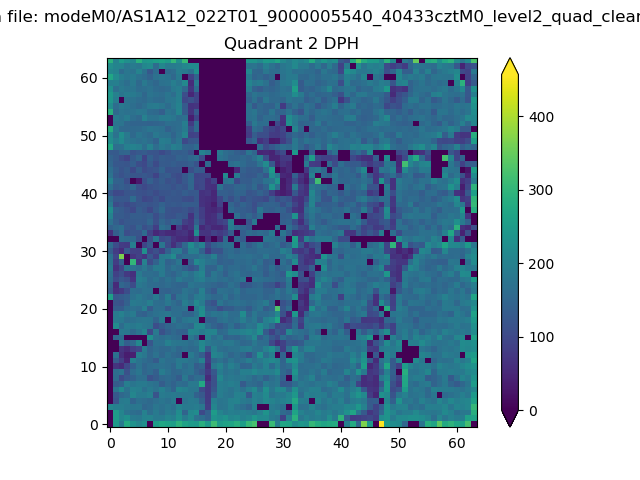 |
Quadrant C |
| Plot type | Count rate plots | Images |
|---|---|---|
| Comparison with Poisson distribution Blue bars denote a histogram of data divided into 1 sec bins. Red curve is a Poisson curve with rate = median count rate of data. |
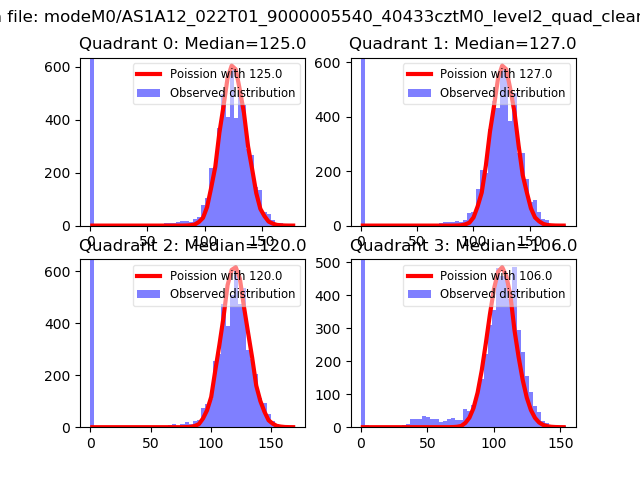 |
 |
| Quadrant-wise count rates Data is divided into 100 sec bins |
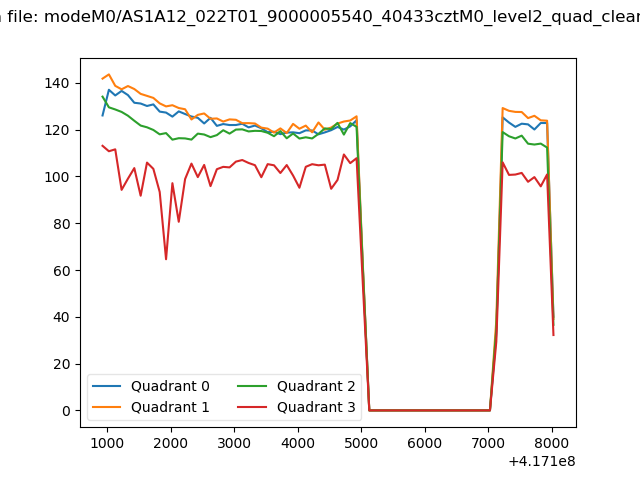 |
|
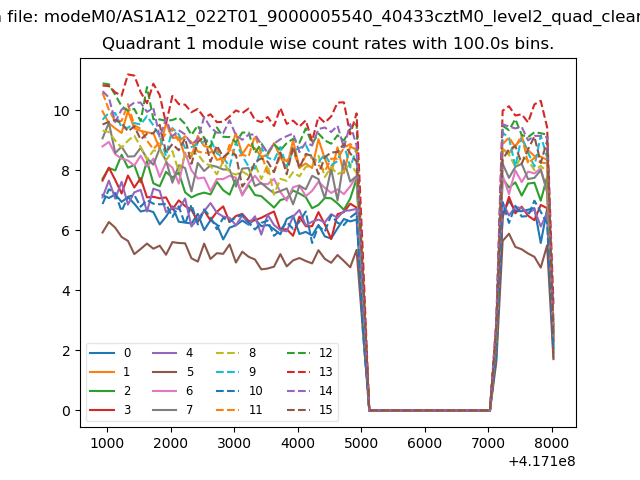
| Module-wise count rates for Quadrant A Data is divided into 100 sec bins |
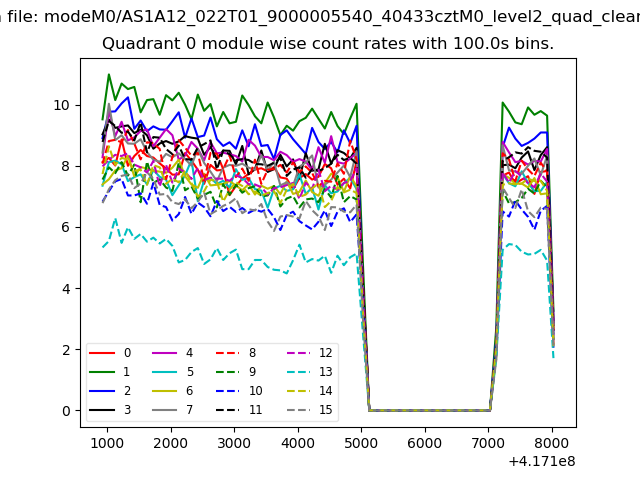 |
 |
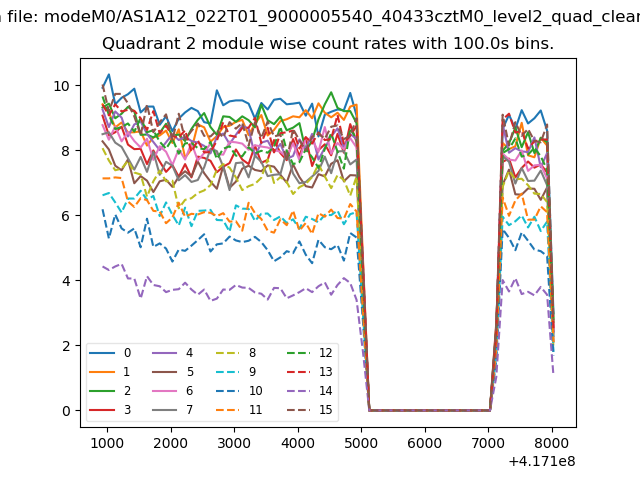
| Module-wise count rates for Quadrant B Data is divided into 100 sec bins |
 |
 |
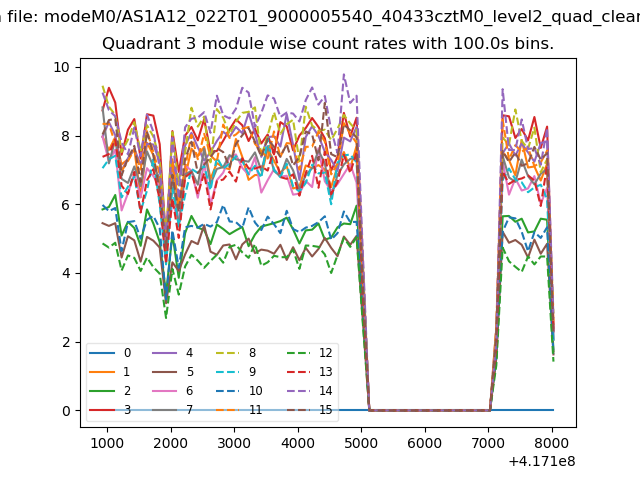
| Module-wise count rates for Quadrant C Data is divided into 100 sec bins |
 |
 |
| Module-wise count rates for Quadrant D Data is divided into 100 sec bins |
 |
 |
| Parameter | Plot |
|---|---|
| CZT HV Monitor | 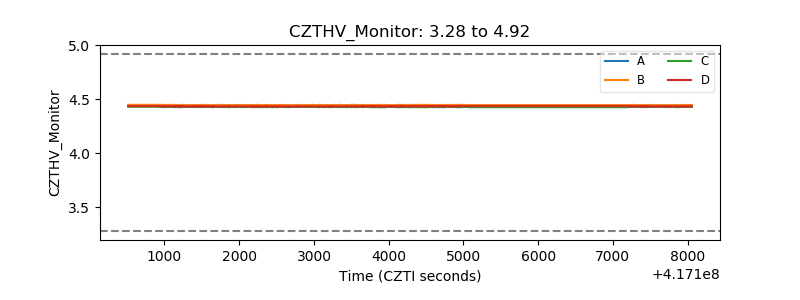 |
| D_VDD | 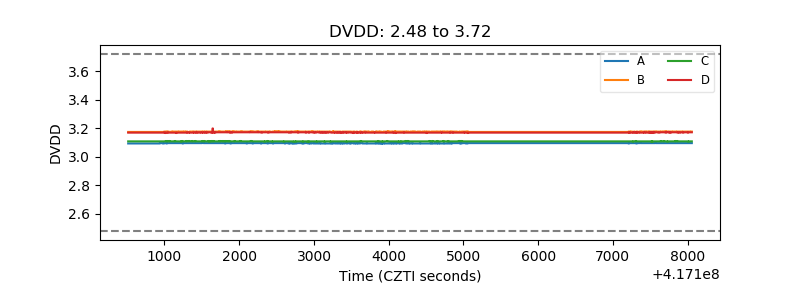 |
| Temperature 1 | 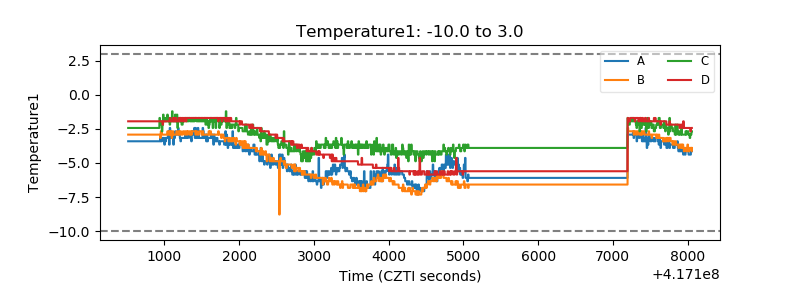 |
| Veto HV Monitor | 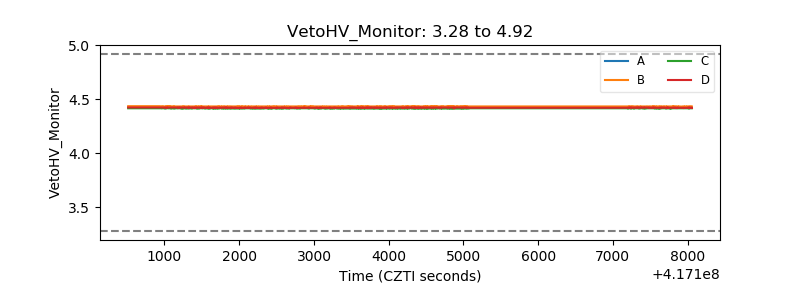 |
| Veto LLD | 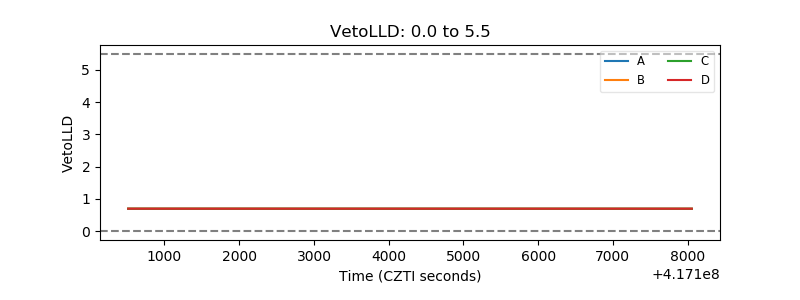 |
| Alpha Counter | 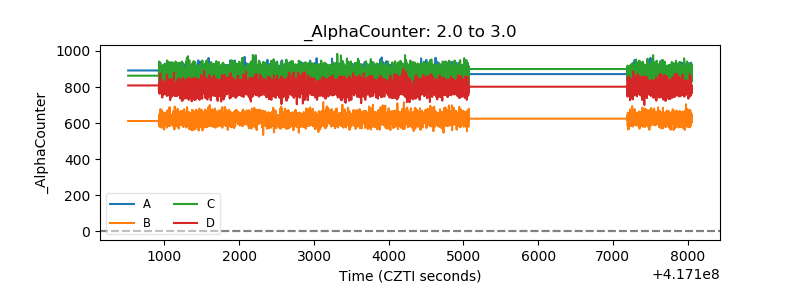 |
| _CPM_Rate |  |
| CZT Counter | 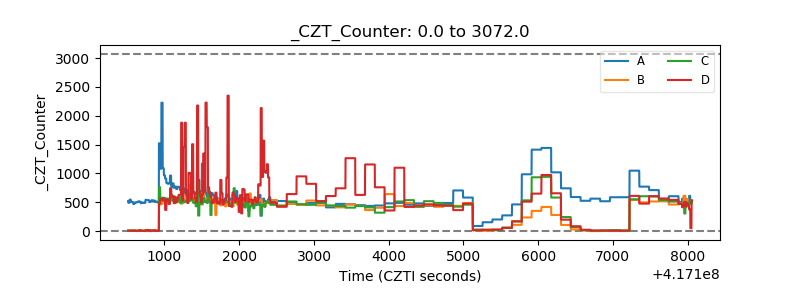 |
| +2.5 Volts monitor |  |
| +5 Volts monitor | 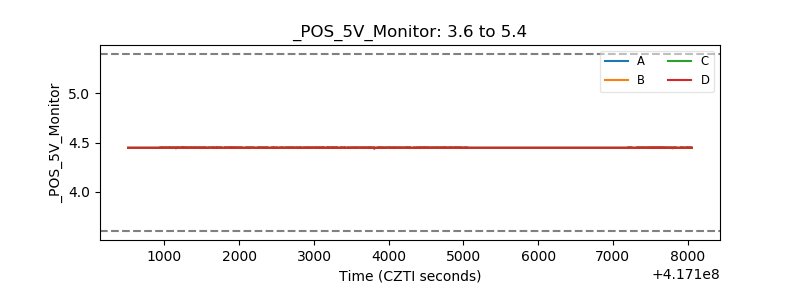 |
| _ROLL_ROT | 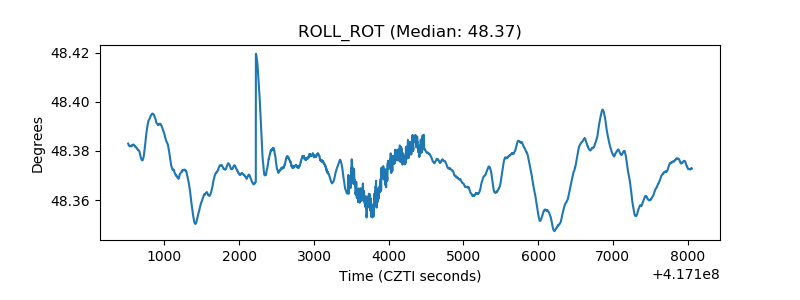 |
| _Roll_DEC | 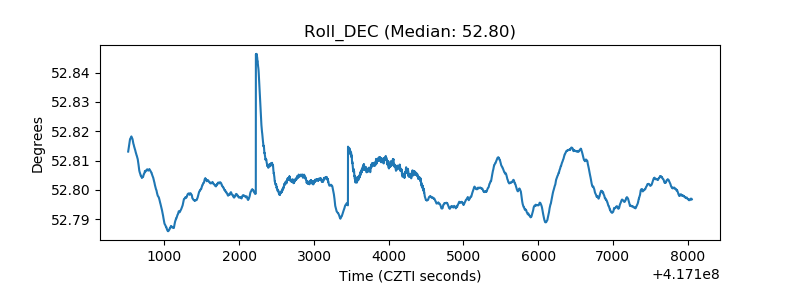 |
| _Roll_RA | 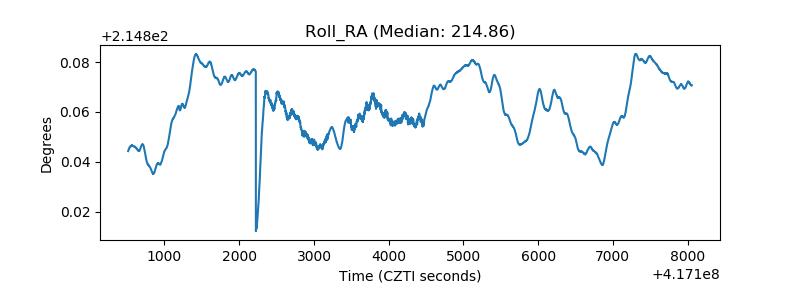 |
| Veto Counter | 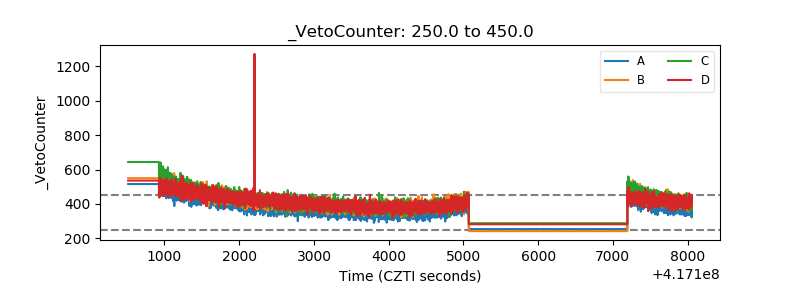 |