| Param | Original file | Final file |
|---|---|---|
| Filename | modeM0/AS1A12_022T01_9000005540_40434cztM0_level2.fits | modeM0/AS1A12_022T01_9000005540_40434cztM0_level2_quad_clean.evt |
| Size (bytes) | 293,713,920 | 85,049,280 |
| Size | 280.1 MB | 81.1 MB |
| Events in quadrant A | 2,703,598 | 582,838 |
| Events in quadrant B | 2,378,235 | 593,421 |
| Events in quadrant C | 2,368,224 | 566,864 |
| Events in quadrant D | 3,032,248 | 481,884 |
| Mode M0 | |||
|---|---|---|---|
| Quadrant | BADHDUFLAG | Total packets | Discarded packets |
| A | 0 | 11193 | 3 |
| B | 0 | 10396 | 2 |
| C | 0 | 10154 | 2 |
| D | 0 | 12557 | 2 |
| Mode M9 | |||
|---|---|---|---|
| Quadrant | BADHDUFLAG | Total packets | Discarded packets |
| A | 0 | 33 | 0 |
| B | 0 | 33 | 0 |
| C | 0 | 33 | 0 |
| D | 0 | 34 | 0 |
| Mode SS | |||
|---|---|---|---|
| Quadrant | BADHDUFLAG | Total packets | Discarded packets |
| A | 0 | 102 | 0 |
| B | 0 | 102 | 0 |
| C | 0 | 102 | 0 |
| D | 0 | 102 | 0 |
| Quadrant | Total seconds | Saturated seconds | Saturation percentage |
|---|---|---|---|
| A | 4995 | 16 | 0.320320% |
| B | 4995 | 21 | 0.420420% |
| C | 4995 | 7 | 0.140140% |
| D | 4995 | 488 | 9.769770% |
Noise dominated data is calculated using 1-second bins in cleaned event files. If a bin has >2000 counts, and if more than 50% of those come from <1% of pixels, then it is considered to be noise-dominated and hence unusable.
| Quadrant | # 1 sec bins | Bins with >0 counts | Bins with >2000 counts | High rate bins dominated by noise | Noise dominated (total time) | Noise dominated (detector-on time) | Marked lightcurve |
|---|---|---|---|---|---|---|---|
| A | 6968 | 4996 | 9 | 9 | 0.13% | 0.18% | 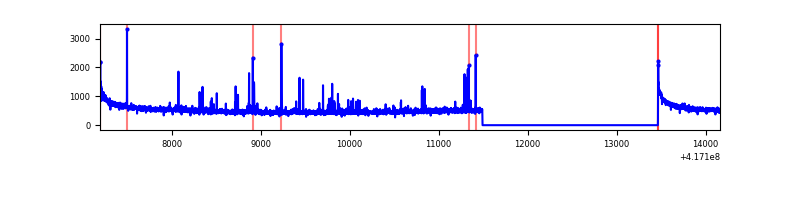 |
| B | 6968 | 4996 | 12 | 12 | 0.17% | 0.24% | 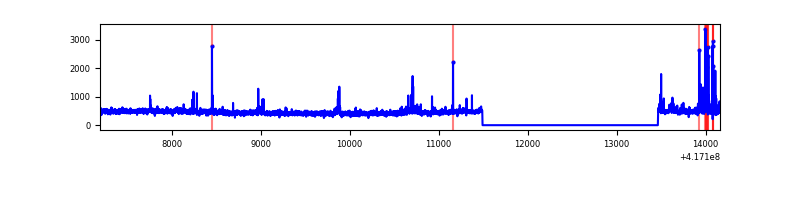 |
| C | 6968 | 4996 | 2 | 2 | 0.03% | 0.04% | 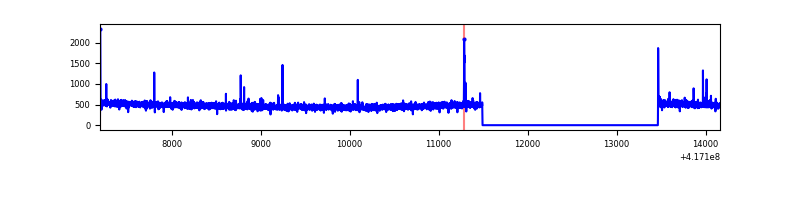 |
| D | 6968 | 4996 | 148 | 148 | 2.12% | 2.96% | 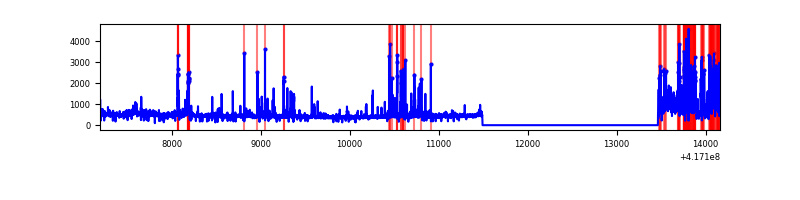 |
Top three noisy pixels from each quadrant. If the there are fewer than three noisy pixels in the level2.evt file, extra rows are filled as -1
| Pixel properties | Quadrant properties | ||||||
|---|---|---|---|---|---|---|---|
| Quadrant | DetID | PixID | Counts | Sigma | Mean | Median | Sigma |
| A | 10 | 83 | 466170 | 4147.67 | 548 | 537 | 112.3 |
| A | 2 | 79 | 112688 | 999.0 | 548 | 537 | 112.3 |
| A | 3 | 137 | 5958 | 48.29 | 548 | 537 | 112.3 |
| B | 4 | 170 | 124852 | 1183.83 | 545 | 529 | 105.0 |
| B | 3 | 112 | 77380 | 731.79 | 545 | 529 | 105.0 |
| B | 0 | 245 | 20733 | 192.39 | 545 | 529 | 105.0 |
| C | 15 | 214 | 219109 | 1727.87 | 540 | 545 | 126.5 |
| C | 14 | 254 | 24696 | 190.93 | 540 | 545 | 126.5 |
| C | 0 | 10 | 11987 | 90.46 | 540 | 545 | 126.5 |
| D | 12 | 227 | 674491 | 5389.36 | 509 | 496 | 125.1 |
| D | 2 | 250 | 126917 | 1010.88 | 509 | 496 | 125.1 |
| D | 12 | 191 | 123959 | 987.23 | 509 | 496 | 125.1 |
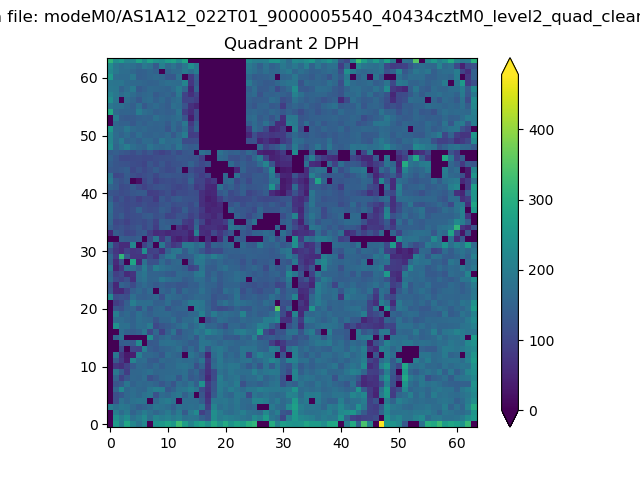
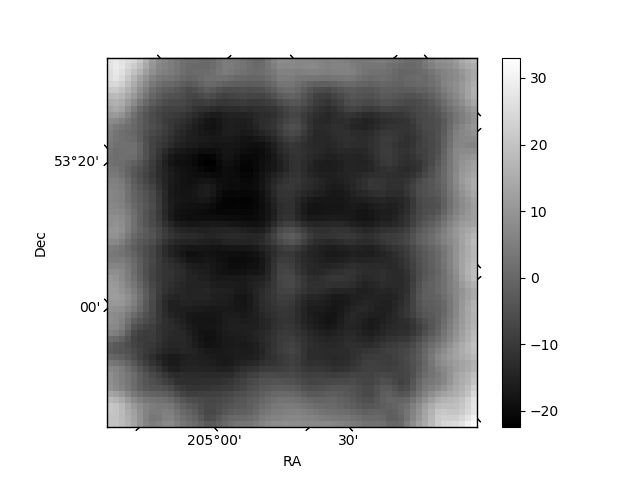
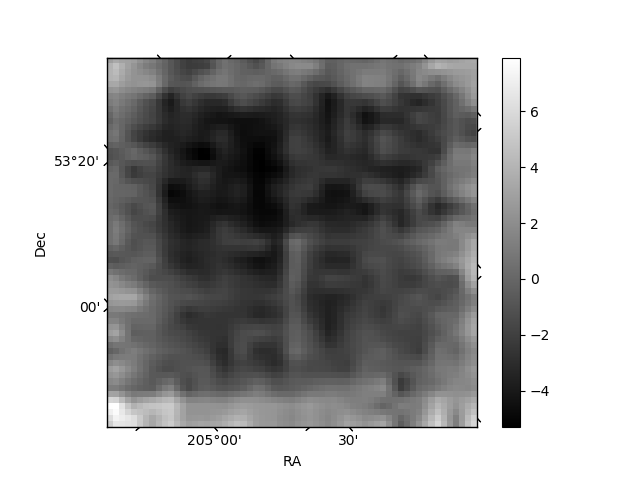
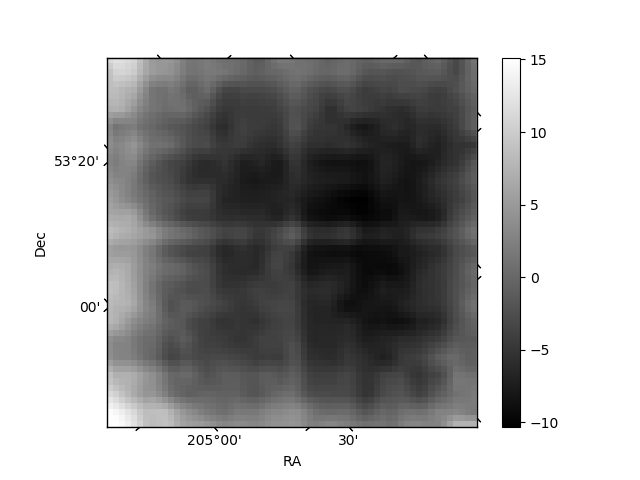
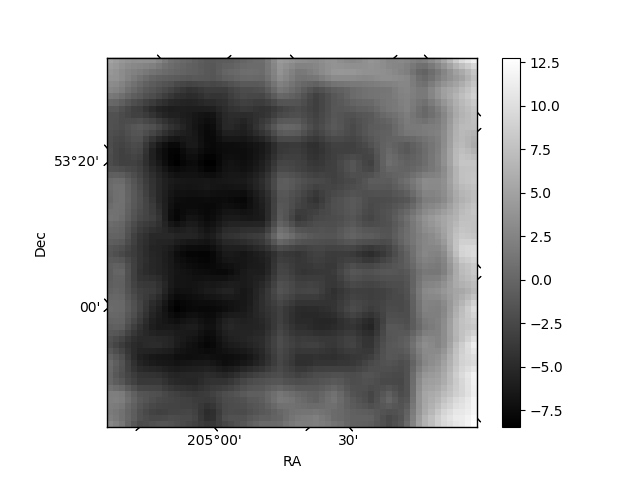
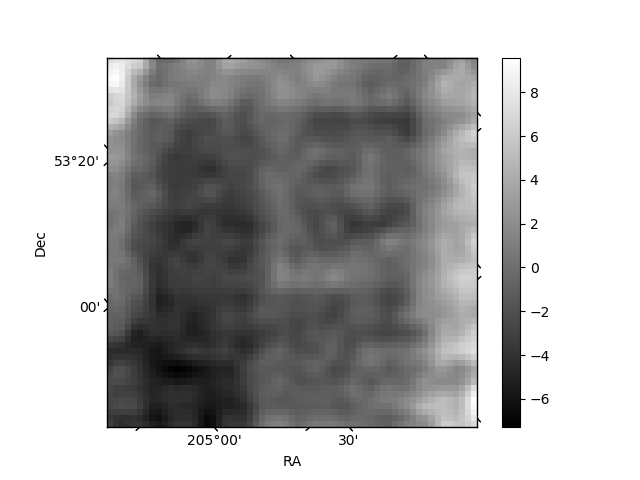
Histogram calculated using DETX and DETY for each event in the final _common_clean file
| Quadrant A | 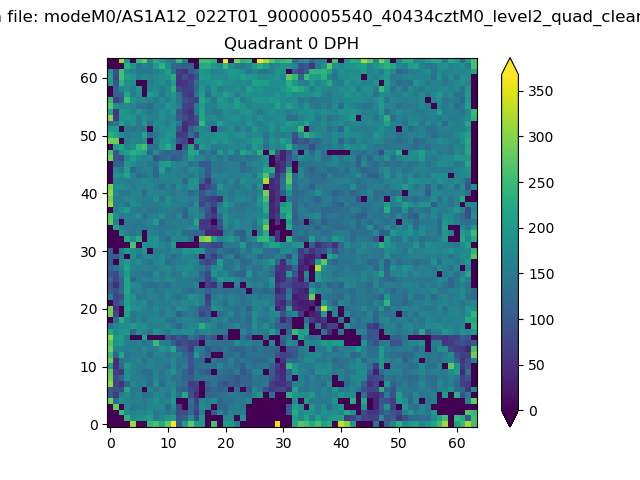 |
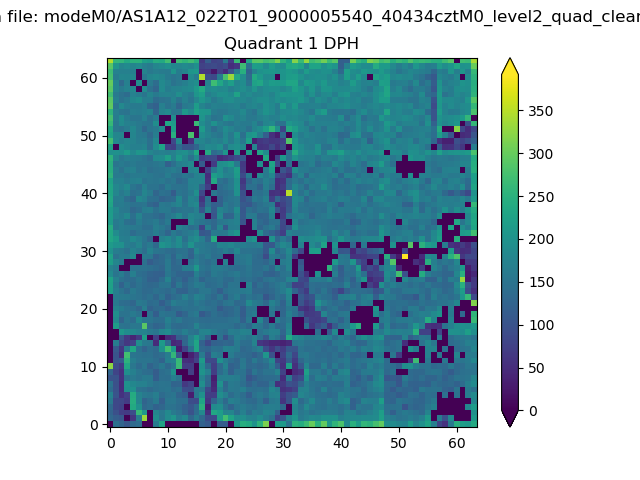 |
Quadrant B |
|---|---|---|---|
| Quadrant D | 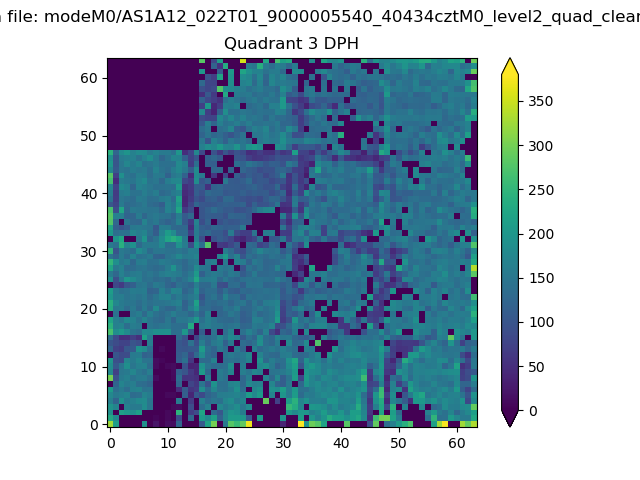 |
 |
Quadrant C |
| Plot type | Count rate plots | Images |
|---|---|---|
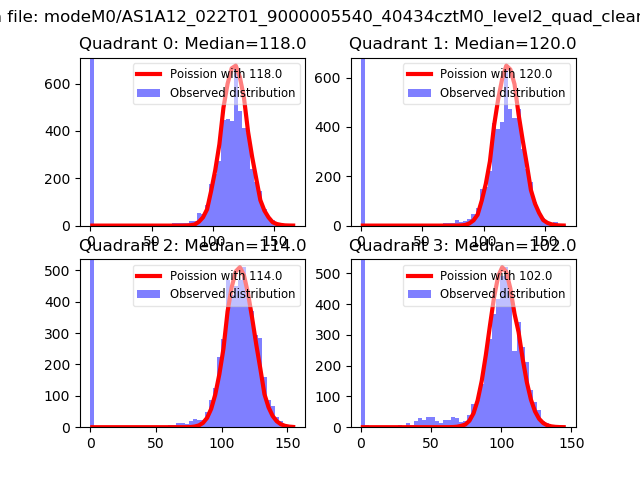
| Comparison with Poisson distribution Blue bars denote a histogram of data divided into 1 sec bins. Red curve is a Poisson curve with rate = median count rate of data. |
 |
 |
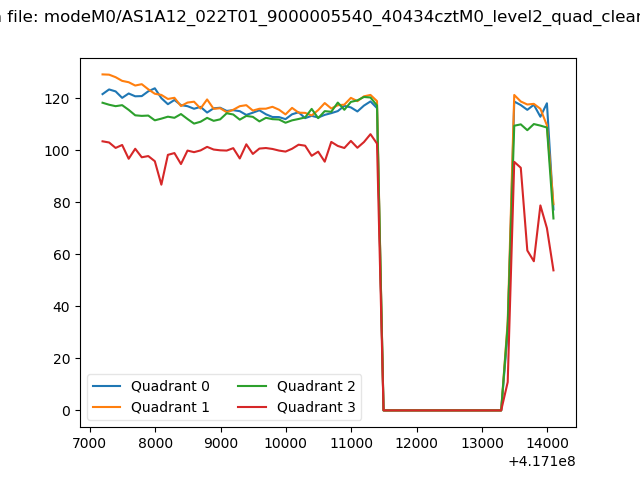
| Quadrant-wise count rates Data is divided into 100 sec bins |
 |
|
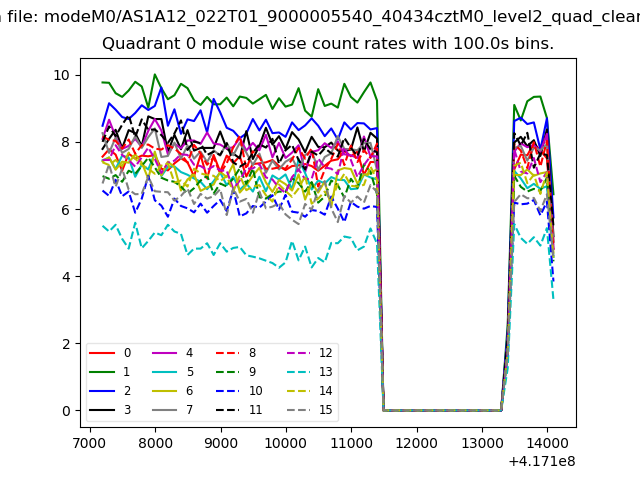
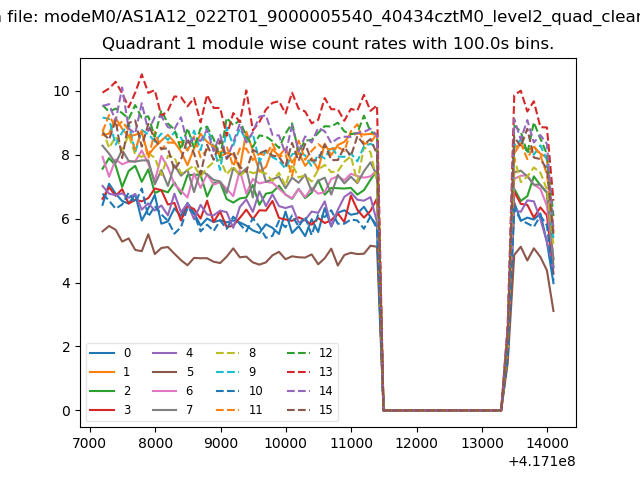
| Module-wise count rates for Quadrant A Data is divided into 100 sec bins |
 |
 |
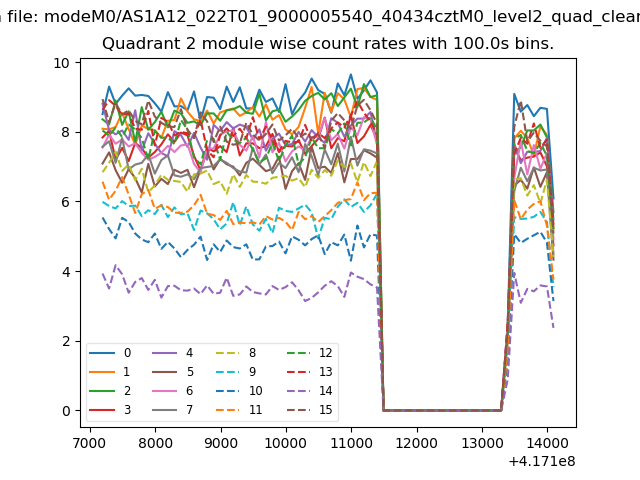
| Module-wise count rates for Quadrant B Data is divided into 100 sec bins |
 |
 |
| Module-wise count rates for Quadrant C Data is divided into 100 sec bins |
 |
 |
| Module-wise count rates for Quadrant D Data is divided into 100 sec bins |
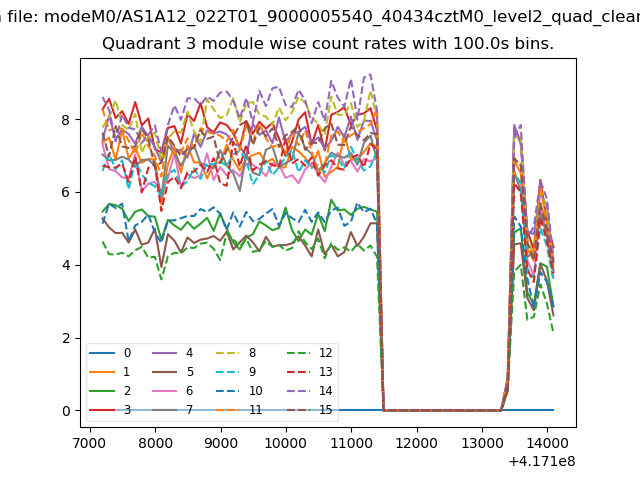 |
 |
| Parameter | Plot |
|---|---|
| CZT HV Monitor | 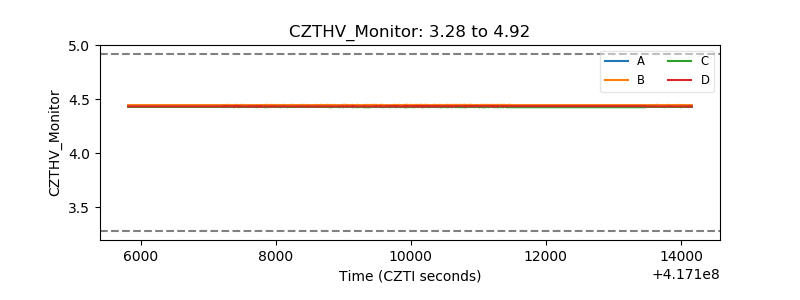 |
| D_VDD | 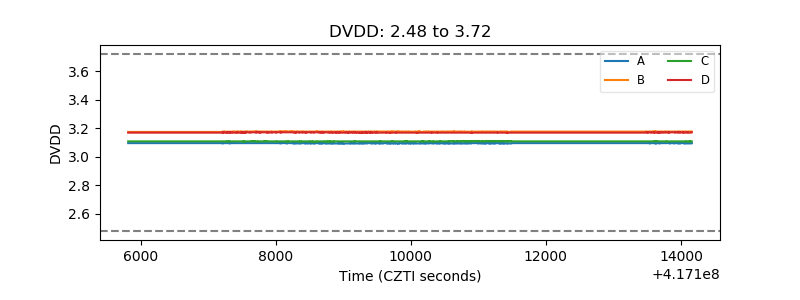 |
| Temperature 1 | 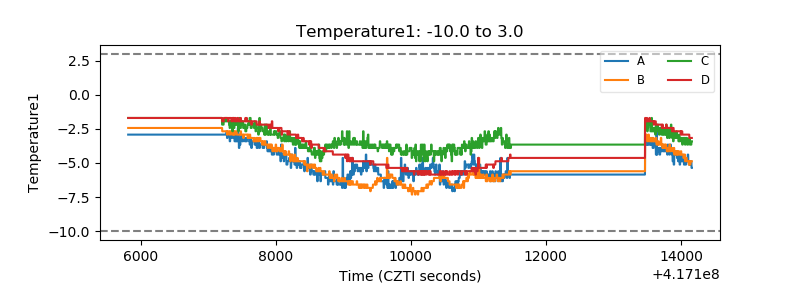 |
| Veto HV Monitor | 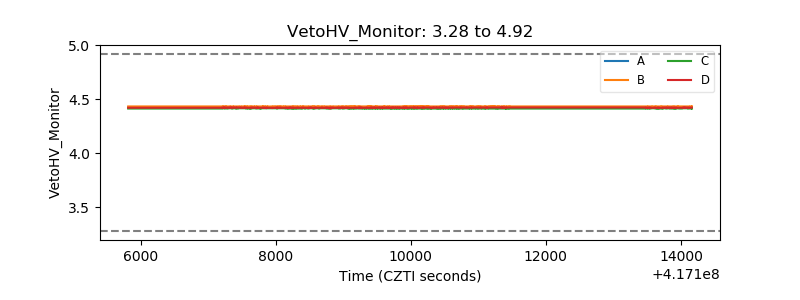 |
| Veto LLD | 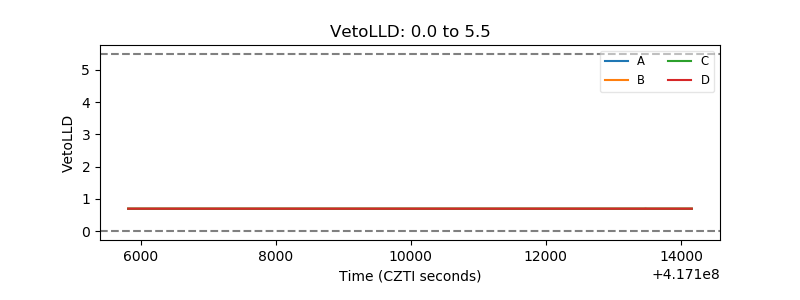 |
| Alpha Counter | 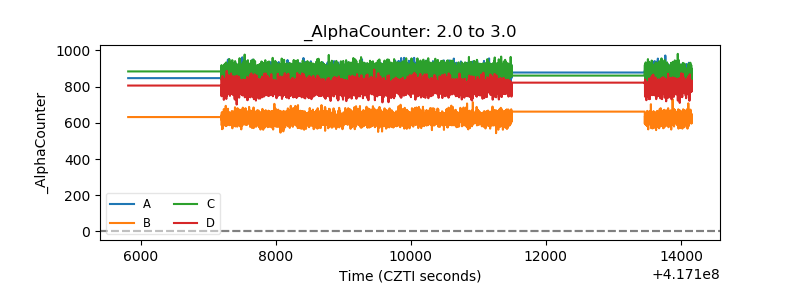 |
| _CPM_Rate | 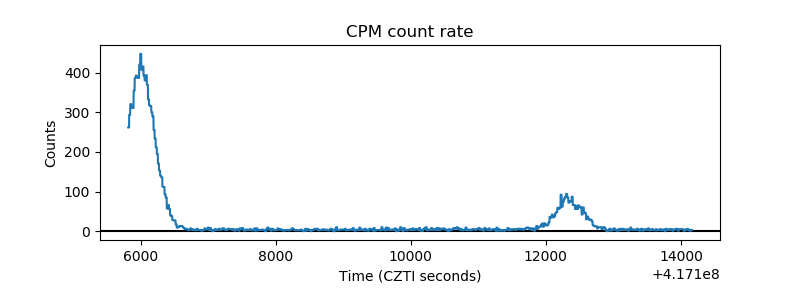 |
| CZT Counter | 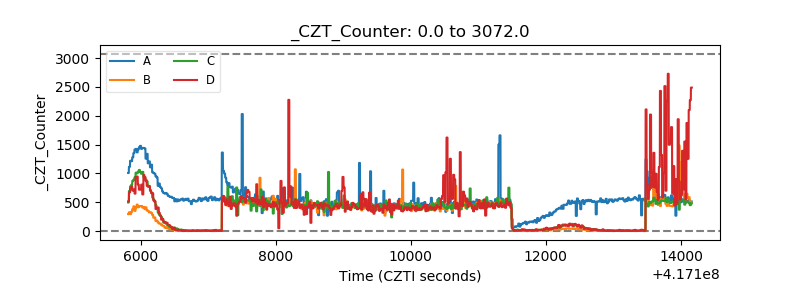 |
| +2.5 Volts monitor | 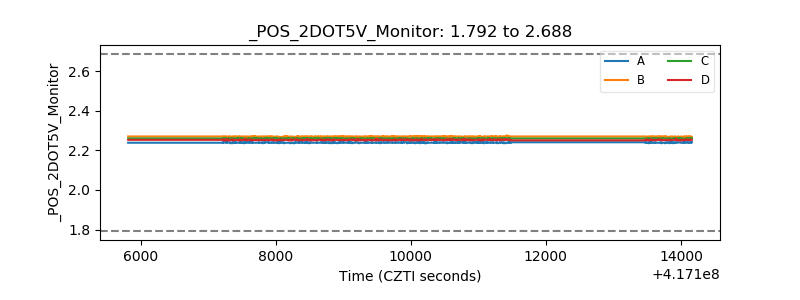 |
| +5 Volts monitor | 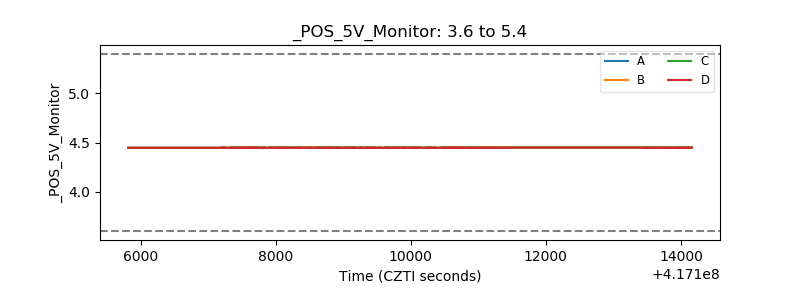 |
| _ROLL_ROT | 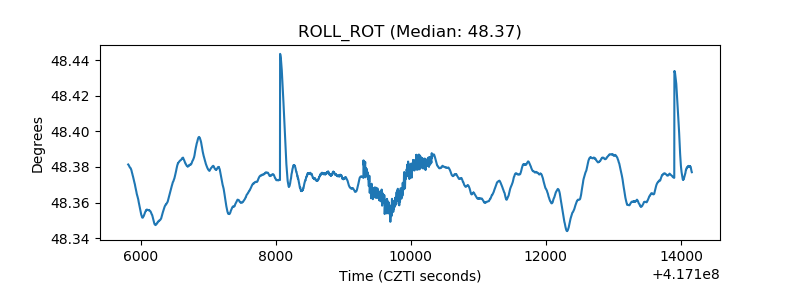 |
| _Roll_DEC | 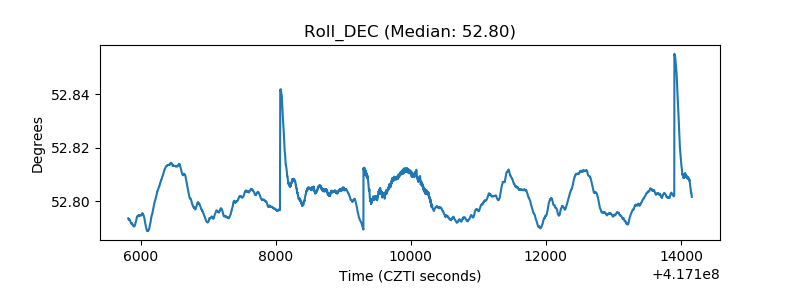 |
| _Roll_RA |  |
| Veto Counter | 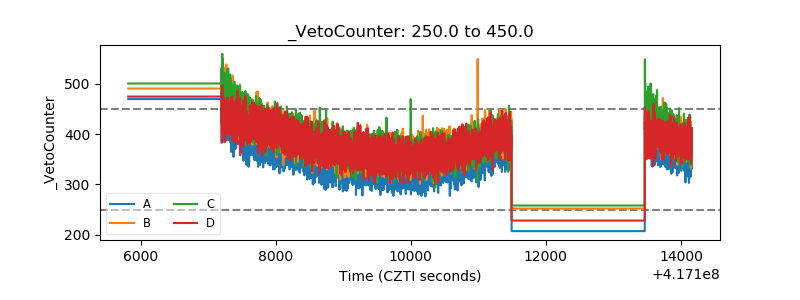 |