| Param | Original file | Final file |
|---|---|---|
| Filename | modeM0/AS1A12_022T01_9000005540_40435cztM0_level2.fits | modeM0/AS1A12_022T01_9000005540_40435cztM0_level2_quad_clean.evt |
| Size (bytes) | 335,715,840 | 91,241,280 |
| Size | 320.2 MB | 87.0 MB |
| Events in quadrant A | 2,930,697 | 620,746 |
| Events in quadrant B | 2,832,181 | 630,933 |
| Events in quadrant C | 2,563,403 | 609,679 |
| Events in quadrant D | 3,668,719 | 514,361 |
| Mode M0 | |||
|---|---|---|---|
| Quadrant | BADHDUFLAG | Total packets | Discarded packets |
| A | 0 | 12230 | 3 |
| B | 0 | 12278 | 2 |
| C | 0 | 11247 | 2 |
| D | 0 | 14821 | 2 |
| Mode M9 | |||
|---|---|---|---|
| Quadrant | BADHDUFLAG | Total packets | Discarded packets |
| A | 0 | 37 | 0 |
| B | 0 | 37 | 0 |
| C | 0 | 37 | 0 |
| D | 0 | 37 | 0 |
| Mode SS | |||
|---|---|---|---|
| Quadrant | BADHDUFLAG | Total packets | Discarded packets |
| A | 0 | 112 | 0 |
| B | 0 | 112 | 0 |
| C | 0 | 112 | 0 |
| D | 0 | 112 | 0 |
| Quadrant | Total seconds | Saturated seconds | Saturation percentage |
|---|---|---|---|
| A | 5541 | 15 | 0.270709% |
| B | 5541 | 57 | 1.028695% |
| C | 5541 | 10 | 0.180473% |
| D | 5541 | 602 | 10.864465% |
Noise dominated data is calculated using 1-second bins in cleaned event files. If a bin has >2000 counts, and if more than 50% of those come from <1% of pixels, then it is considered to be noise-dominated and hence unusable.
| Quadrant | # 1 sec bins | Bins with >0 counts | Bins with >2000 counts | High rate bins dominated by noise | Noise dominated (total time) | Noise dominated (detector-on time) | Marked lightcurve |
|---|---|---|---|---|---|---|---|
| A | 9187 | 5543 | 8 | 8 | 0.09% | 0.14% | 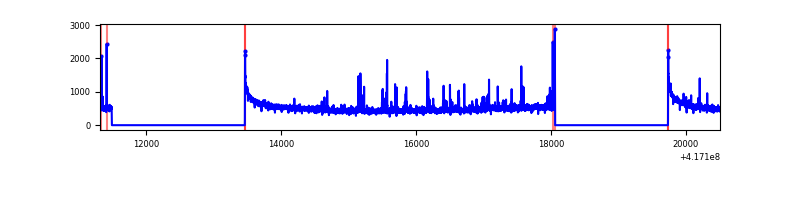 |
| B | 9187 | 5543 | 36 | 36 | 0.39% | 0.65% | 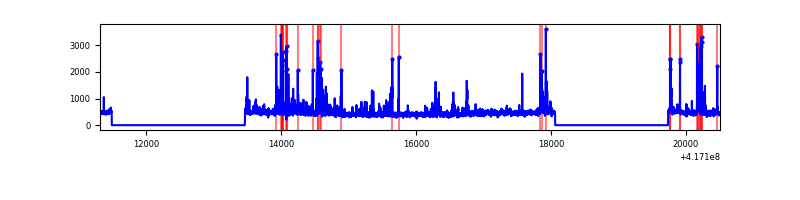 |
| C | 9187 | 5543 | 3 | 3 | 0.03% | 0.05% | 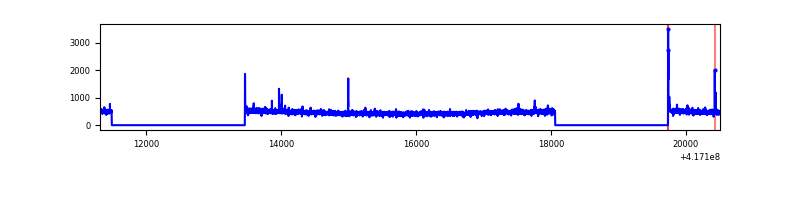 |
| D | 9187 | 5543 | 185 | 185 | 2.01% | 3.34% | 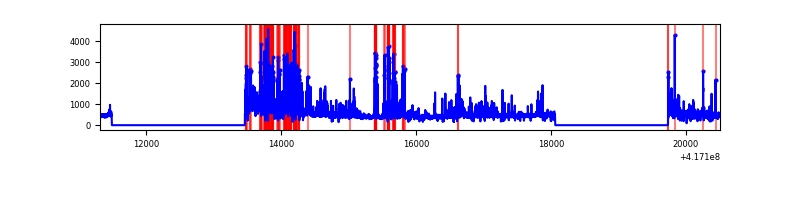 |
Top three noisy pixels from each quadrant. If the there are fewer than three noisy pixels in the level2.evt file, extra rows are filled as -1
| Pixel properties | Quadrant properties | ||||||
|---|---|---|---|---|---|---|---|
| Quadrant | DetID | PixID | Counts | Sigma | Mean | Median | Sigma |
| A | 10 | 83 | 495244 | 4023.85 | 595 | 582 | 122.9 |
| A | 2 | 79 | 105588 | 854.18 | 595 | 582 | 122.9 |
| A | 7 | 3 | 25503 | 202.72 | 595 | 582 | 122.9 |
| B | 4 | 170 | 380034 | 3334.01 | 591 | 576 | 113.8 |
| B | 5 | 255 | 76133 | 663.86 | 591 | 576 | 113.8 |
| B | 3 | 112 | 30901 | 266.44 | 591 | 576 | 113.8 |
| C | 15 | 214 | 239981 | 1745.27 | 585 | 587 | 137.2 |
| C | 0 | 10 | 20320 | 143.86 | 585 | 587 | 137.2 |
| C | 14 | 254 | 16021 | 112.52 | 585 | 587 | 137.2 |
| D | 12 | 227 | 1111636 | 8261.36 | 551 | 537 | 134.5 |
| D | 12 | 191 | 142788 | 1057.68 | 551 | 537 | 134.5 |
| D | 2 | 250 | 138386 | 1024.95 | 551 | 537 | 134.5 |
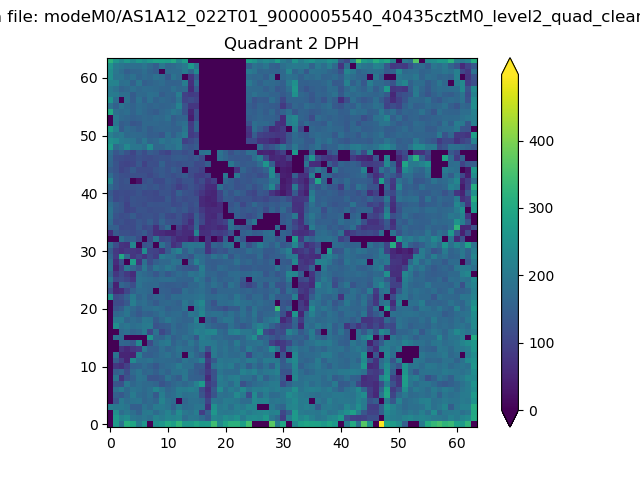
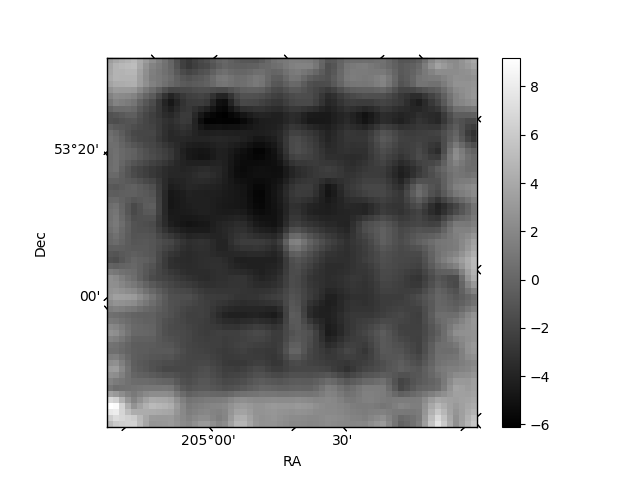
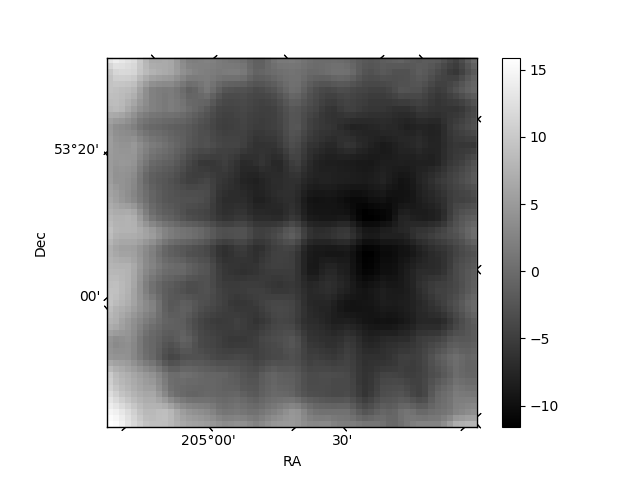
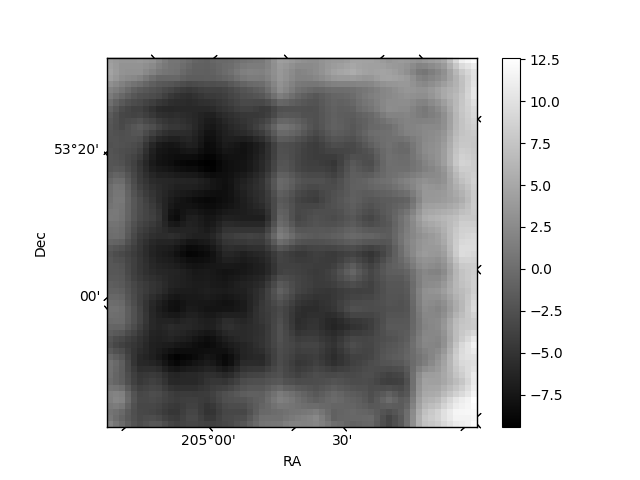
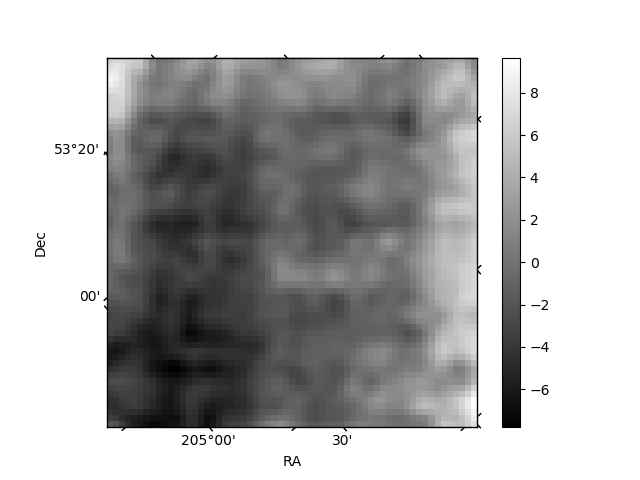
Histogram calculated using DETX and DETY for each event in the final _common_clean file
| Quadrant A | 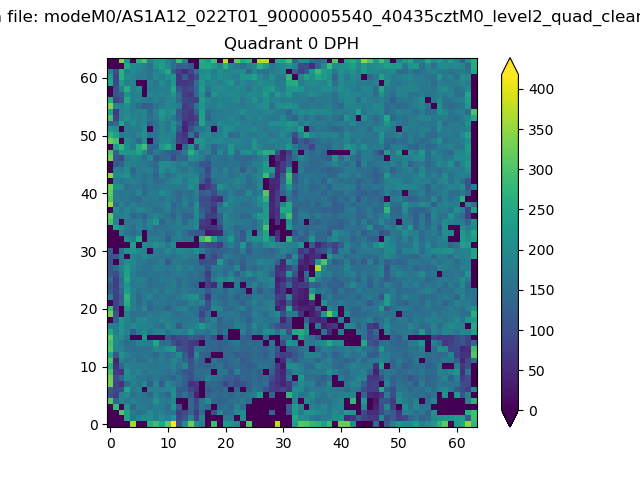 |
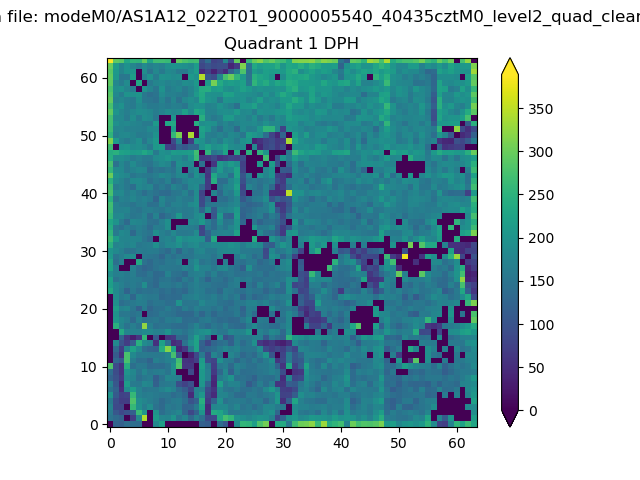 |
Quadrant B |
|---|---|---|---|
| Quadrant D | 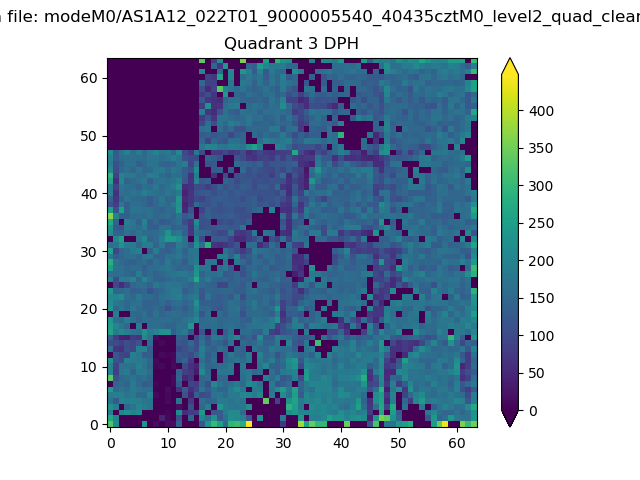 |
 |
Quadrant C |
| Plot type | Count rate plots | Images |
|---|---|---|
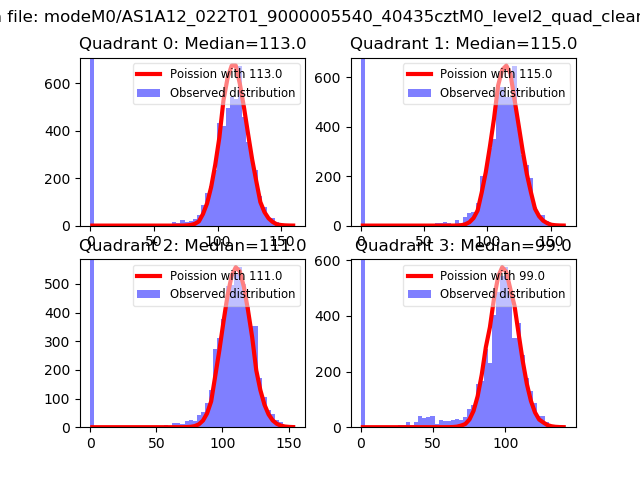
| Comparison with Poisson distribution Blue bars denote a histogram of data divided into 1 sec bins. Red curve is a Poisson curve with rate = median count rate of data. |
 |
 |
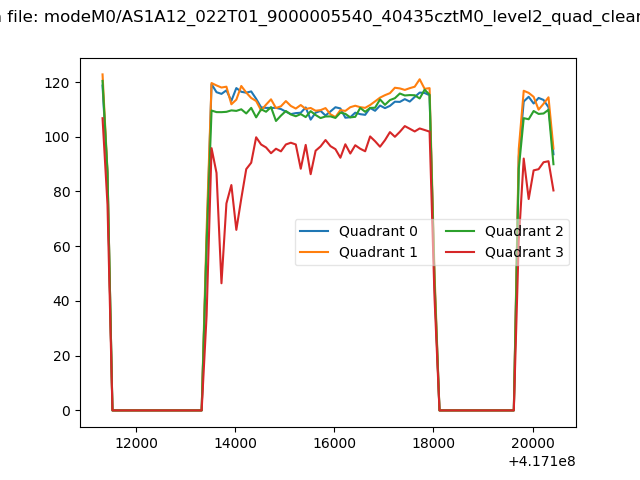
| Quadrant-wise count rates Data is divided into 100 sec bins |
 |
|
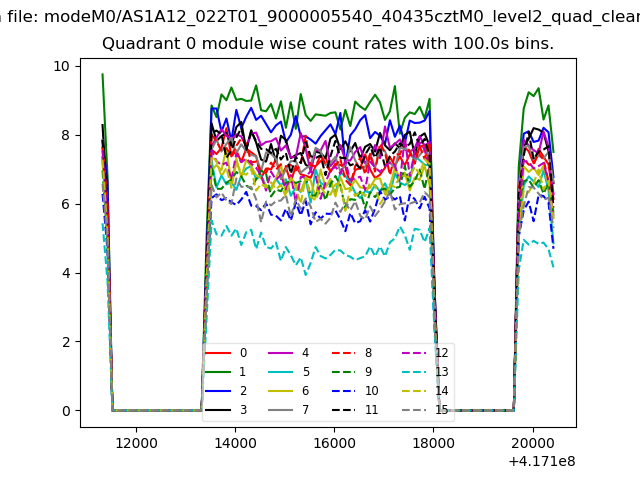
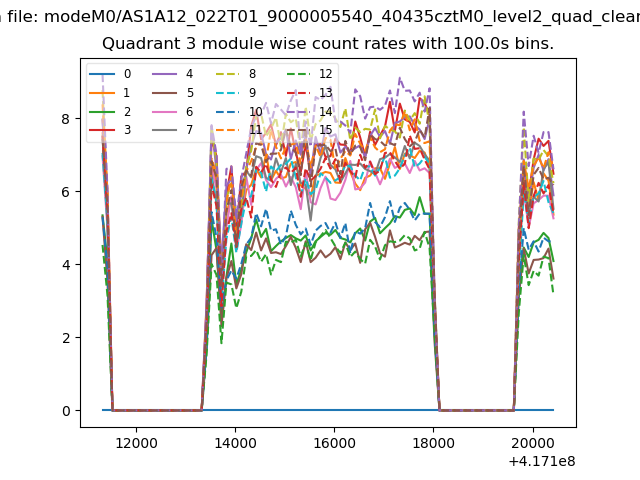
| Module-wise count rates for Quadrant A Data is divided into 100 sec bins |
 |
 |
| Module-wise count rates for Quadrant B Data is divided into 100 sec bins |
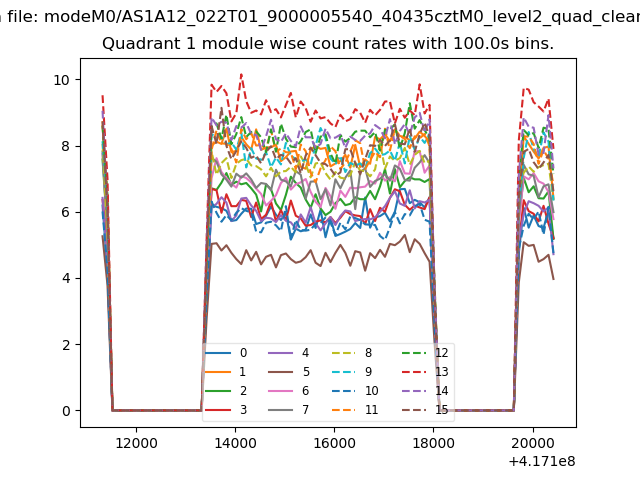 |
 |
| Module-wise count rates for Quadrant C Data is divided into 100 sec bins |
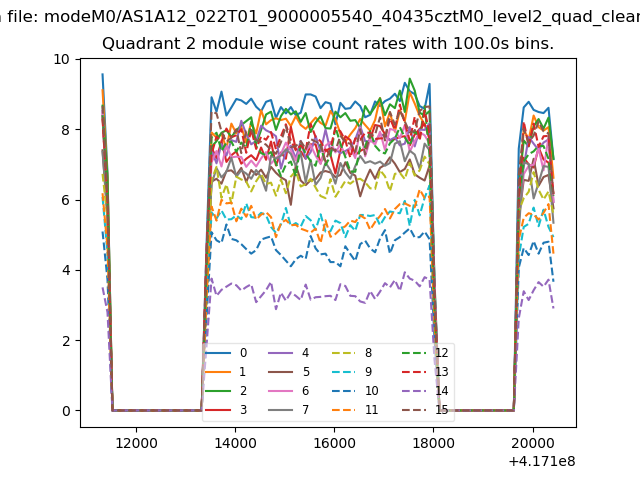 |
 |
| Module-wise count rates for Quadrant D Data is divided into 100 sec bins |
 |
 |
| Parameter | Plot |
|---|---|
| CZT HV Monitor | 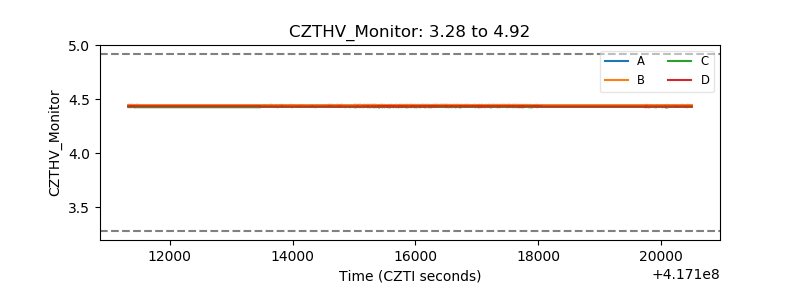 |
| D_VDD | 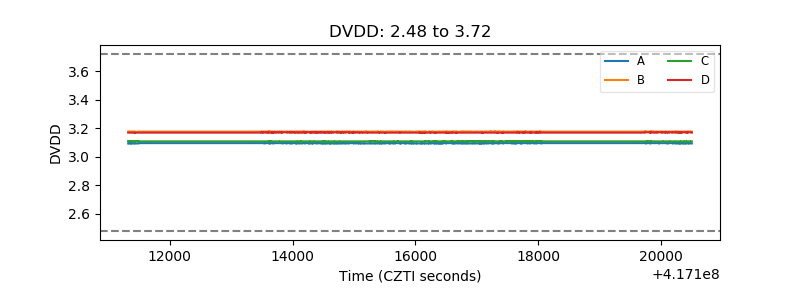 |
| Temperature 1 | 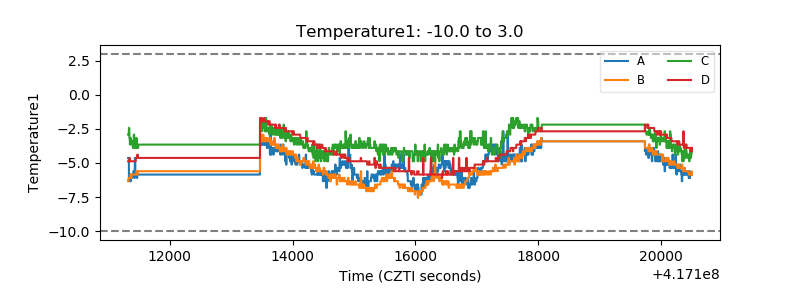 |
| Veto HV Monitor | 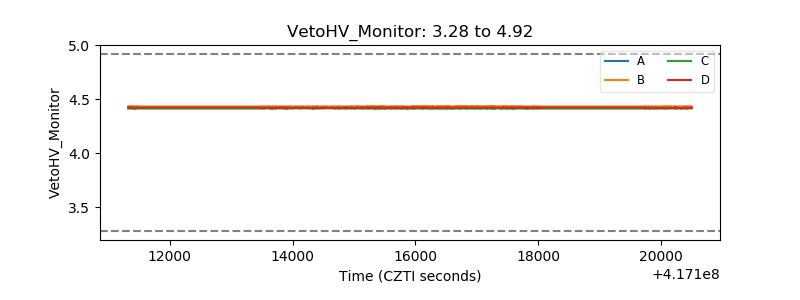 |
| Veto LLD | 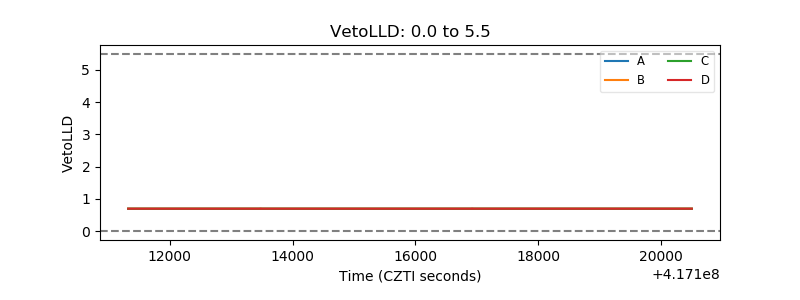 |
| Alpha Counter |  |
| _CPM_Rate | 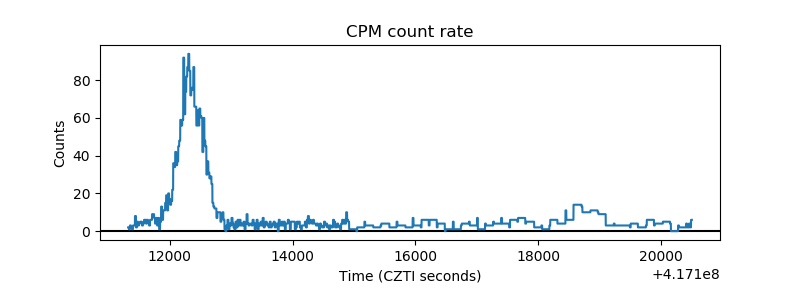 |
| CZT Counter | 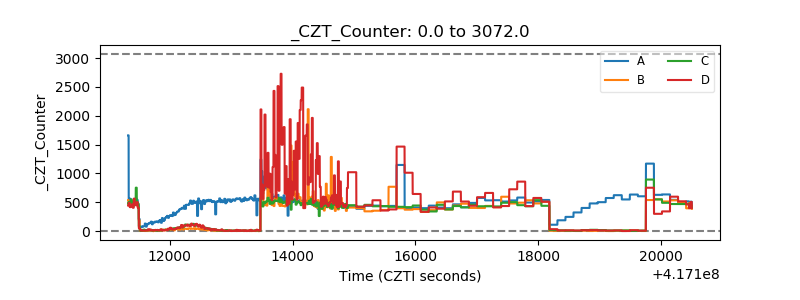 |
| +2.5 Volts monitor | 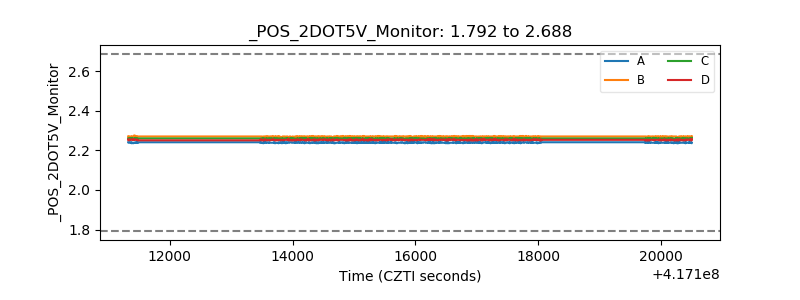 |
| +5 Volts monitor | 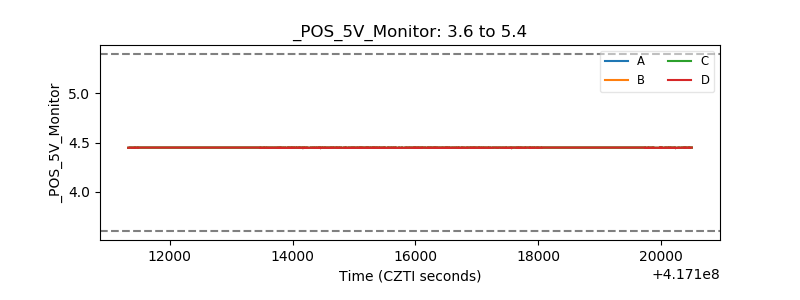 |
| _ROLL_ROT | 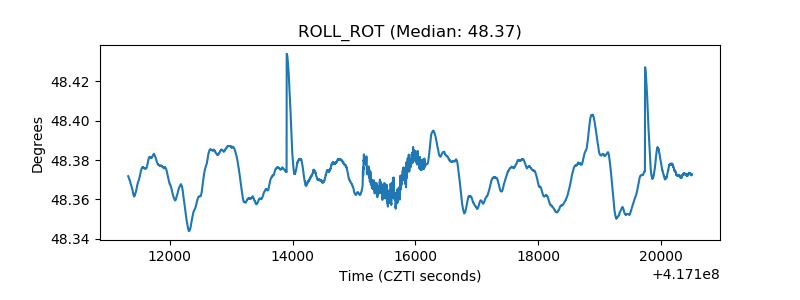 |
| _Roll_DEC | 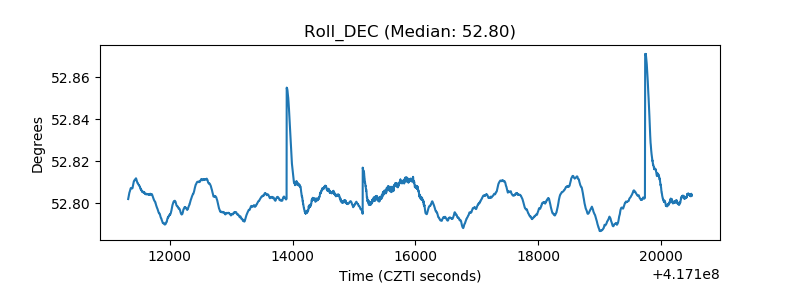 |
| _Roll_RA |  |
| Veto Counter | 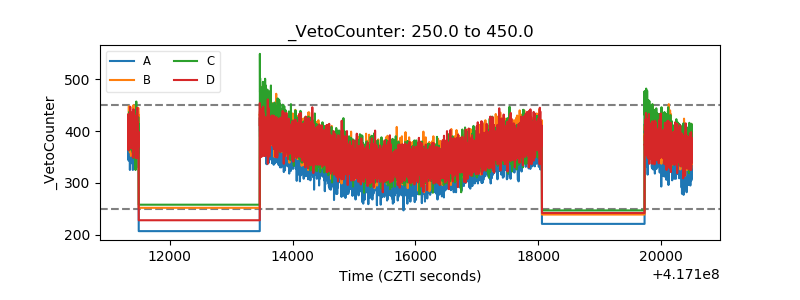 |