| Param | Original file | Final file |
|---|---|---|
| Filename | modeM0/AS1A12_022T01_9000005540_40436cztM0_level2.fits | modeM0/AS1A12_022T01_9000005540_40436cztM0_level2_quad_clean.evt |
| Size (bytes) | 349,577,280 | 96,004,800 |
| Size | 333.4 MB | 91.6 MB |
| Events in quadrant A | 3,052,849 | 648,164 |
| Events in quadrant B | 2,776,922 | 664,076 |
| Events in quadrant C | 2,785,902 | 640,734 |
| Events in quadrant D | 3,863,406 | 540,798 |
| Mode M0 | |||
|---|---|---|---|
| Quadrant | BADHDUFLAG | Total packets | Discarded packets |
| A | 0 | 12944 | 3 |
| B | 0 | 12470 | 2 |
| C | 0 | 12163 | 2 |
| D | 0 | 15733 | 2 |
| Mode M9 | |||
|---|---|---|---|
| Quadrant | BADHDUFLAG | Total packets | Discarded packets |
| A | 0 | 31 | 0 |
| B | 0 | 31 | 0 |
| C | 0 | 31 | 0 |
| D | 0 | 31 | 0 |
| Mode SS | |||
|---|---|---|---|
| Quadrant | BADHDUFLAG | Total packets | Discarded packets |
| A | 0 | 122 | 0 |
| B | 0 | 122 | 0 |
| C | 0 | 122 | 0 |
| D | 0 | 122 | 0 |
| Quadrant | Total seconds | Saturated seconds | Saturation percentage |
|---|---|---|---|
| A | 5914 | 22 | 0.371999% |
| B | 5914 | 30 | 0.507271% |
| C | 5914 | 29 | 0.490362% |
| D | 5914 | 646 | 10.923233% |
Noise dominated data is calculated using 1-second bins in cleaned event files. If a bin has >2000 counts, and if more than 50% of those come from <1% of pixels, then it is considered to be noise-dominated and hence unusable.
| Quadrant | # 1 sec bins | Bins with >0 counts | Bins with >2000 counts | High rate bins dominated by noise | Noise dominated (total time) | Noise dominated (detector-on time) | Marked lightcurve |
|---|---|---|---|---|---|---|---|
| A | 8990 | 5916 | 7 | 7 | 0.08% | 0.12% | 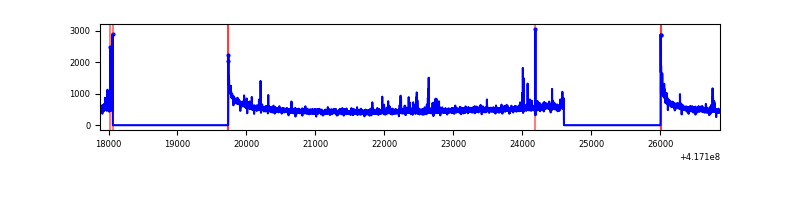 |
| B | 8990 | 5916 | 17 | 17 | 0.19% | 0.29% | 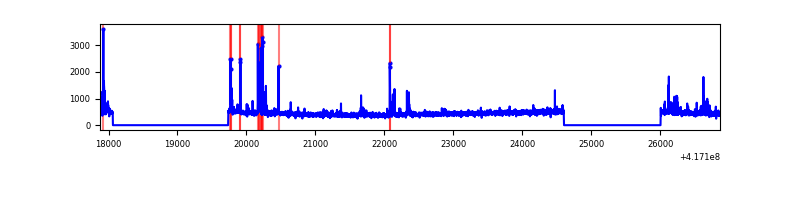 |
| C | 8990 | 5916 | 15 | 15 | 0.17% | 0.25% | 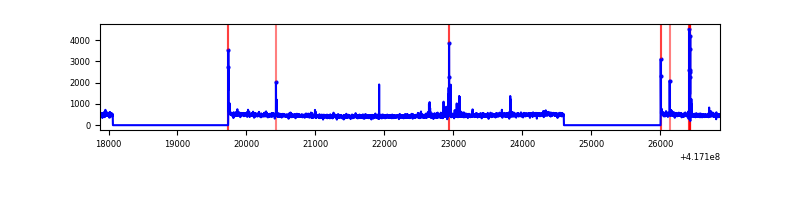 |
| D | 8990 | 5916 | 180 | 180 | 2.00% | 3.04% | 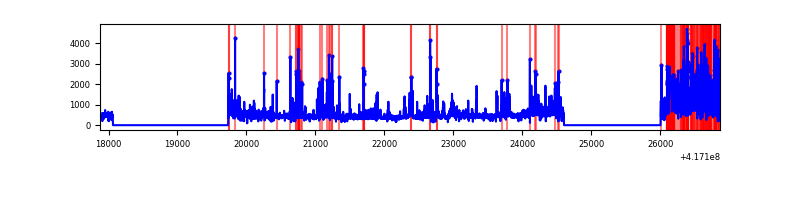 |
Top three noisy pixels from each quadrant. If the there are fewer than three noisy pixels in the level2.evt file, extra rows are filled as -1
| Pixel properties | Quadrant properties | ||||||
|---|---|---|---|---|---|---|---|
| Quadrant | DetID | PixID | Counts | Sigma | Mean | Median | Sigma |
| A | 10 | 83 | 502149 | 3895.46 | 631 | 619 | 128.7 |
| A | 2 | 79 | 52509 | 403.04 | 631 | 619 | 128.7 |
| A | 7 | 3 | 26484 | 200.9 | 631 | 619 | 128.7 |
| B | 4 | 170 | 156168 | 1270.57 | 627 | 609 | 122.4 |
| B | 5 | 255 | 100985 | 819.85 | 627 | 609 | 122.4 |
| B | 3 | 112 | 35608 | 285.86 | 627 | 609 | 122.4 |
| C | 15 | 214 | 253112 | 1747.28 | 619 | 622 | 144.5 |
| C | 14 | 254 | 91352 | 627.87 | 619 | 622 | 144.5 |
| C | 0 | 10 | 24658 | 166.33 | 619 | 622 | 144.5 |
| D | 2 | 250 | 486560 | 3380.69 | 587 | 571 | 143.8 |
| D | 12 | 227 | 459209 | 3190.43 | 587 | 571 | 143.8 |
| D | 12 | 128 | 397266 | 2759.53 | 587 | 571 | 143.8 |
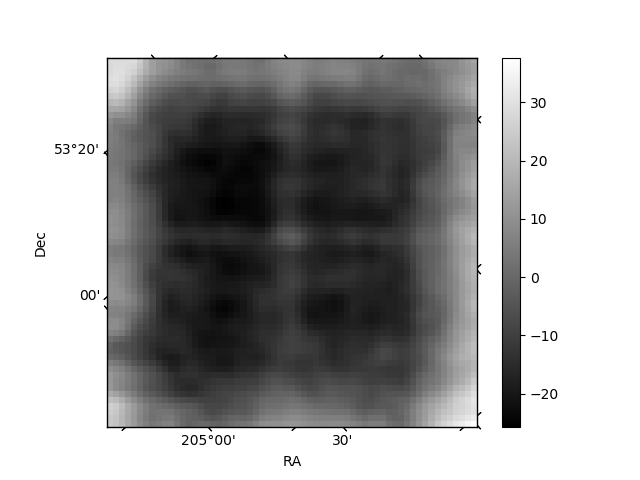
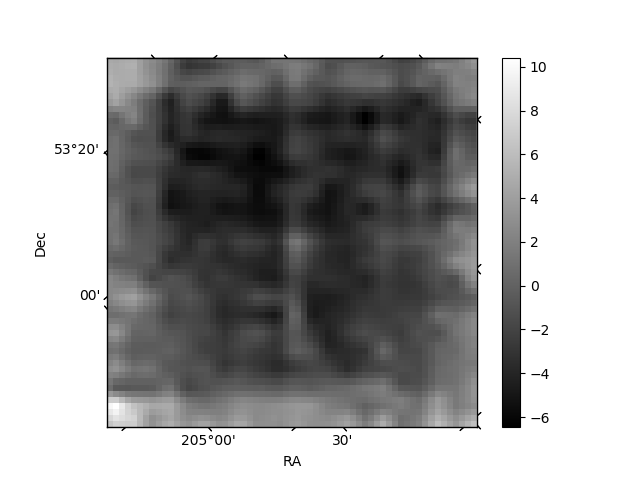
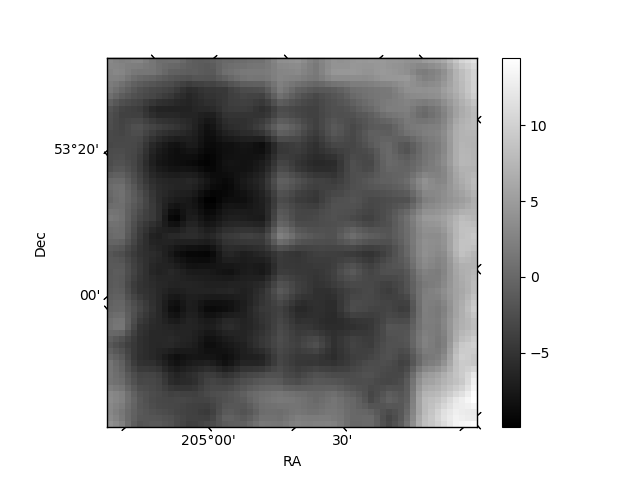
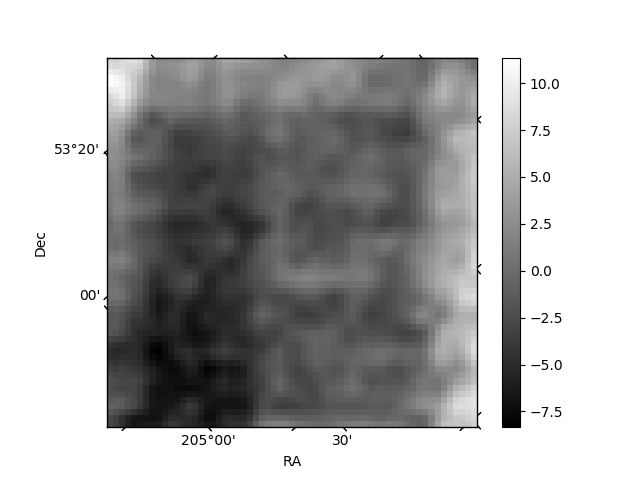
Histogram calculated using DETX and DETY for each event in the final _common_clean file
| Quadrant A | 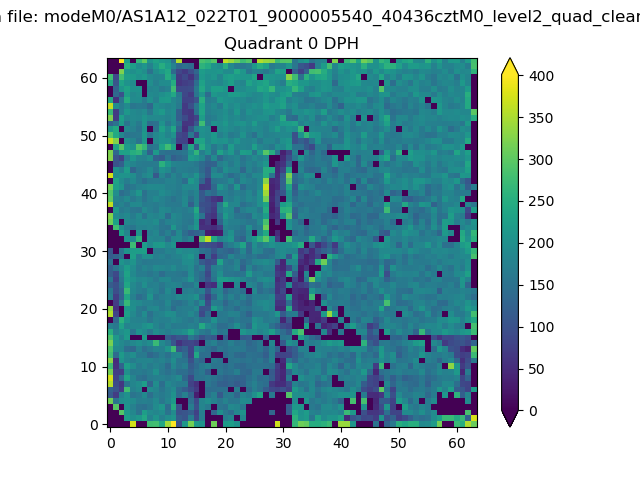 |
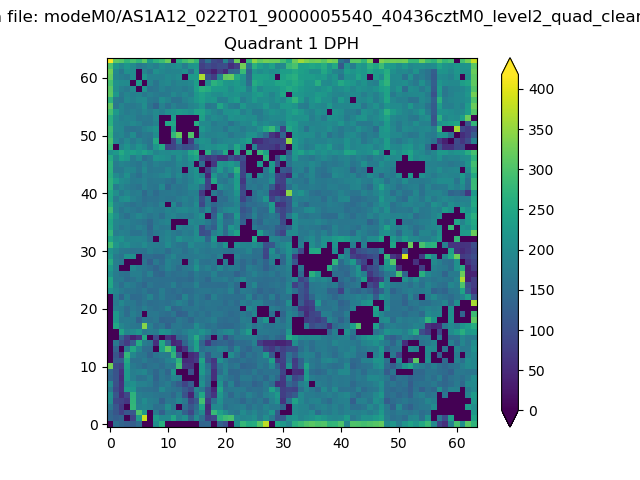 |
Quadrant B |
|---|---|---|---|
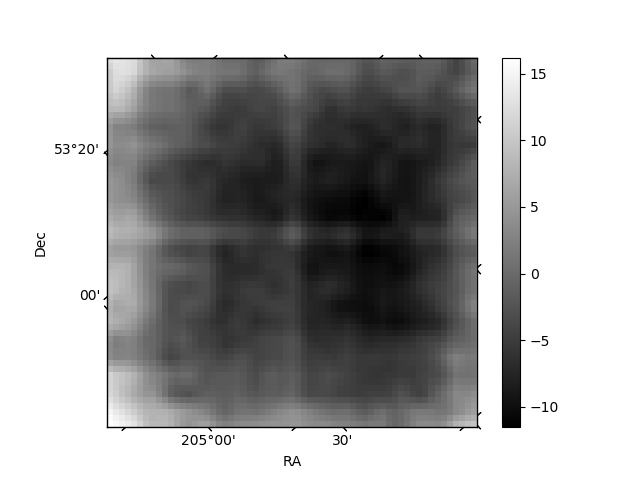
| Quadrant D | 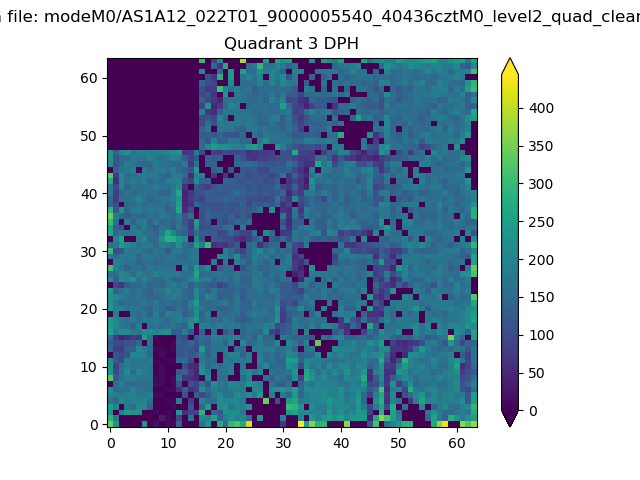 |
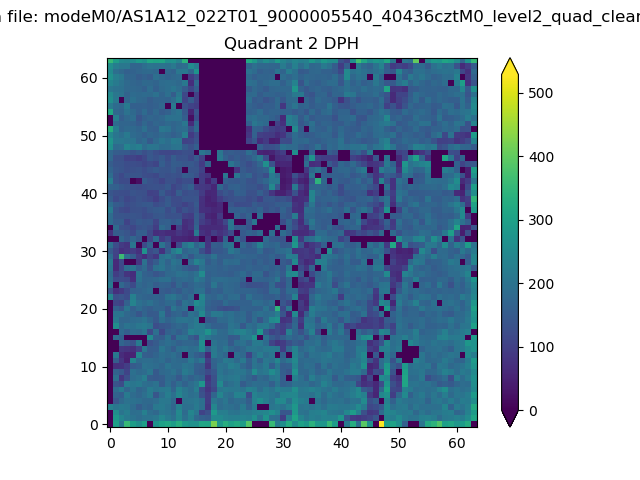 |
Quadrant C |
| Plot type | Count rate plots | Images |
|---|---|---|
| Comparison with Poisson distribution Blue bars denote a histogram of data divided into 1 sec bins. Red curve is a Poisson curve with rate = median count rate of data. |
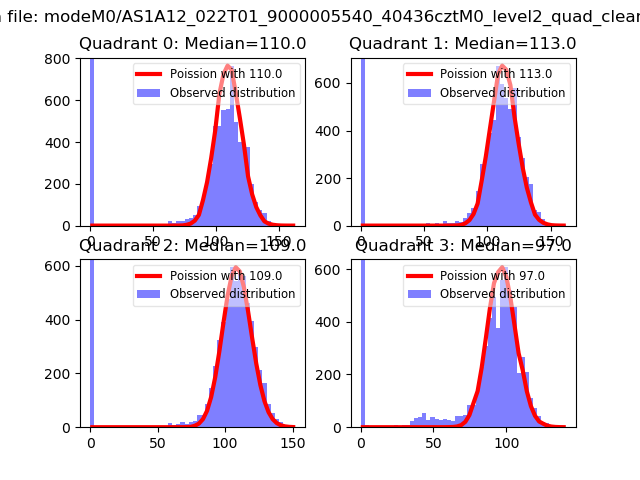 |
 |
| Quadrant-wise count rates Data is divided into 100 sec bins |
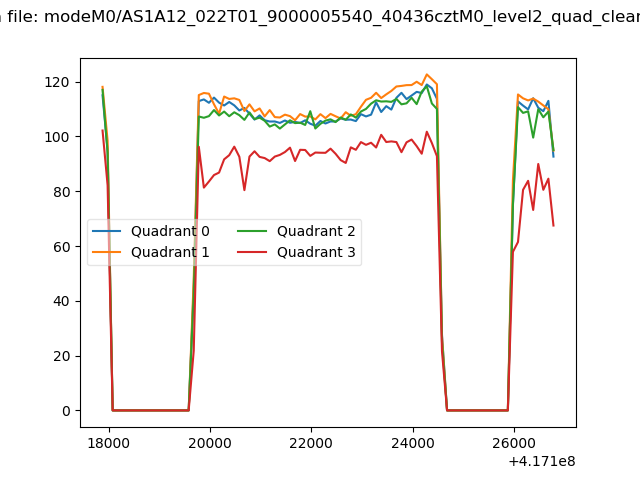 |
|
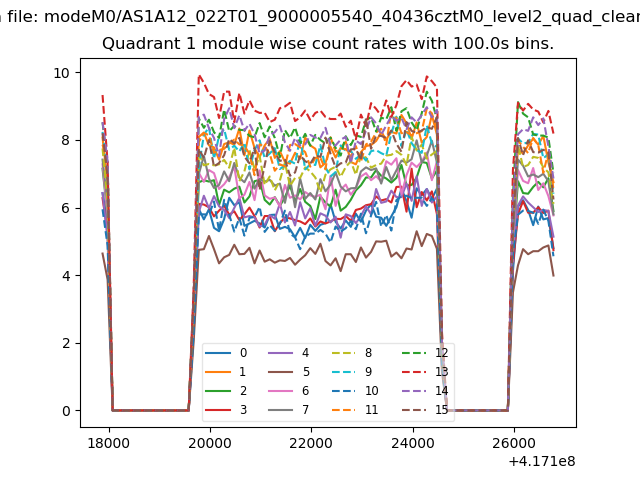
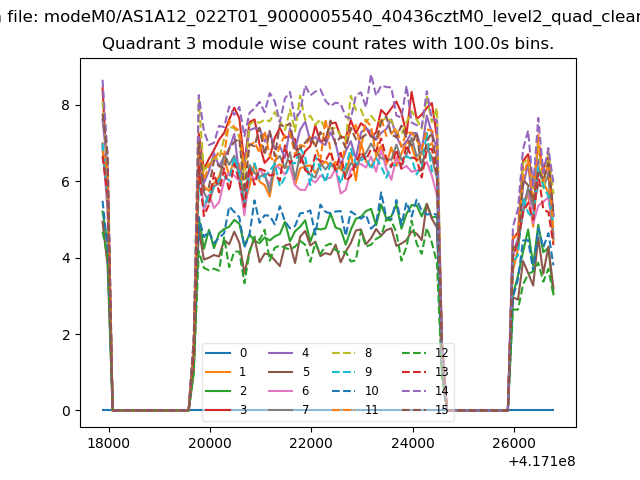
| Module-wise count rates for Quadrant A Data is divided into 100 sec bins |
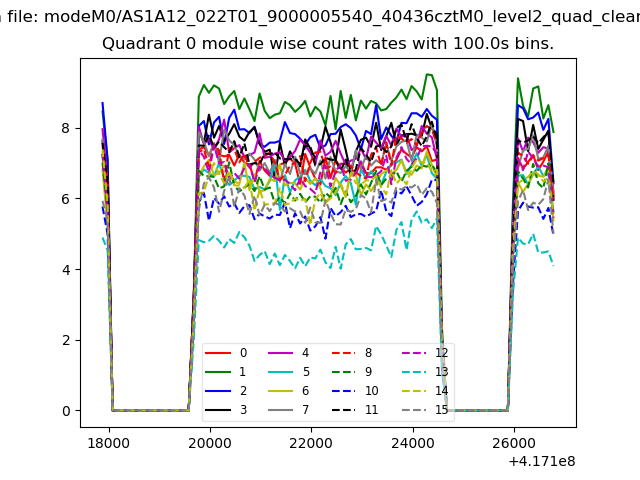 |
 |
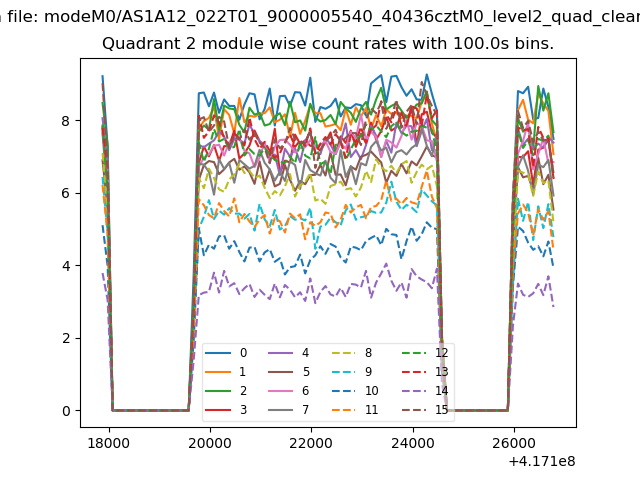
| Module-wise count rates for Quadrant B Data is divided into 100 sec bins |
 |
 |
| Module-wise count rates for Quadrant C Data is divided into 100 sec bins |
 |
 |
| Module-wise count rates for Quadrant D Data is divided into 100 sec bins |
 |
 |
| Parameter | Plot |
|---|---|
| CZT HV Monitor | 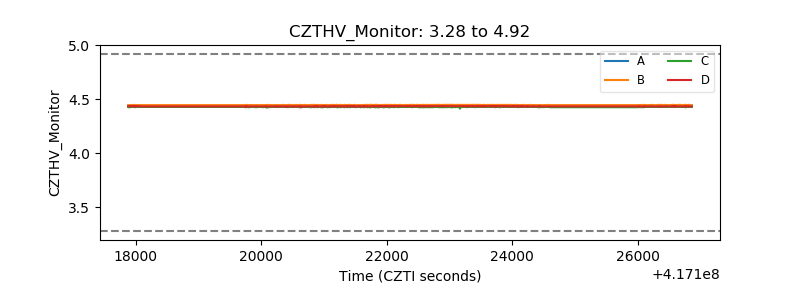 |
| D_VDD | 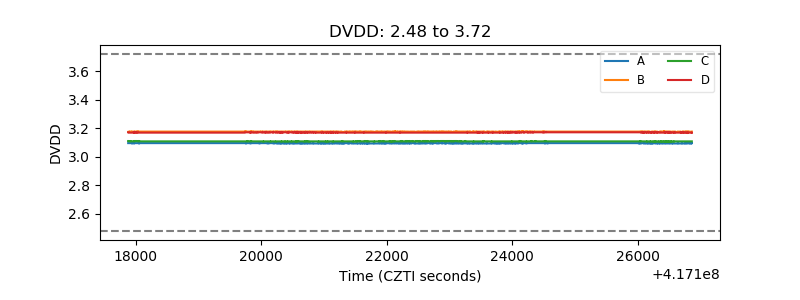 |
| Temperature 1 | 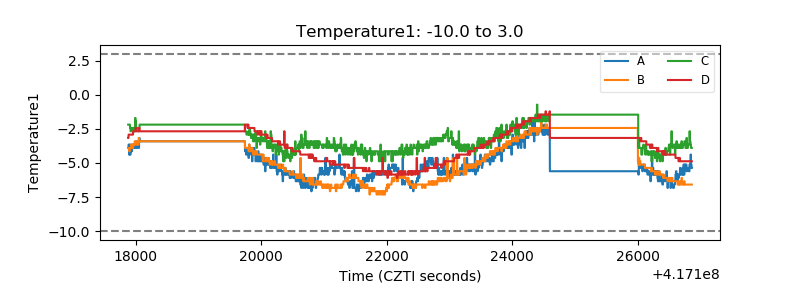 |
| Veto HV Monitor | 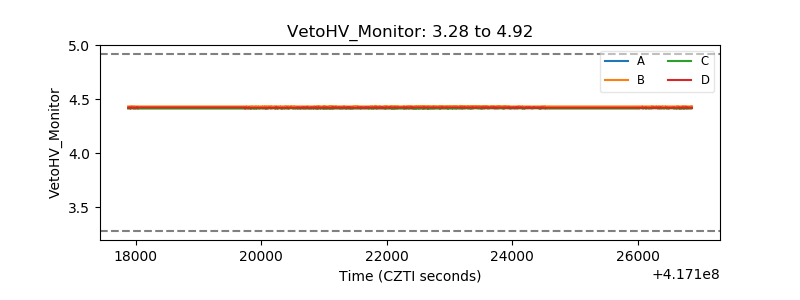 |
| Veto LLD | 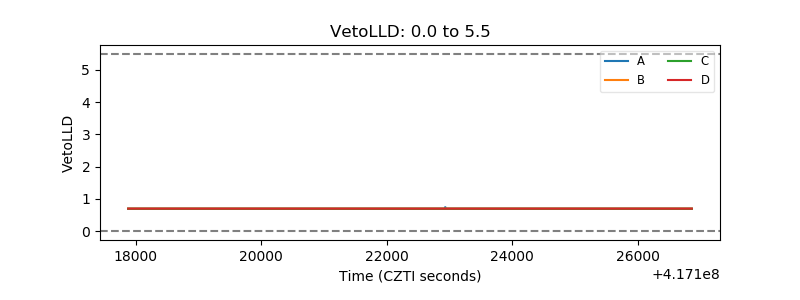 |
| Alpha Counter | 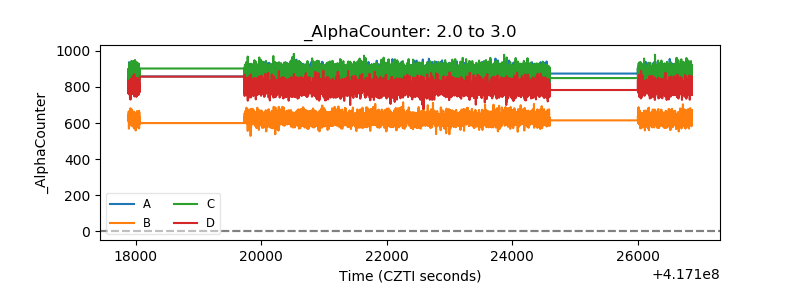 |
| _CPM_Rate | 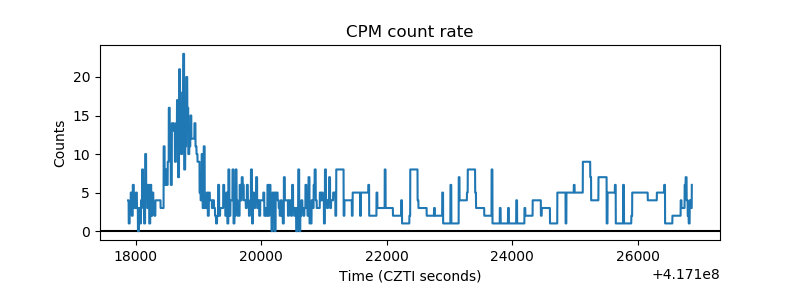 |
| CZT Counter | 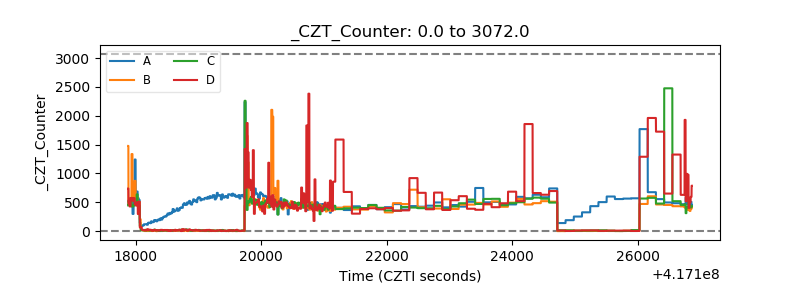 |
| +2.5 Volts monitor | 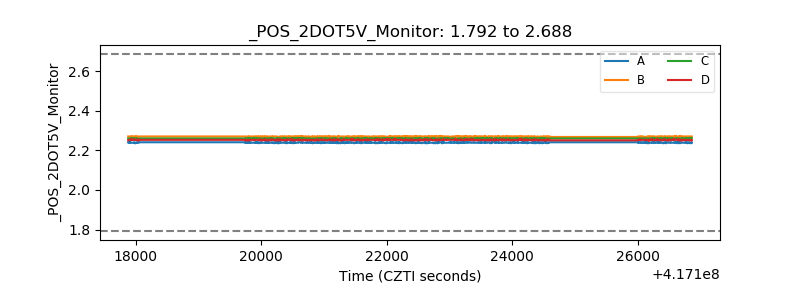 |
| +5 Volts monitor | 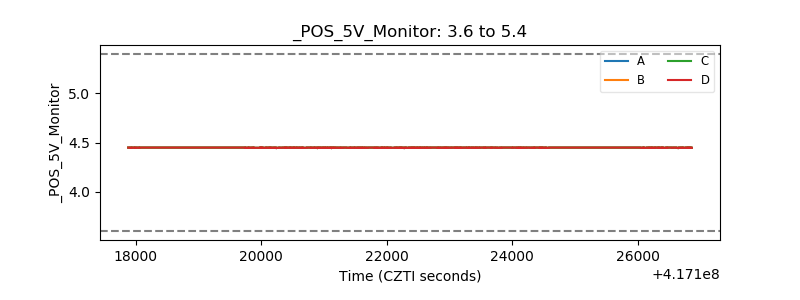 |
| _ROLL_ROT | 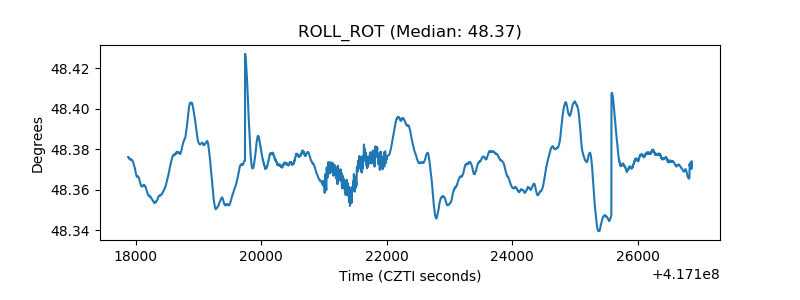 |
| _Roll_DEC | 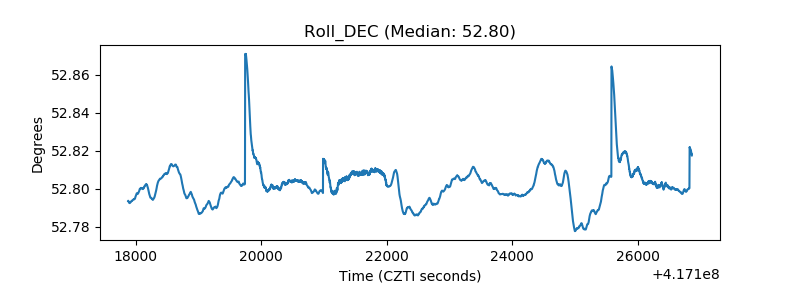 |
| _Roll_RA | 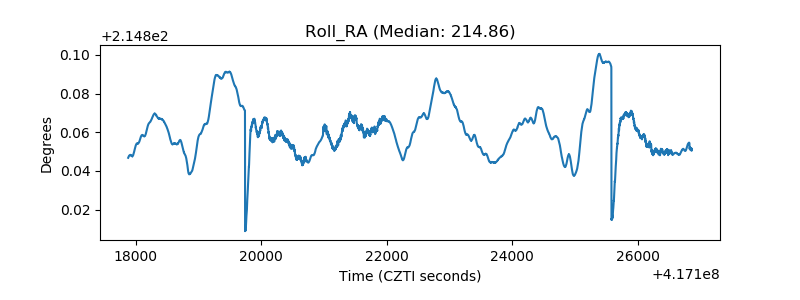 |
| Veto Counter | 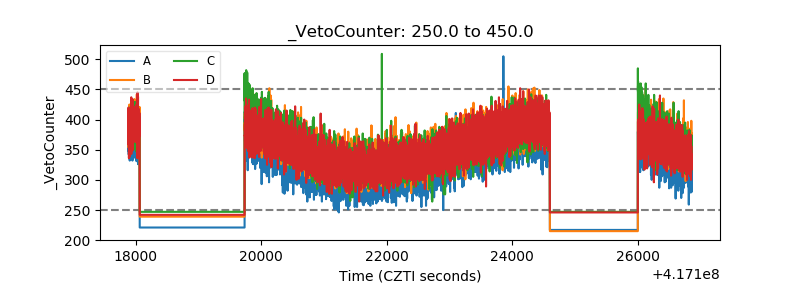 |