| Param | Original file | Final file |
|---|---|---|
| Filename | modeM0/AS1A12_022T01_9000005540_40437cztM0_level2.fits | modeM0/AS1A12_022T01_9000005540_40437cztM0_level2_quad_clean.evt |
| Size (bytes) | 388,301,760 | 93,666,240 |
| Size | 370.3 MB | 89.3 MB |
| Events in quadrant A | 3,021,390 | 646,216 |
| Events in quadrant B | 2,738,453 | 661,478 |
| Events in quadrant C | 2,842,904 | 634,112 |
| Events in quadrant D | 5,309,011 | 479,923 |
| Mode M0 | |||
|---|---|---|---|
| Quadrant | BADHDUFLAG | Total packets | Discarded packets |
| A | 0 | 12800 | 3 |
| B | 0 | 12341 | 2 |
| C | 0 | 12389 | 2 |
| D | 0 | 20057 | 2 |
| Mode M9 | |||
|---|---|---|---|
| Quadrant | BADHDUFLAG | Total packets | Discarded packets |
| A | 0 | 21 | 0 |
| B | 0 | 21 | 0 |
| C | 0 | 21 | 0 |
| D | 0 | 22 | 0 |
| Mode SS | |||
|---|---|---|---|
| Quadrant | BADHDUFLAG | Total packets | Discarded packets |
| A | 0 | 122 | 0 |
| B | 0 | 122 | 0 |
| C | 0 | 122 | 0 |
| D | 0 | 122 | 0 |
| Quadrant | Total seconds | Saturated seconds | Saturation percentage |
|---|---|---|---|
| A | 5926 | 17 | 0.286871% |
| B | 5926 | 11 | 0.185623% |
| C | 5926 | 53 | 0.894364% |
| D | 5926 | 1227 | 20.705366% |
Noise dominated data is calculated using 1-second bins in cleaned event files. If a bin has >2000 counts, and if more than 50% of those come from <1% of pixels, then it is considered to be noise-dominated and hence unusable.
| Quadrant | # 1 sec bins | Bins with >0 counts | Bins with >2000 counts | High rate bins dominated by noise | Noise dominated (total time) | Noise dominated (detector-on time) | Marked lightcurve |
|---|---|---|---|---|---|---|---|
| A | 7208 | 5927 | 5 | 5 | 0.07% | 0.08% | 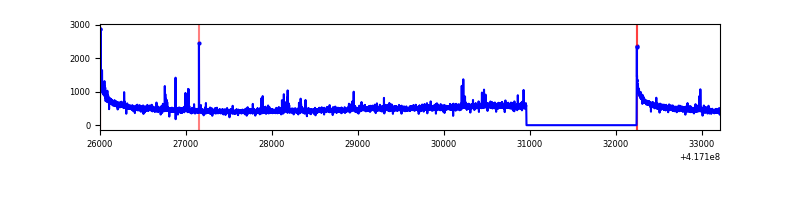 |
| B | 7208 | 5927 | 1 | 1 | 0.01% | 0.02% | 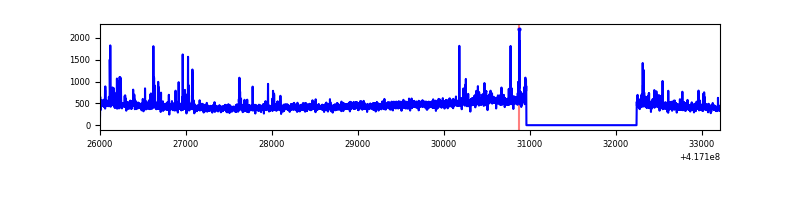 |
| C | 7208 | 5927 | 36 | 36 | 0.50% | 0.61% | 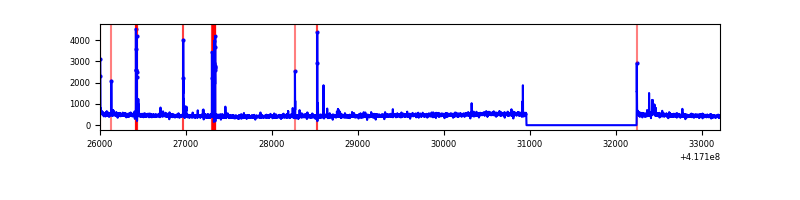 |
| D | 7208 | 5927 | 627 | 627 | 8.70% | 10.58% | 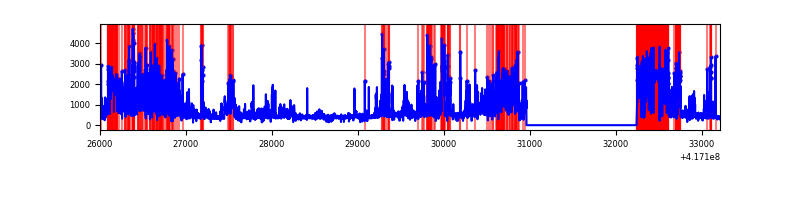 |
Top three noisy pixels from each quadrant. If the there are fewer than three noisy pixels in the level2.evt file, extra rows are filled as -1
| Pixel properties | Quadrant properties | ||||||
|---|---|---|---|---|---|---|---|
| Quadrant | DetID | PixID | Counts | Sigma | Mean | Median | Sigma |
| A | 10 | 83 | 499927 | 3932.96 | 627 | 613 | 127.0 |
| A | 7 | 3 | 43959 | 341.42 | 627 | 613 | 127.0 |
| A | 15 | 191 | 22435 | 171.89 | 627 | 613 | 127.0 |
| B | 4 | 170 | 104899 | 856.82 | 625 | 607 | 121.7 |
| B | 3 | 112 | 103979 | 849.26 | 625 | 607 | 121.7 |
| B | 5 | 255 | 43283 | 350.61 | 625 | 607 | 121.7 |
| C | 15 | 214 | 254443 | 1761.32 | 614 | 616 | 144.1 |
| C | 14 | 254 | 168880 | 1167.59 | 614 | 616 | 144.1 |
| C | 0 | 10 | 18261 | 122.44 | 614 | 616 | 144.1 |
| D | 2 | 250 | 1667159 | 12178.12 | 548 | 532 | 136.9 |
| D | 12 | 227 | 731063 | 5338.02 | 548 | 532 | 136.9 |
| D | 12 | 128 | 453572 | 3310.38 | 548 | 532 | 136.9 |
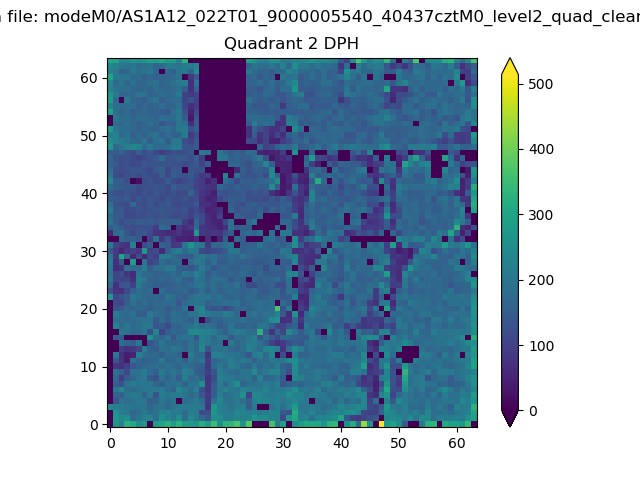
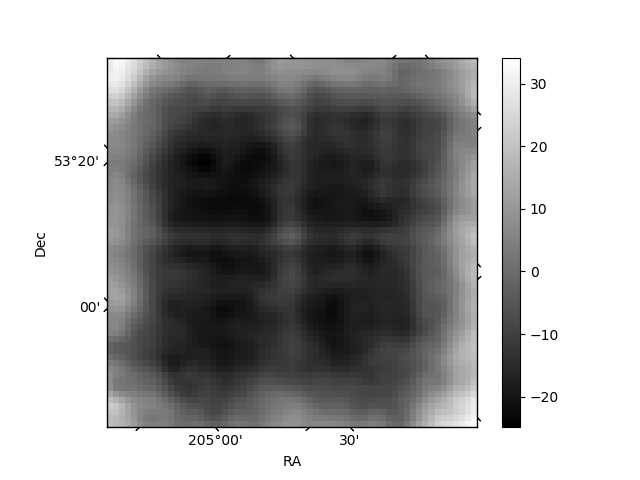
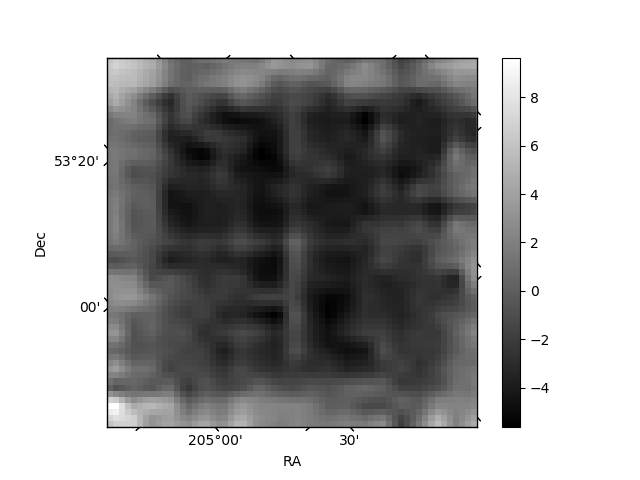
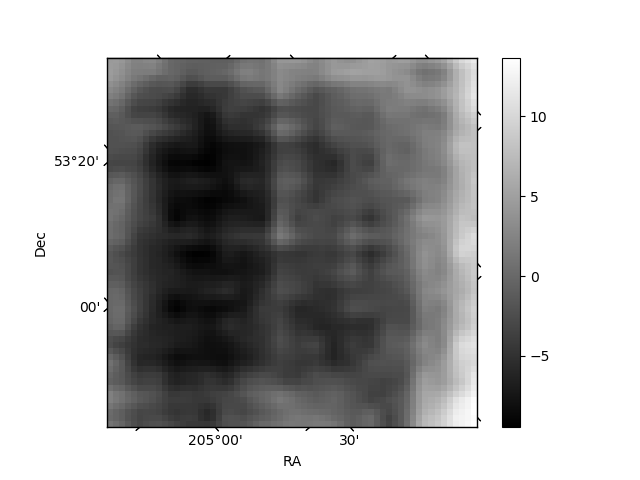
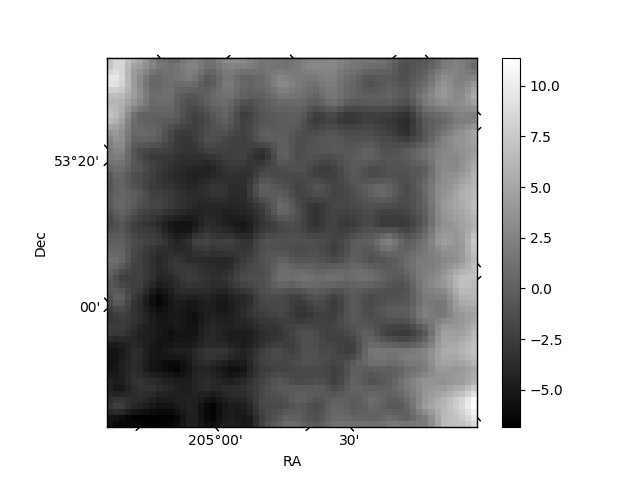
Histogram calculated using DETX and DETY for each event in the final _common_clean file
| Quadrant A | 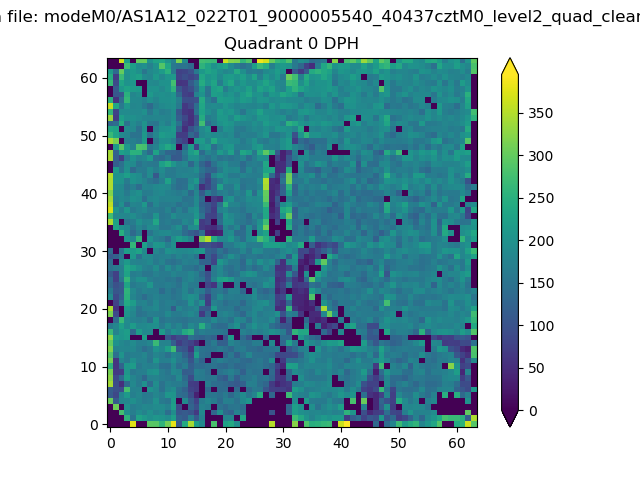 |
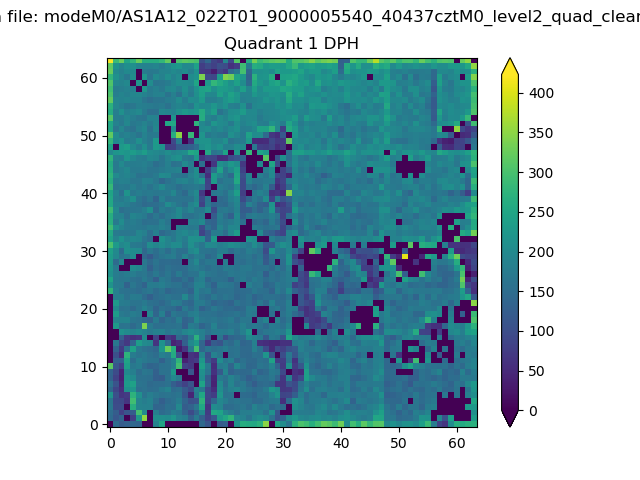 |
Quadrant B |
|---|---|---|---|
| Quadrant D | 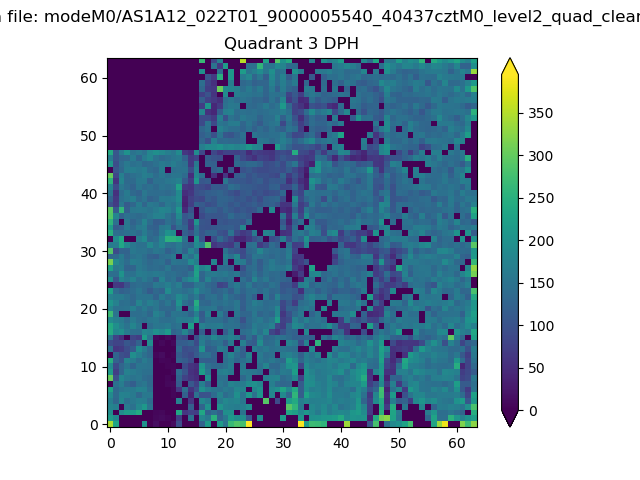 |
 |
Quadrant C |
| Plot type | Count rate plots | Images |
|---|---|---|
| Comparison with Poisson distribution Blue bars denote a histogram of data divided into 1 sec bins. Red curve is a Poisson curve with rate = median count rate of data. |
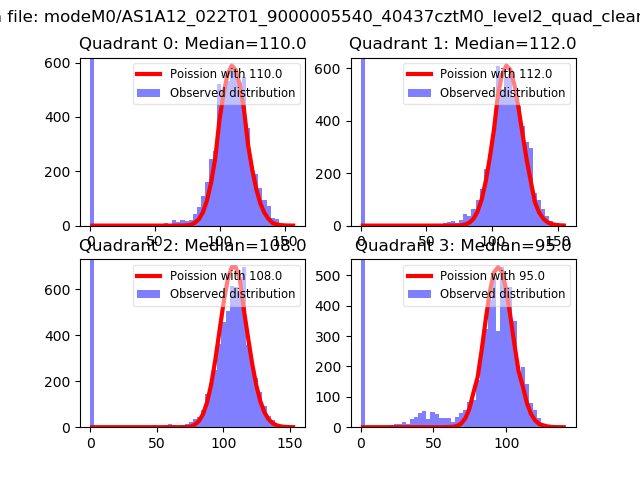 |
 |
| Quadrant-wise count rates Data is divided into 100 sec bins |
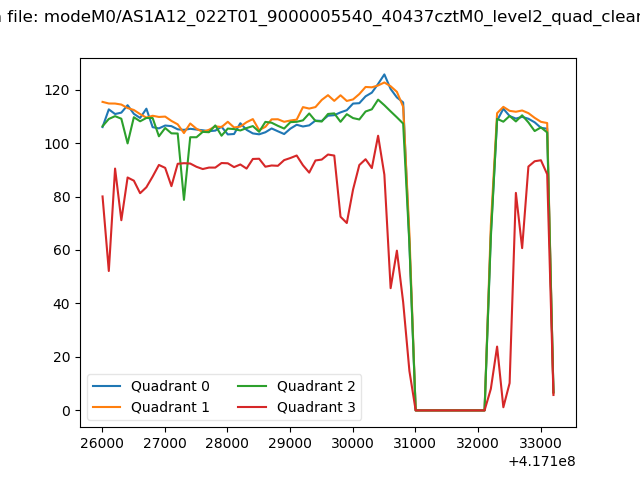 |
|
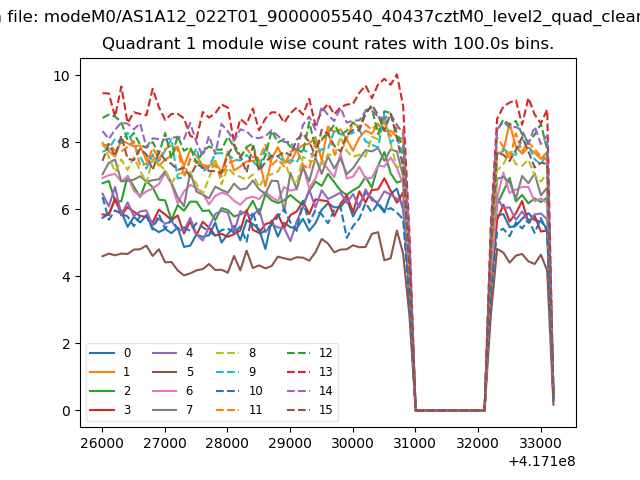
| Module-wise count rates for Quadrant A Data is divided into 100 sec bins |
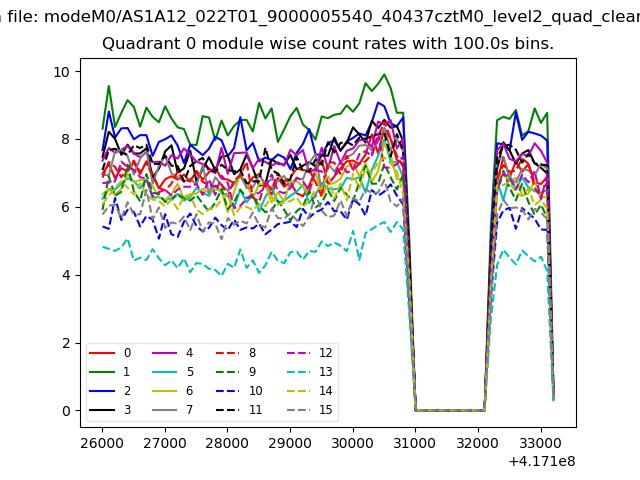 |
 |
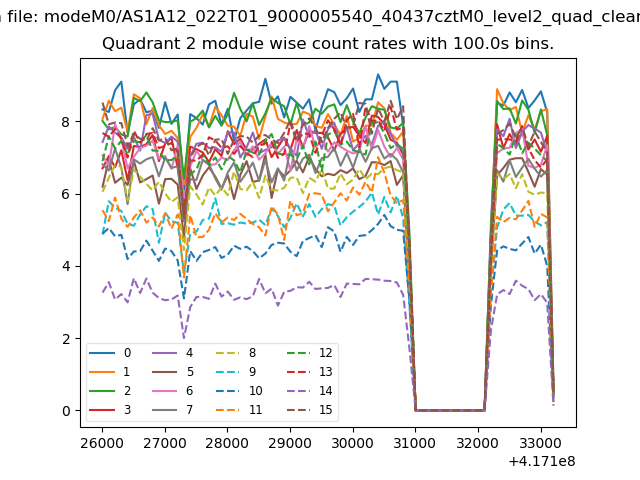
| Module-wise count rates for Quadrant B Data is divided into 100 sec bins |
 |
 |
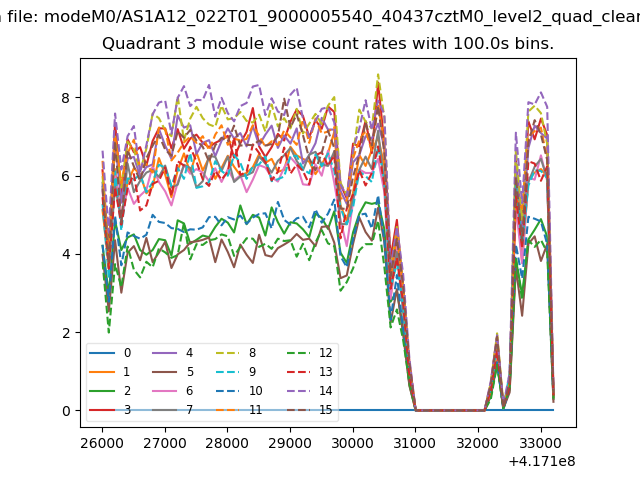
| Module-wise count rates for Quadrant C Data is divided into 100 sec bins |
 |
 |
| Module-wise count rates for Quadrant D Data is divided into 100 sec bins |
 |
 |
| Parameter | Plot |
|---|---|
| CZT HV Monitor | 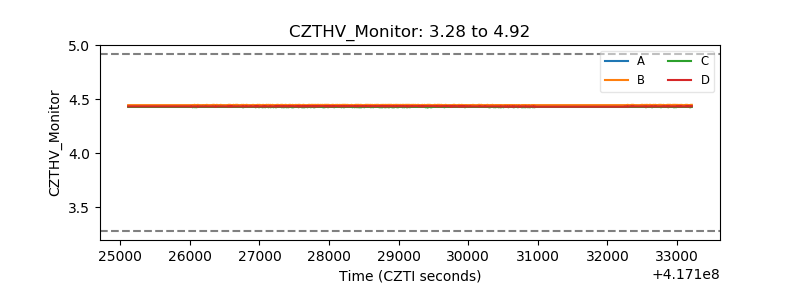 |
| D_VDD | 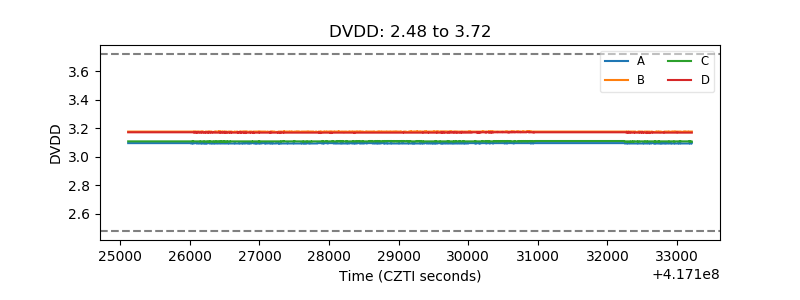 |
| Temperature 1 | 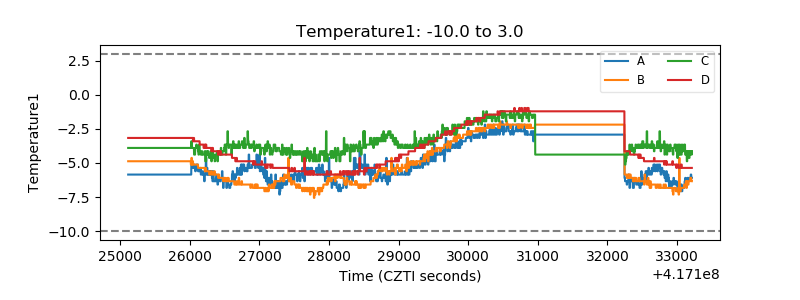 |
| Veto HV Monitor | 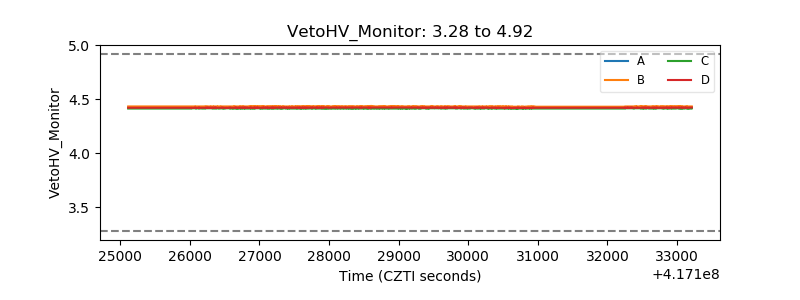 |
| Veto LLD | 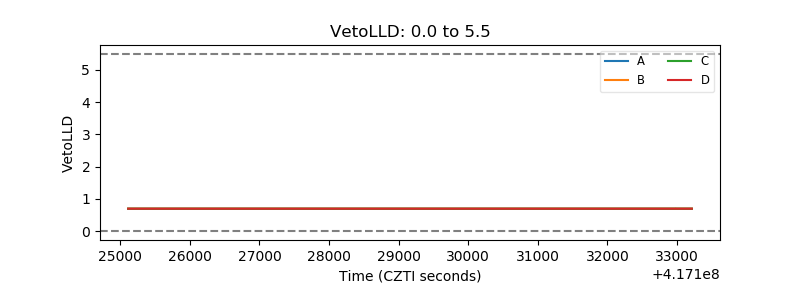 |
| Alpha Counter | 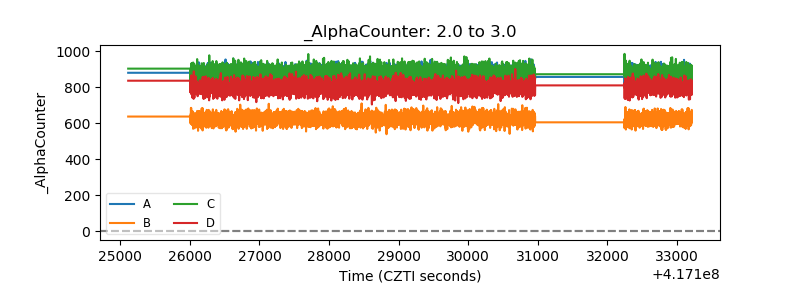 |
| _CPM_Rate | 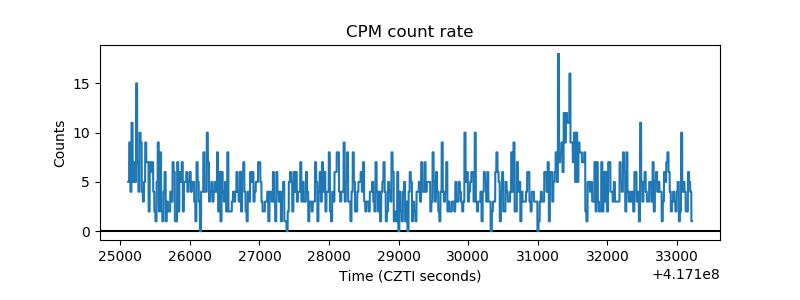 |
| CZT Counter | 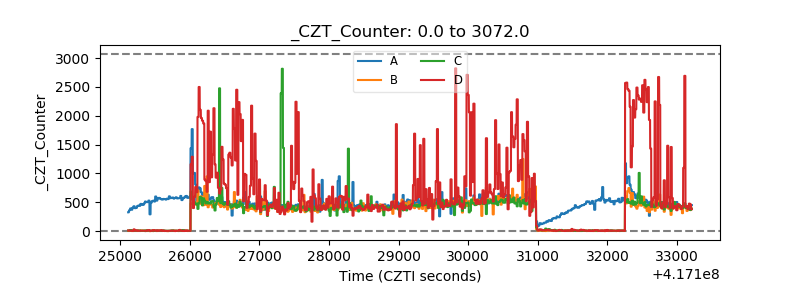 |
| +2.5 Volts monitor | 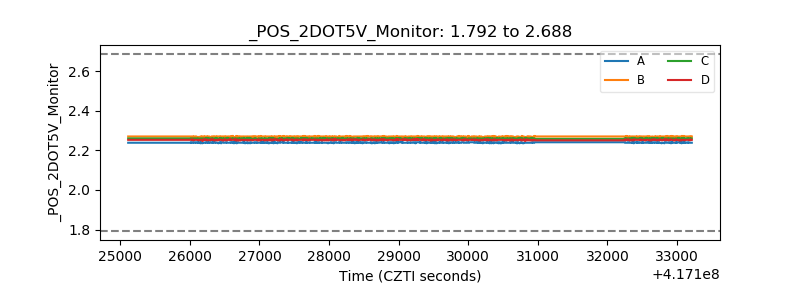 |
| +5 Volts monitor | 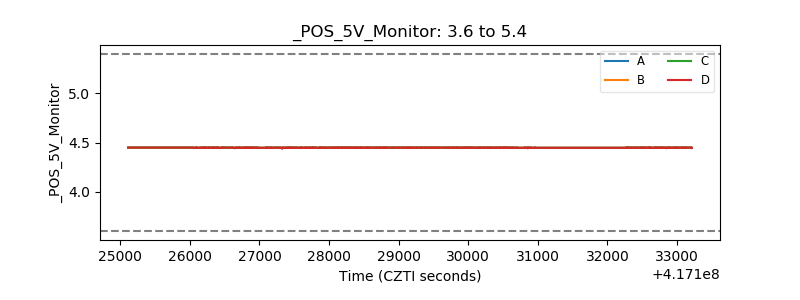 |
| _ROLL_ROT | 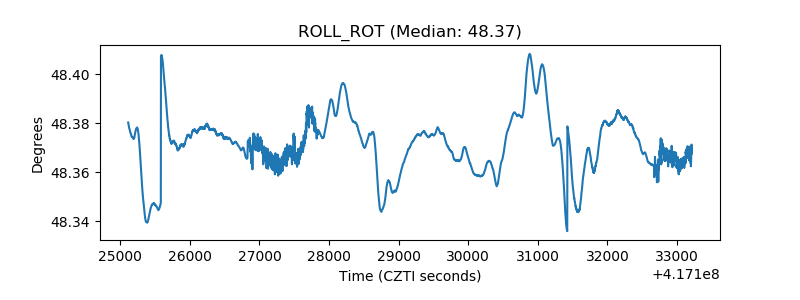 |
| _Roll_DEC | 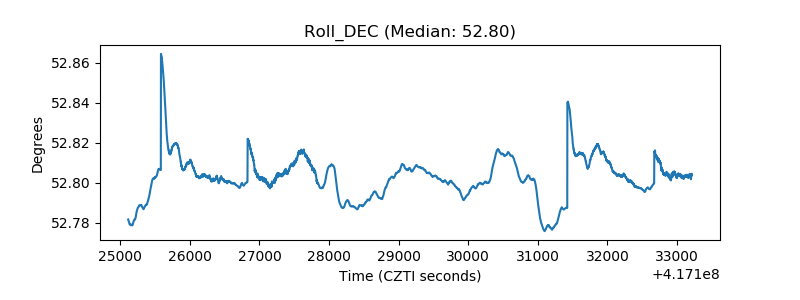 |
| _Roll_RA | 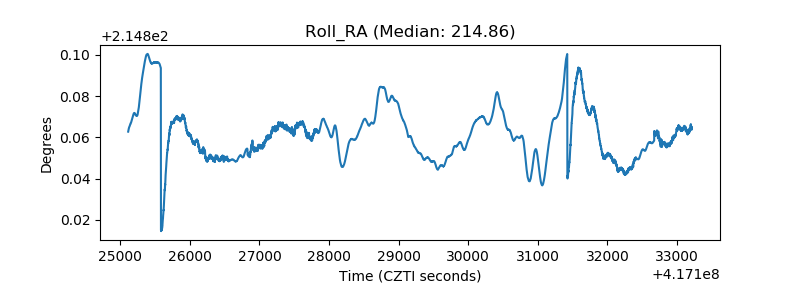 |
| Veto Counter | 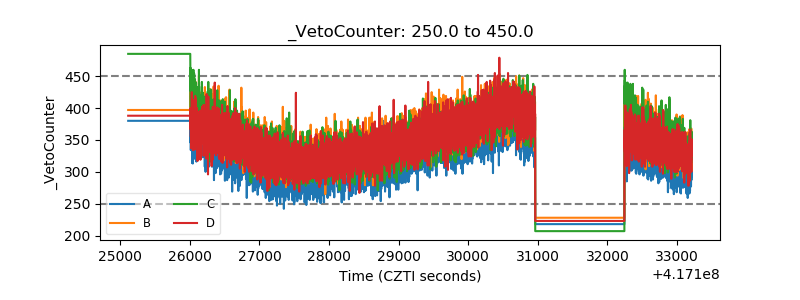 |