| Param | Original file | Final file |
|---|---|---|
| Filename | modeM0/AS1A12_022T01_9000005540_40440cztM0_level2.fits | modeM0/AS1A12_022T01_9000005540_40440cztM0_level2_quad_clean.evt |
| Size (bytes) | 917,075,520 | 244,422,720 |
| Size | 874.6 MB | 233.1 MB |
| Events in quadrant A | 7,862,042 | 1,664,199 |
| Events in quadrant B | 7,370,945 | 1,702,268 |
| Events in quadrant C | 7,561,145 | 1,641,842 |
| Events in quadrant D | 9,938,735 | 1,313,083 |
| Mode M0 | |||
|---|---|---|---|
| Quadrant | BADHDUFLAG | Total packets | Discarded packets |
| A | 0 | 33364 | 5 |
| B | 0 | 33130 | 4 |
| C | 0 | 32975 | 4 |
| D | 0 | 40874 | 4 |
| Mode M9 | |||
|---|---|---|---|
| Quadrant | BADHDUFLAG | Total packets | Discarded packets |
| A | 0 | 51 | 0 |
| B | 0 | 51 | 0 |
| C | 0 | 51 | 0 |
| D | 0 | 52 | 0 |
| Mode SS | |||
|---|---|---|---|
| Quadrant | BADHDUFLAG | Total packets | Discarded packets |
| A | 0 | 316 | 0 |
| B | 0 | 316 | 0 |
| C | 0 | 316 | 0 |
| D | 0 | 316 | 0 |
| Quadrant | Total seconds | Saturated seconds | Saturation percentage |
|---|---|---|---|
| A | 15644 | 26 | 0.166198% |
| B | 15644 | 83 | 0.530555% |
| C | 15644 | 98 | 0.626438% |
| D | 15644 | 2212 | 14.139606% |
Noise dominated data is calculated using 1-second bins in cleaned event files. If a bin has >2000 counts, and if more than 50% of those come from <1% of pixels, then it is considered to be noise-dominated and hence unusable.
| Quadrant | # 1 sec bins | Bins with >0 counts | Bins with >2000 counts | High rate bins dominated by noise | Noise dominated (total time) | Noise dominated (detector-on time) | Marked lightcurve |
|---|---|---|---|---|---|---|---|
| A | 19853 | 15647 | 13 | 13 | 0.07% | 0.08% | 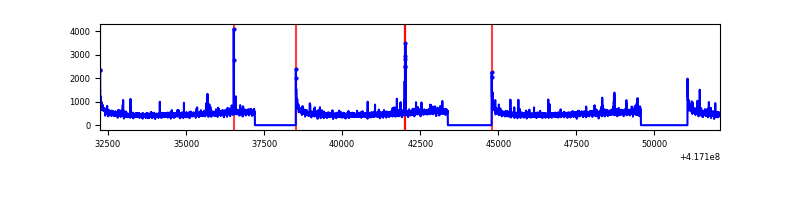 |
| B | 19853 | 15647 | 44 | 44 | 0.22% | 0.28% | 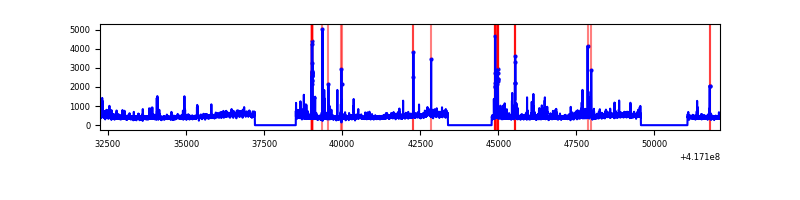 |
| C | 19853 | 15647 | 75 | 75 | 0.38% | 0.48% | 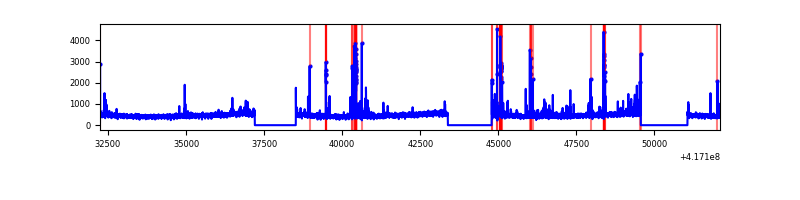 |
| D | 19853 | 15647 | 732 | 732 | 3.69% | 4.68% | 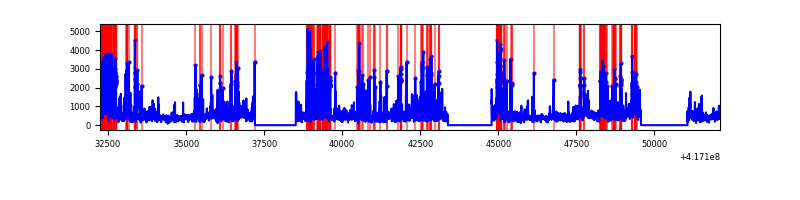 |
Top three noisy pixels from each quadrant. If the there are fewer than three noisy pixels in the level2.evt file, extra rows are filled as -1
| Pixel properties | Quadrant properties | ||||||
|---|---|---|---|---|---|---|---|
| Quadrant | DetID | PixID | Counts | Sigma | Mean | Median | Sigma |
| A | 10 | 83 | 1243494 | 3665.12 | 1671 | 1636 | 338.8 |
| A | 7 | 3 | 43856 | 124.6 | 1671 | 1636 | 338.8 |
| A | 13 | 248 | 30253 | 84.46 | 1671 | 1636 | 338.8 |
| B | 5 | 255 | 378961 | 1196.47 | 1657 | 1612 | 315.4 |
| B | 3 | 112 | 175670 | 551.89 | 1657 | 1612 | 315.4 |
| B | 4 | 170 | 161853 | 508.08 | 1657 | 1612 | 315.4 |
| C | 15 | 214 | 668899 | 1783.37 | 1623 | 1632 | 374.2 |
| C | 14 | 254 | 524767 | 1398.15 | 1623 | 1632 | 374.2 |
| C | 0 | 10 | 19613 | 48.06 | 1623 | 1632 | 374.2 |
| D | 12 | 227 | 1736751 | 4733.76 | 1500 | 1460 | 366.6 |
| D | 2 | 250 | 1390929 | 3790.38 | 1500 | 1460 | 366.6 |
| D | 12 | 191 | 432750 | 1176.53 | 1500 | 1460 | 366.6 |
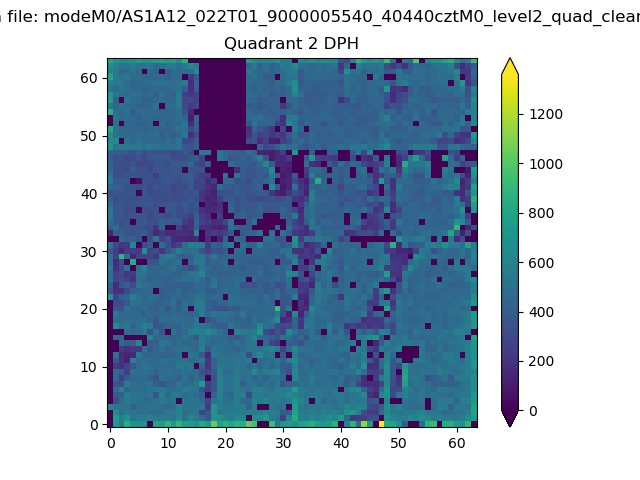
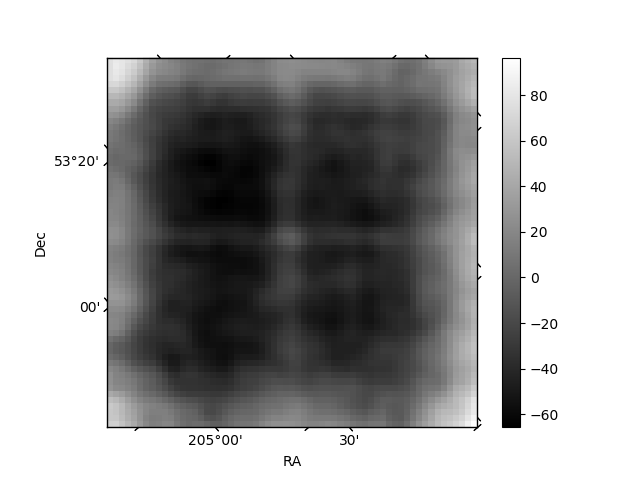
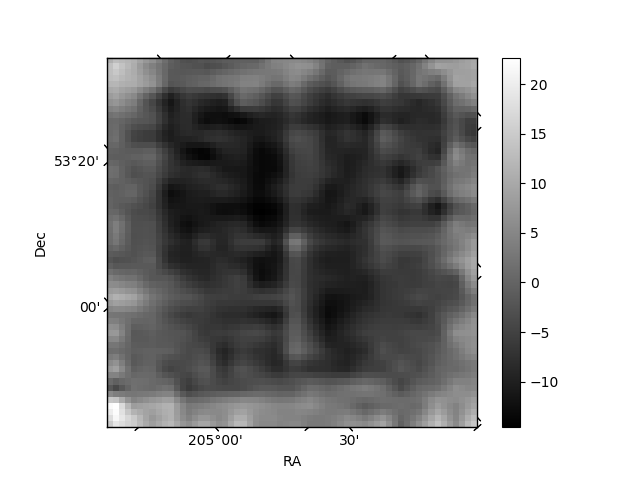
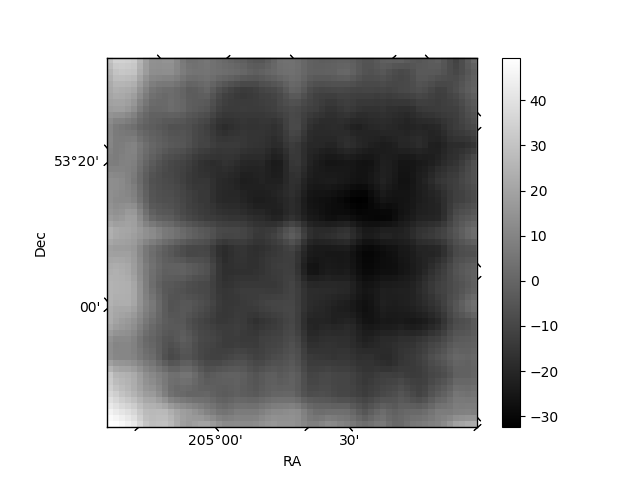
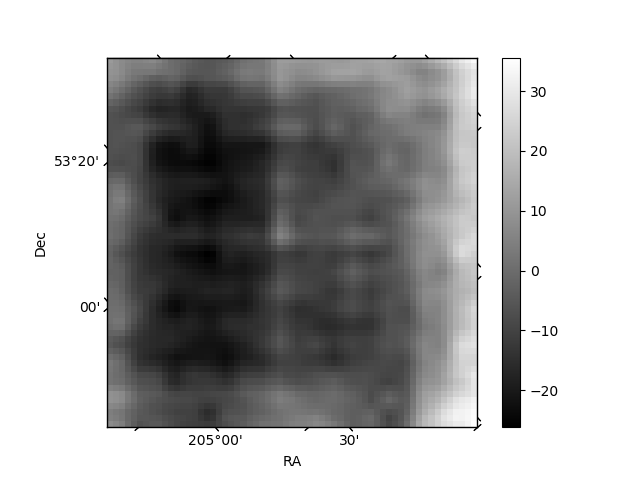
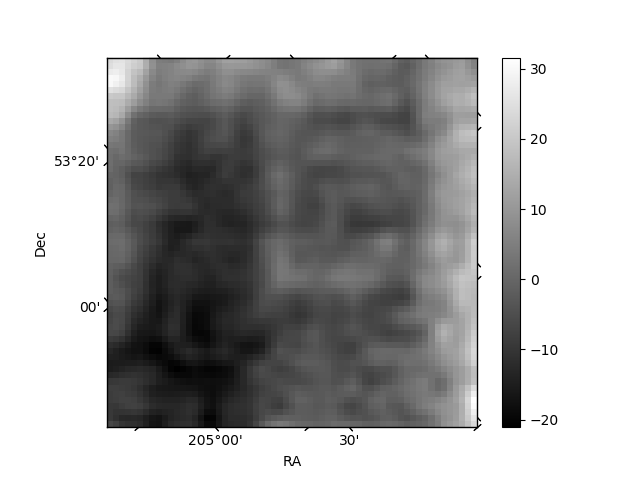
Histogram calculated using DETX and DETY for each event in the final _common_clean file
| Quadrant A | 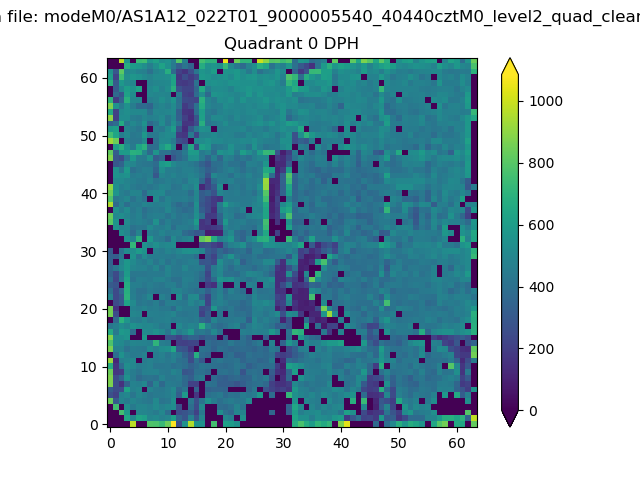 |
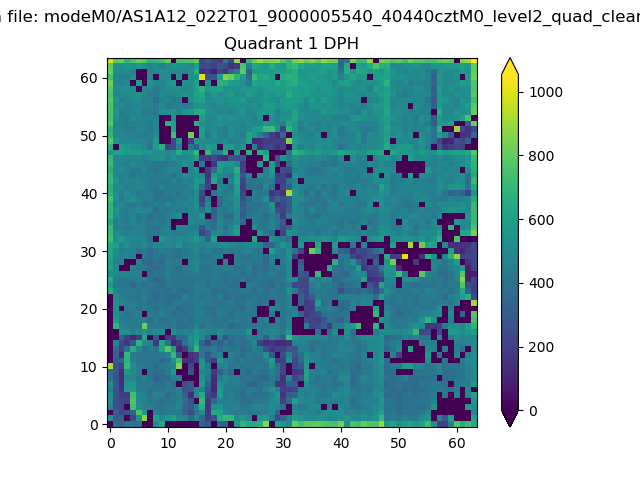 |
Quadrant B |
|---|---|---|---|
| Quadrant D | 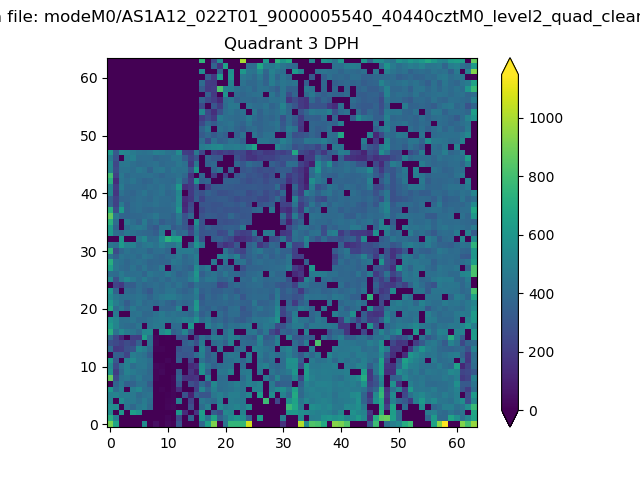 |
 |
Quadrant C |
| Plot type | Count rate plots | Images |
|---|---|---|
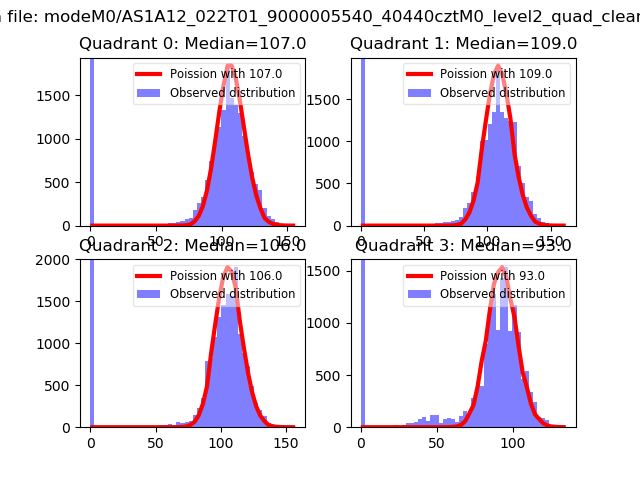
| Comparison with Poisson distribution Blue bars denote a histogram of data divided into 1 sec bins. Red curve is a Poisson curve with rate = median count rate of data. |
 |
 |
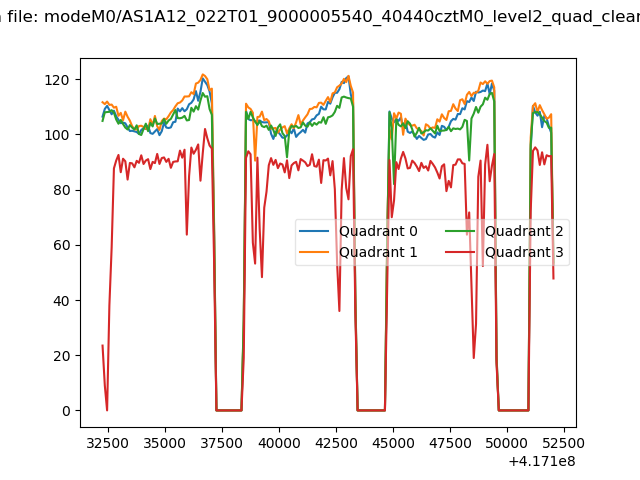
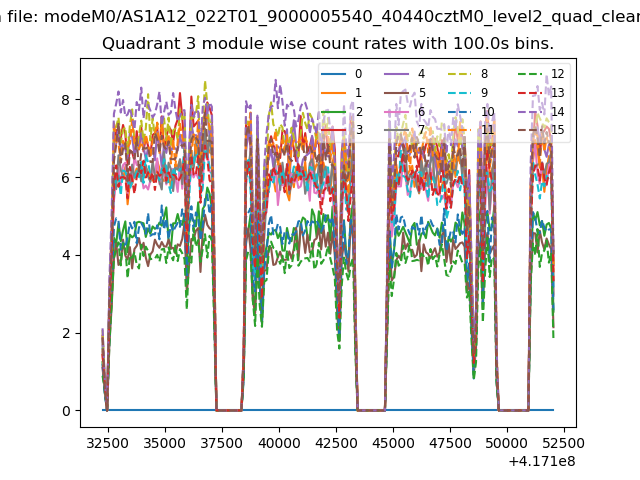
| Quadrant-wise count rates Data is divided into 100 sec bins |
 |
|
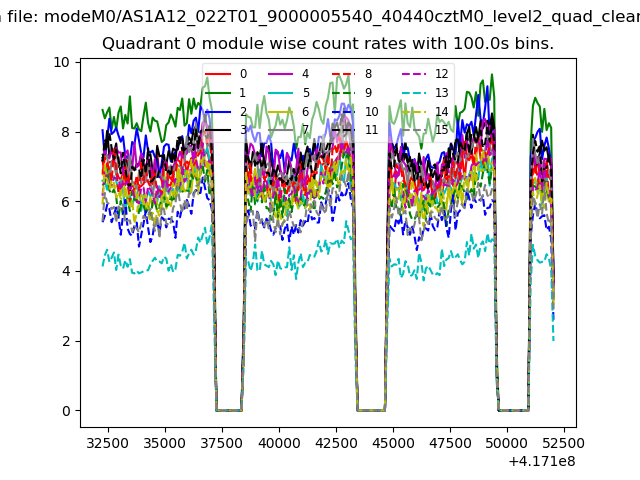
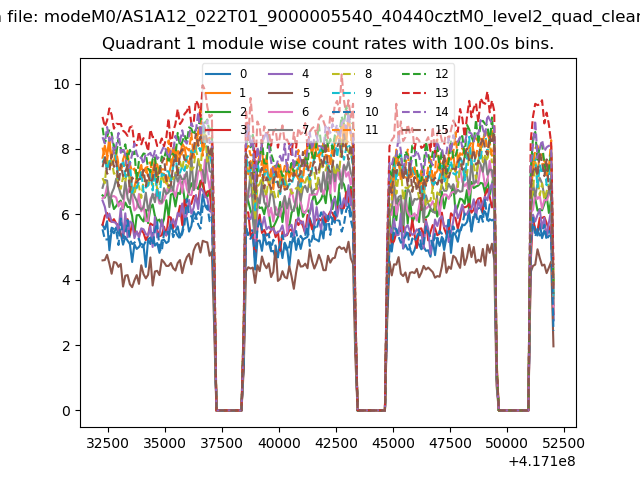
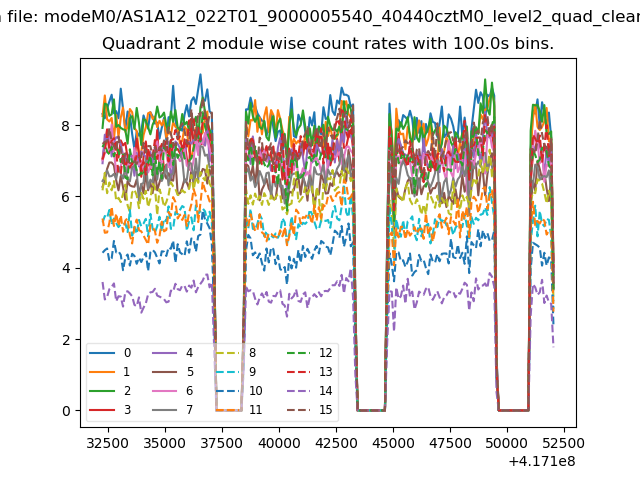
| Module-wise count rates for Quadrant A Data is divided into 100 sec bins |
 |
 |
| Module-wise count rates for Quadrant B Data is divided into 100 sec bins |
 |
 |
| Module-wise count rates for Quadrant C Data is divided into 100 sec bins |
 |
 |
| Module-wise count rates for Quadrant D Data is divided into 100 sec bins |
 |
 |
| Parameter | Plot |
|---|---|
| CZT HV Monitor | 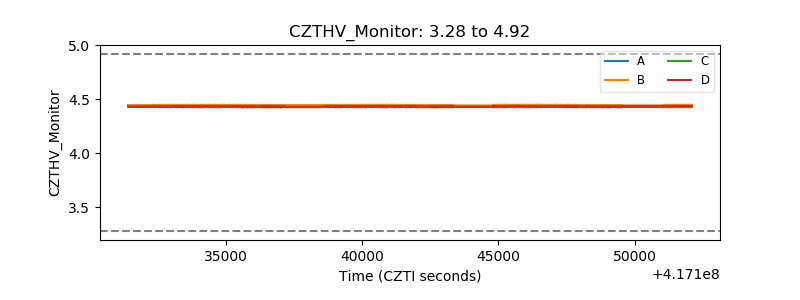 |
| D_VDD | 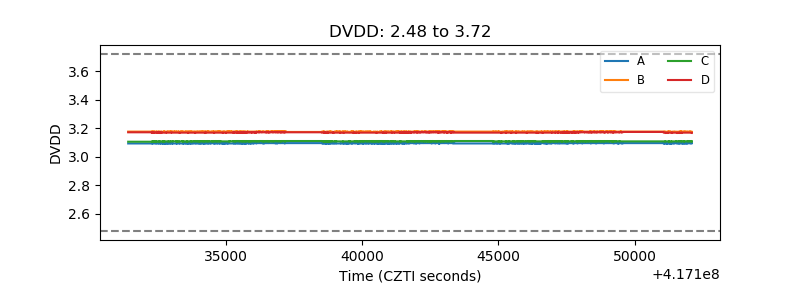 |
| Temperature 1 | 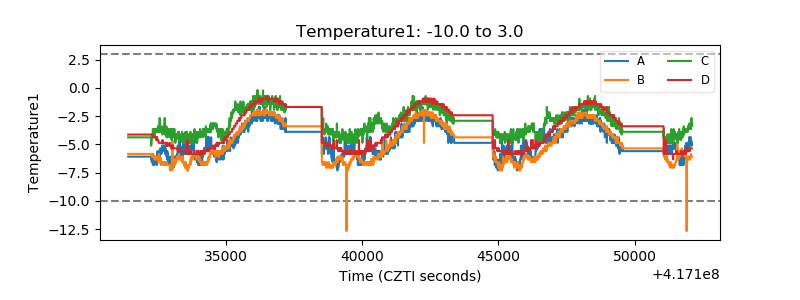 |
| Veto HV Monitor | 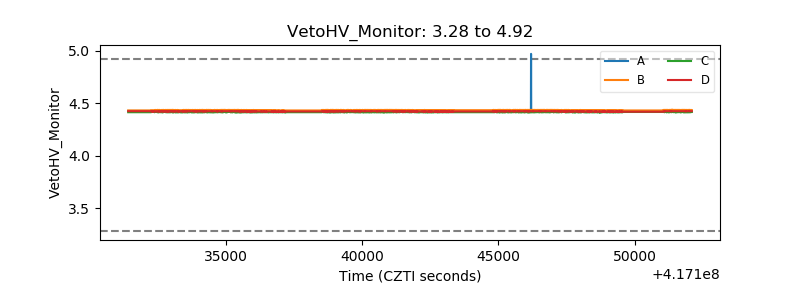 |
| Veto LLD | 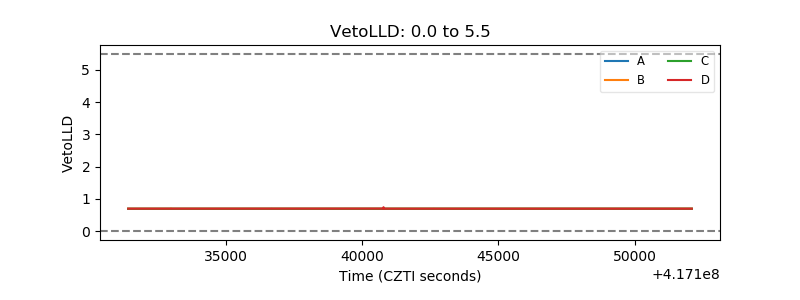 |
| Alpha Counter | 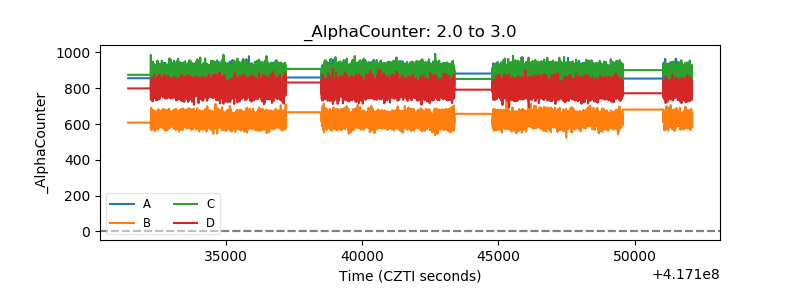 |
| _CPM_Rate | 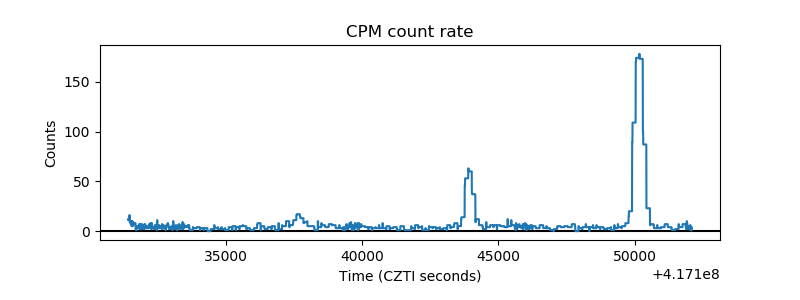 |
| CZT Counter | 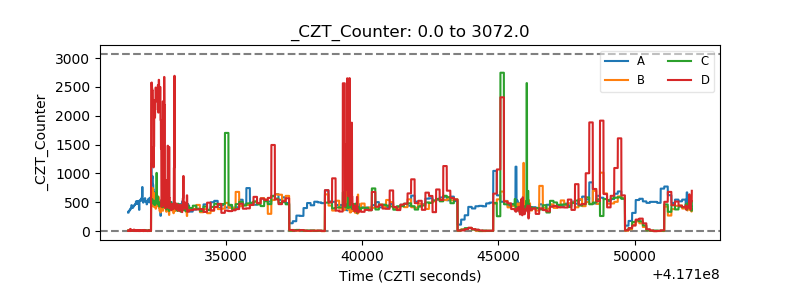 |
| +2.5 Volts monitor | 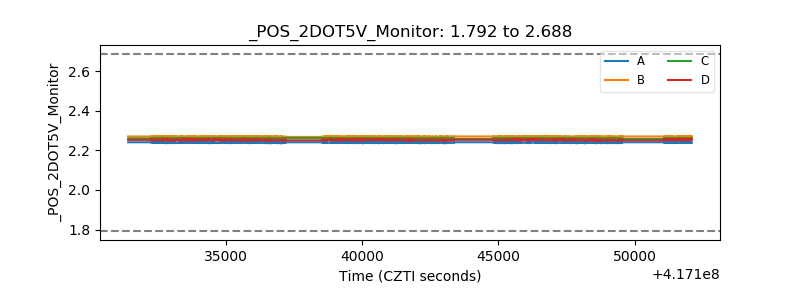 |
| +5 Volts monitor | 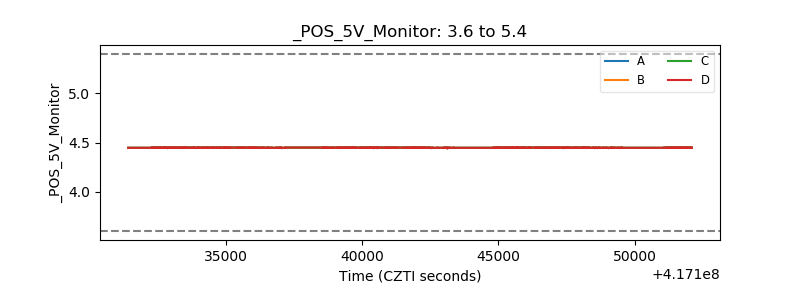 |
| _ROLL_ROT | 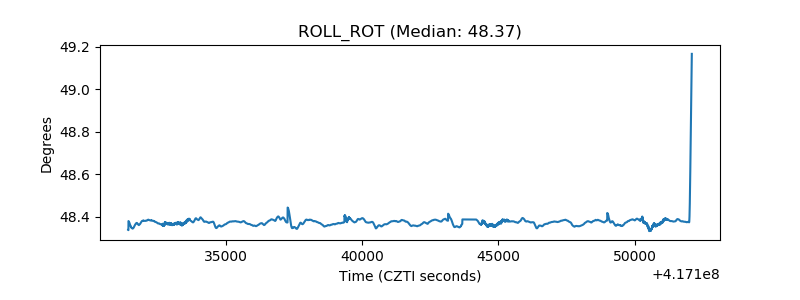 |
| _Roll_DEC | 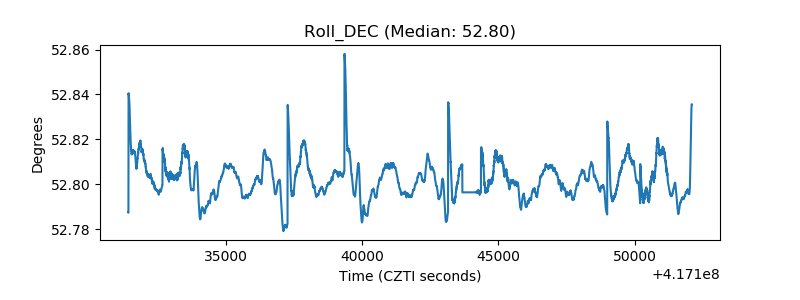 |
| _Roll_RA | 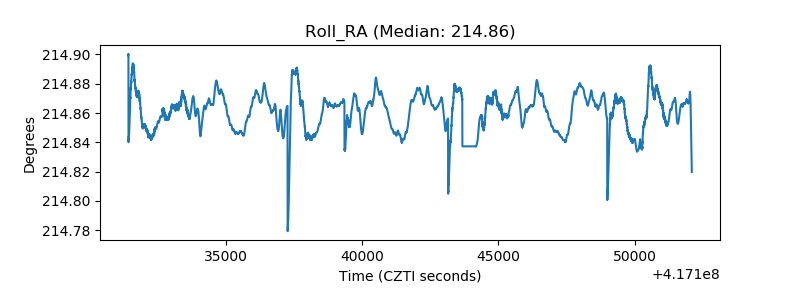 |
| Veto Counter | 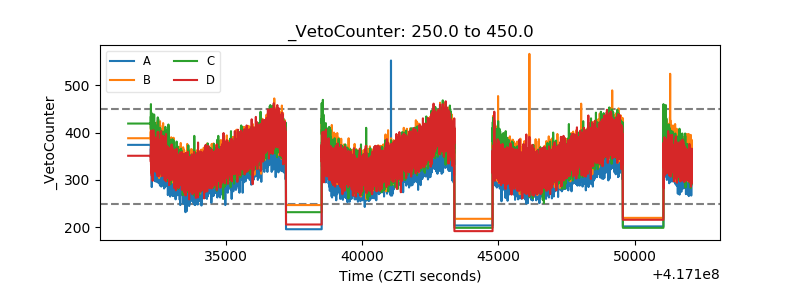 |