| Param | Original file | Final file |
|---|---|---|
| Filename | modeM0/AS1A12_022T01_9000005540_40441cztM0_level2.fits | modeM0/AS1A12_022T01_9000005540_40441cztM0_level2_quad_clean.evt |
| Size (bytes) | 309,859,200 | 86,650,560 |
| Size | 295.5 MB | 82.6 MB |
| Events in quadrant A | 2,839,097 | 594,156 |
| Events in quadrant B | 2,406,478 | 614,091 |
| Events in quadrant C | 2,667,885 | 586,395 |
| Events in quadrant D | 3,124,216 | 442,067 |
| Mode M0 | |||
|---|---|---|---|
| Quadrant | BADHDUFLAG | Total packets | Discarded packets |
| A | 0 | 11770 | 3 |
| B | 0 | 11154 | 2 |
| C | 0 | 11544 | 2 |
| D | 0 | 13201 | 2 |
| Mode M9 | |||
|---|---|---|---|
| Quadrant | BADHDUFLAG | Total packets | Discarded packets |
| A | 0 | 29 | 0 |
| B | 0 | 29 | 0 |
| C | 0 | 29 | 0 |
| D | 0 | 30 | 0 |
| Mode SS | |||
|---|---|---|---|
| Quadrant | BADHDUFLAG | Total packets | Discarded packets |
| A | 0 | 112 | 0 |
| B | 0 | 112 | 0 |
| C | 0 | 112 | 0 |
| D | 0 | 112 | 0 |
| Quadrant | Total seconds | Saturated seconds | Saturation percentage |
|---|---|---|---|
| A | 5529 | 13 | 0.235124% |
| B | 5529 | 10 | 0.180865% |
| C | 5529 | 15 | 0.271297% |
| D | 5529 | 1039 | 18.791825% |
Noise dominated data is calculated using 1-second bins in cleaned event files. If a bin has >2000 counts, and if more than 50% of those come from <1% of pixels, then it is considered to be noise-dominated and hence unusable.
| Quadrant | # 1 sec bins | Bins with >0 counts | Bins with >2000 counts | High rate bins dominated by noise | Noise dominated (total time) | Noise dominated (detector-on time) | Marked lightcurve |
|---|---|---|---|---|---|---|---|
| A | 7171 | 5530 | 2 | 2 | 0.03% | 0.04% | 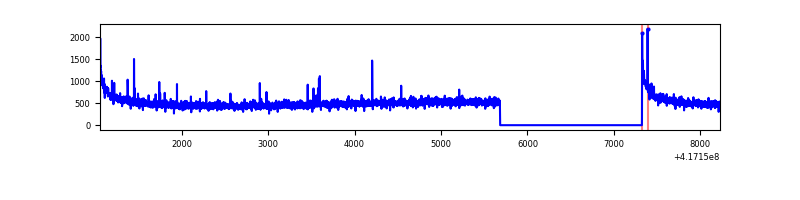 |
| B | 7171 | 5530 | 2 | 2 | 0.03% | 0.04% | 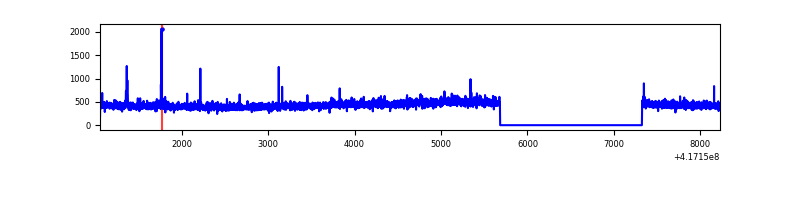 |
| C | 7171 | 5530 | 12 | 12 | 0.17% | 0.22% | 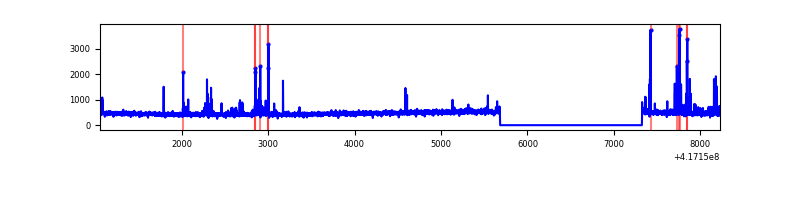 |
| D | 7171 | 5530 | 58 | 58 | 0.81% | 1.05% | 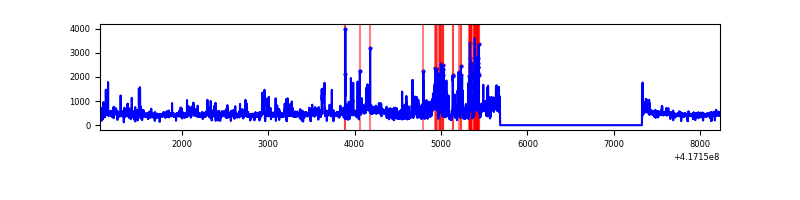 |
Top three noisy pixels from each quadrant. If the there are fewer than three noisy pixels in the level2.evt file, extra rows are filled as -1
| Pixel properties | Quadrant properties | ||||||
|---|---|---|---|---|---|---|---|
| Quadrant | DetID | PixID | Counts | Sigma | Mean | Median | Sigma |
| A | 10 | 83 | 491017 | 3984.7 | 597 | 584 | 123.1 |
| A | 7 | 3 | 16183 | 126.74 | 597 | 584 | 123.1 |
| A | 2 | 79 | 12696 | 98.41 | 597 | 584 | 123.1 |
| B | 3 | 112 | 39464 | 336.73 | 590 | 572 | 115.5 |
| B | 5 | 255 | 17737 | 148.62 | 590 | 572 | 115.5 |
| B | 12 | 111 | 14928 | 124.3 | 590 | 572 | 115.5 |
| C | 15 | 214 | 240071 | 1776.55 | 577 | 582 | 134.8 |
| C | 14 | 254 | 164067 | 1212.75 | 577 | 582 | 134.8 |
| C | 12 | 249 | 10171 | 71.13 | 577 | 582 | 134.8 |
| D | 12 | 227 | 606713 | 4804.63 | 509 | 494 | 126.2 |
| D | 12 | 191 | 217093 | 1716.67 | 509 | 494 | 126.2 |
| D | 2 | 250 | 191263 | 1511.95 | 509 | 494 | 126.2 |
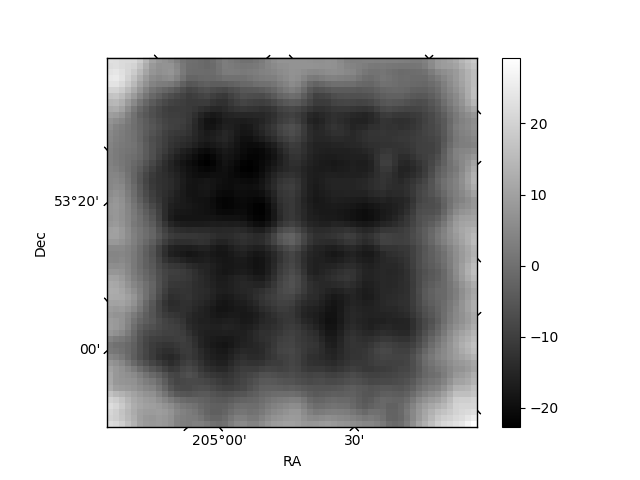
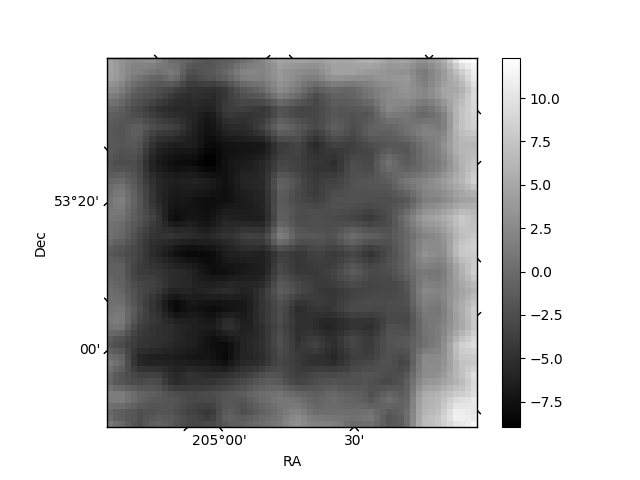
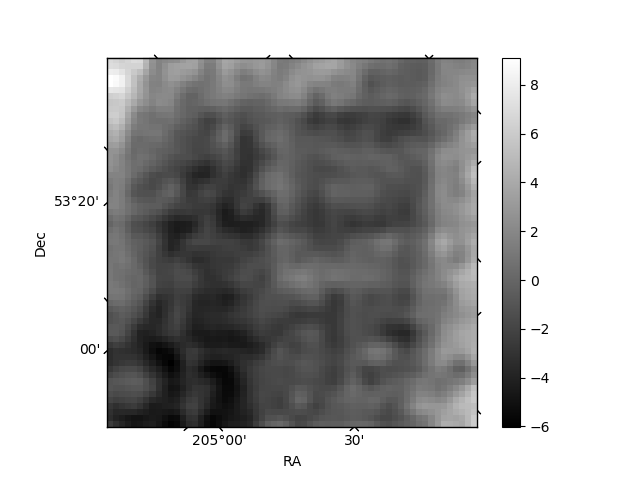
Histogram calculated using DETX and DETY for each event in the final _common_clean file
| Quadrant A | 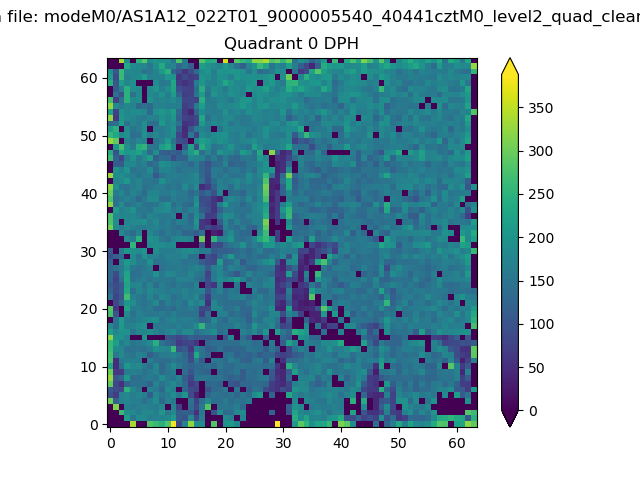 |
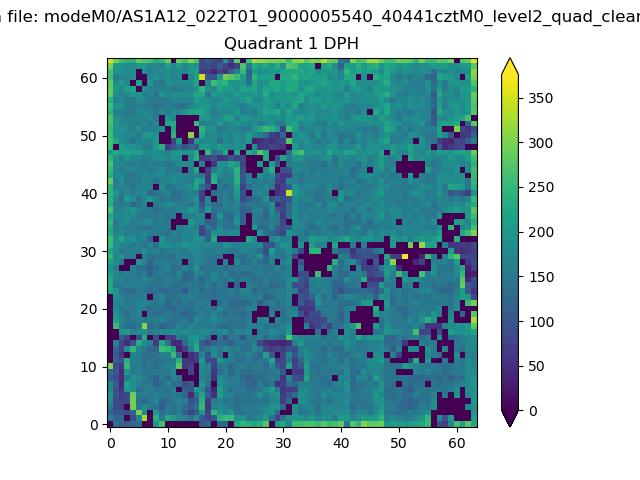 |
Quadrant B |
|---|---|---|---|
| Quadrant D | 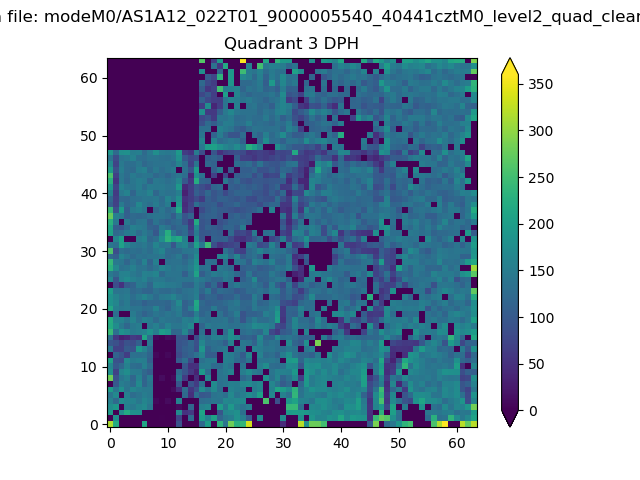 |
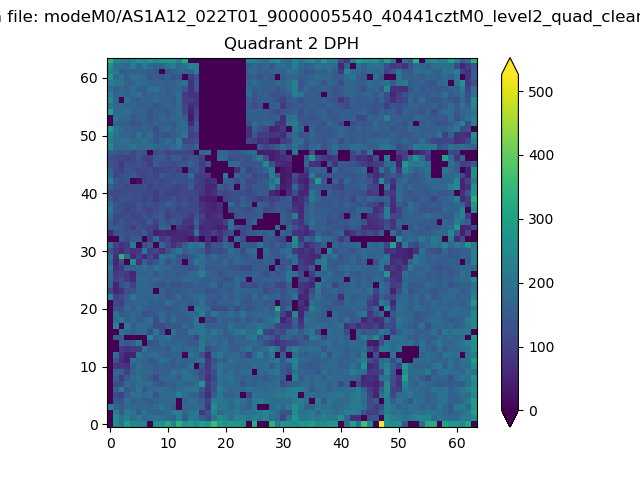 |
Quadrant C |
| Plot type | Count rate plots | Images |
|---|---|---|
| Comparison with Poisson distribution Blue bars denote a histogram of data divided into 1 sec bins. Red curve is a Poisson curve with rate = median count rate of data. |
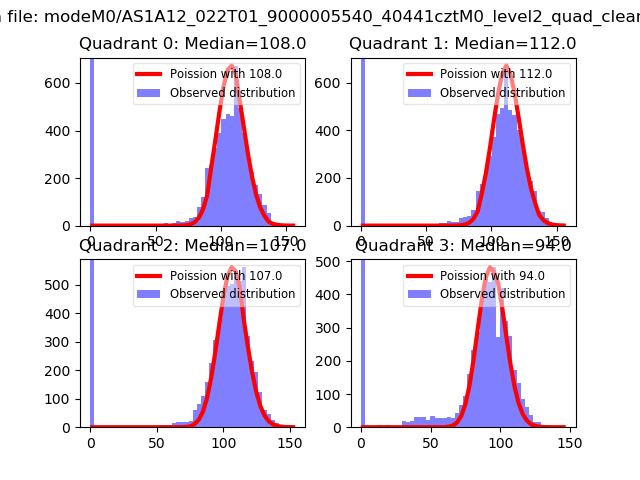 |
 |
| Quadrant-wise count rates Data is divided into 100 sec bins |
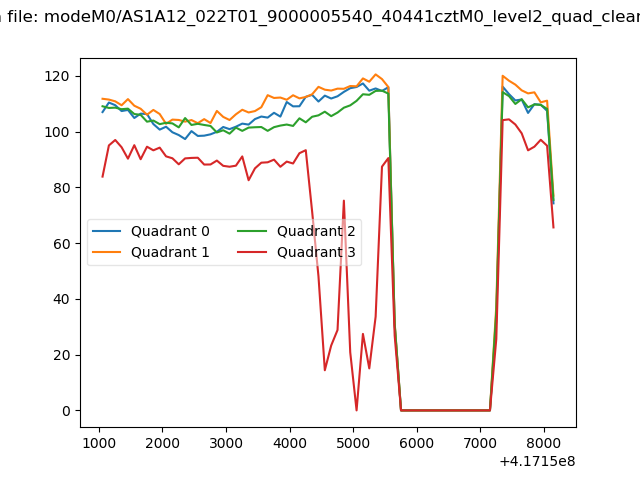 |
|
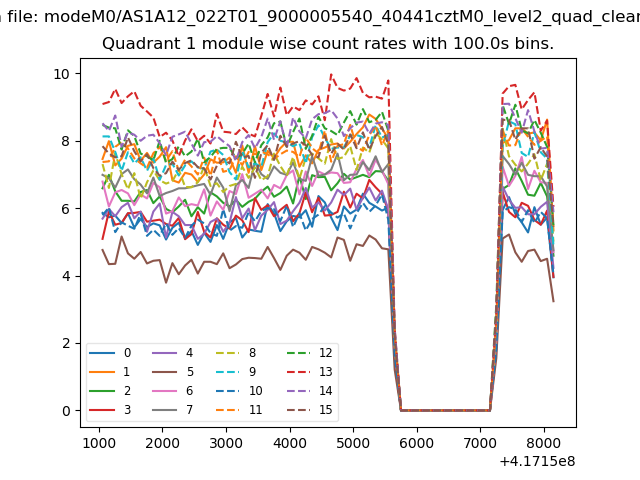
| Module-wise count rates for Quadrant A Data is divided into 100 sec bins |
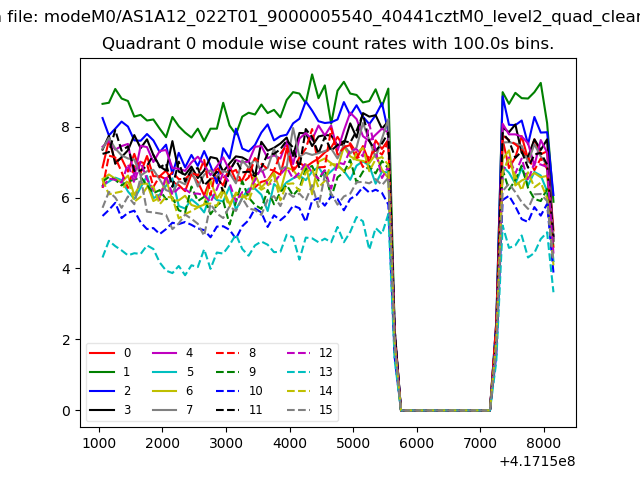 |
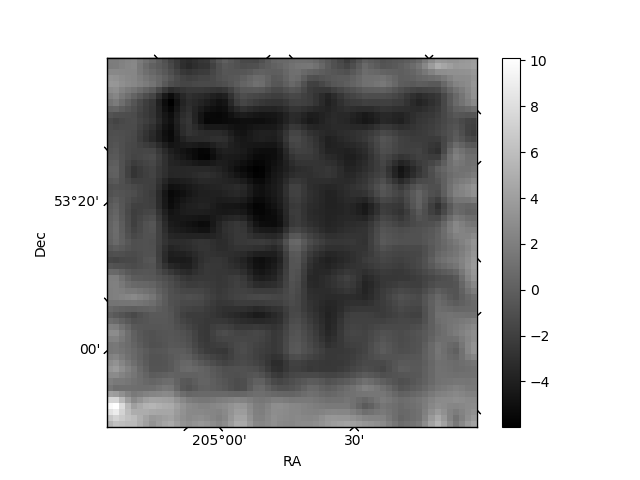 |
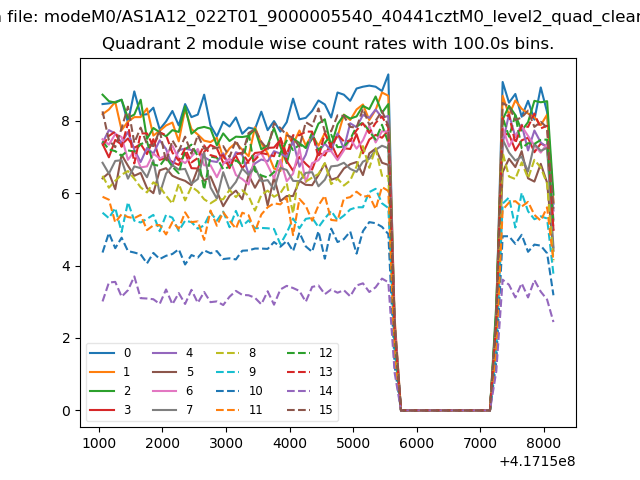
| Module-wise count rates for Quadrant B Data is divided into 100 sec bins |
 |
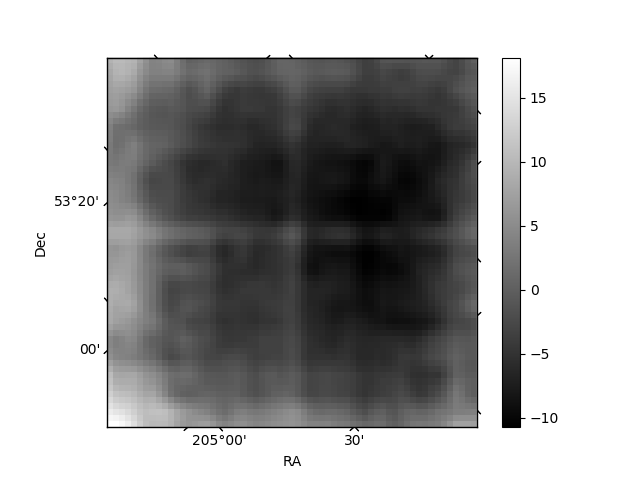 |
| Module-wise count rates for Quadrant C Data is divided into 100 sec bins |
 |
 |
| Module-wise count rates for Quadrant D Data is divided into 100 sec bins |
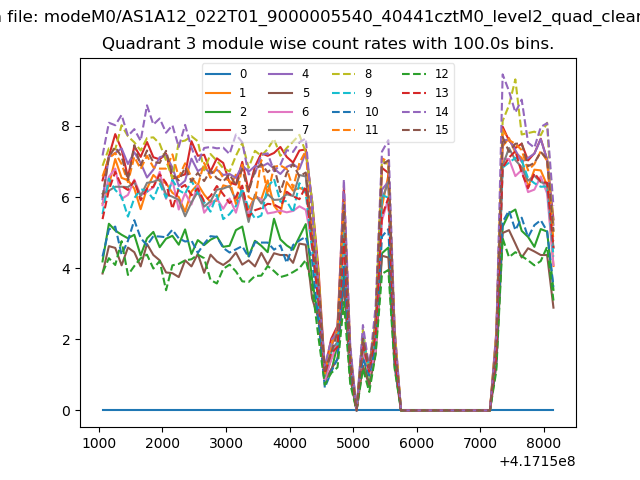 |
 |
| Parameter | Plot |
|---|---|
| CZT HV Monitor | 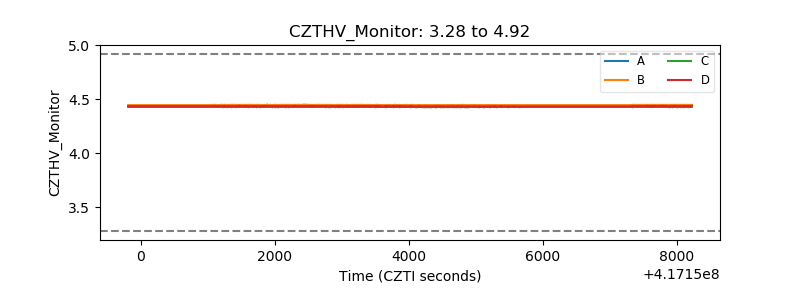 |
| D_VDD | 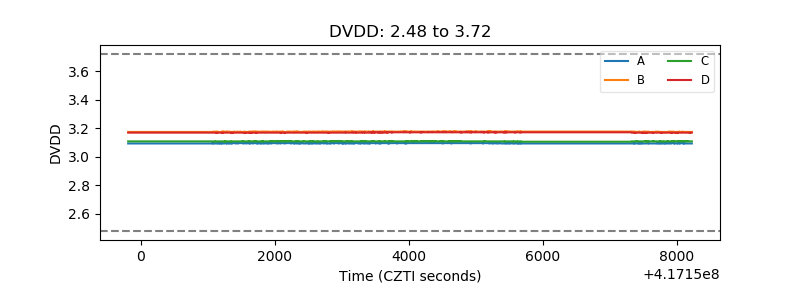 |
| Temperature 1 | 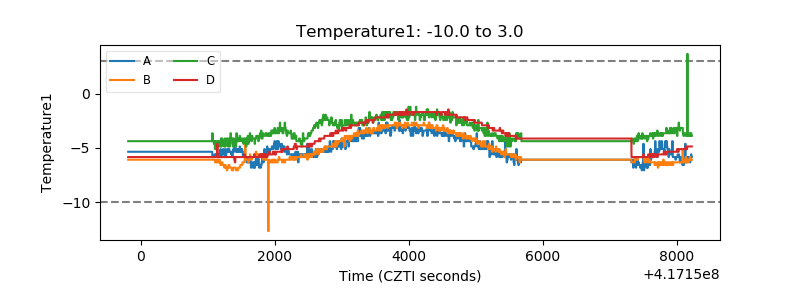 |
| Veto HV Monitor | 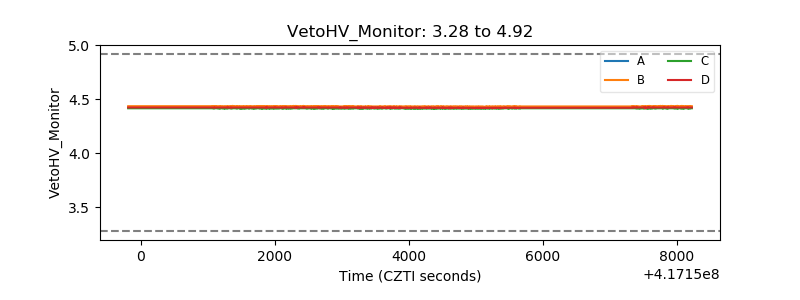 |
| Veto LLD | 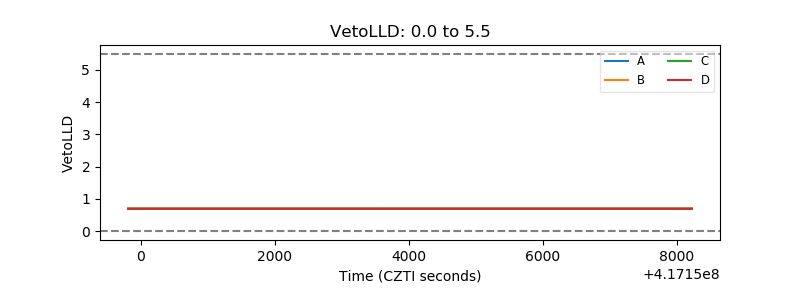 |
| Alpha Counter | 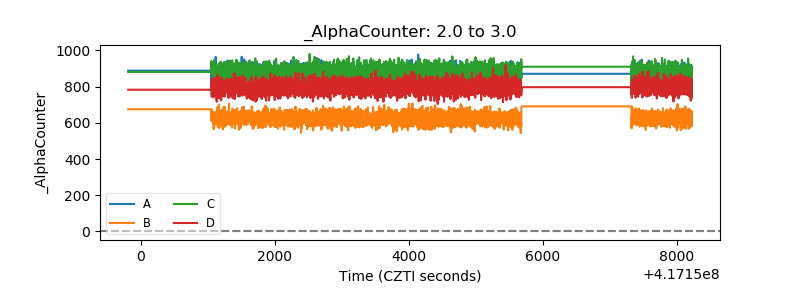 |
| _CPM_Rate | 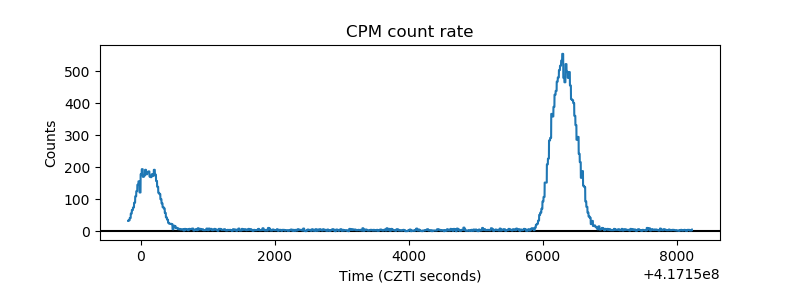 |
| CZT Counter | 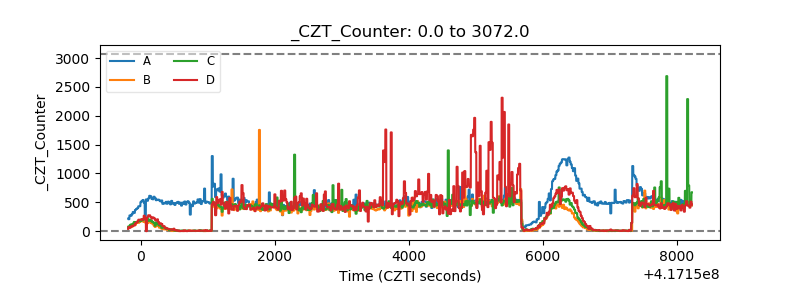 |
| +2.5 Volts monitor | 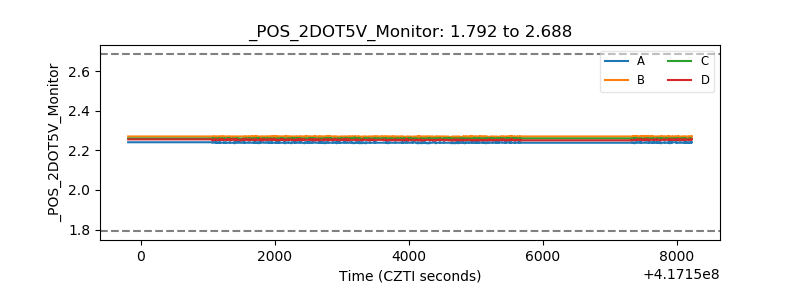 |
| +5 Volts monitor | 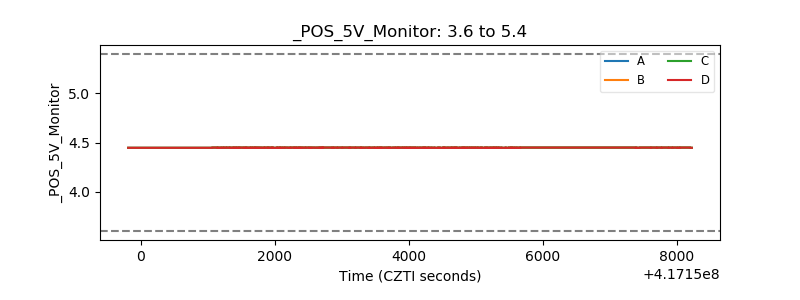 |
| _ROLL_ROT | 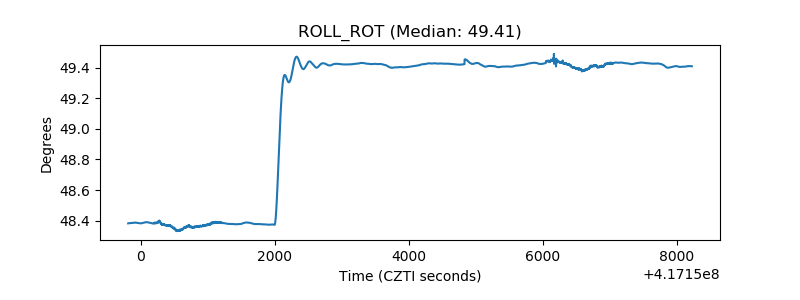 |
| _Roll_DEC | 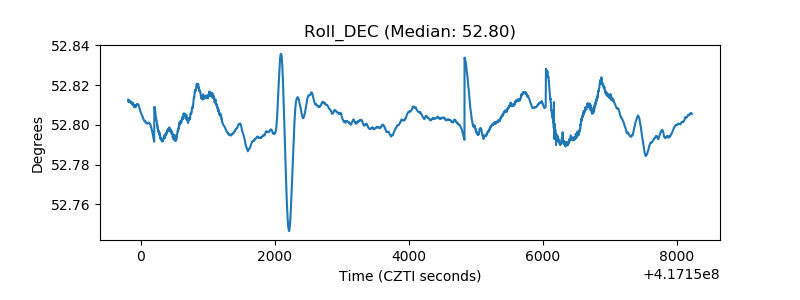 |
| _Roll_RA | 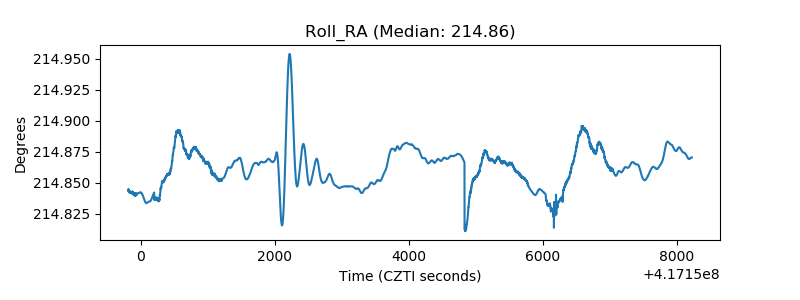 |
| Veto Counter | 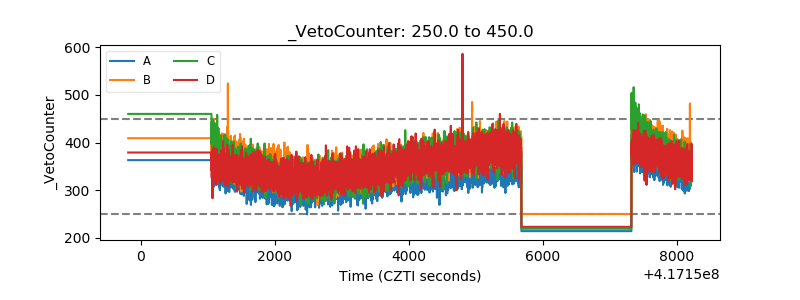 |