| Param | Original file | Final file |
|---|---|---|
| Filename | modeM0/AS1A12_022T01_9000005540_40443cztM0_level2.fits | modeM0/AS1A12_022T01_9000005540_40443cztM0_level2_quad_clean.evt |
| Size (bytes) | 314,717,760 | 89,605,440 |
| Size | 300.1 MB | 85.5 MB |
| Events in quadrant A | 2,854,322 | 605,043 |
| Events in quadrant B | 2,393,555 | 623,695 |
| Events in quadrant C | 2,871,285 | 588,789 |
| Events in quadrant D | 3,109,221 | 517,378 |
| Mode M0 | |||
|---|---|---|---|
| Quadrant | BADHDUFLAG | Total packets | Discarded packets |
| A | 0 | 11704 | 3 |
| B | 0 | 10859 | 2 |
| C | 0 | 11912 | 2 |
| D | 0 | 12733 | 2 |
| Mode M9 | |||
|---|---|---|---|
| Quadrant | BADHDUFLAG | Total packets | Discarded packets |
| A | 0 | 24 | 0 |
| B | 0 | 24 | 0 |
| C | 0 | 24 | 0 |
| D | 0 | 25 | 0 |
| Mode SS | |||
|---|---|---|---|
| Quadrant | BADHDUFLAG | Total packets | Discarded packets |
| A | 0 | 110 | 0 |
| B | 0 | 110 | 0 |
| C | 0 | 110 | 0 |
| D | 0 | 110 | 0 |
| Quadrant | Total seconds | Saturated seconds | Saturation percentage |
|---|---|---|---|
| A | 5404 | 10 | 0.185048% |
| B | 5404 | 7 | 0.129534% |
| C | 5404 | 43 | 0.795707% |
| D | 5404 | 296 | 5.477424% |
Noise dominated data is calculated using 1-second bins in cleaned event files. If a bin has >2000 counts, and if more than 50% of those come from <1% of pixels, then it is considered to be noise-dominated and hence unusable.
| Quadrant | # 1 sec bins | Bins with >0 counts | Bins with >2000 counts | High rate bins dominated by noise | Noise dominated (total time) | Noise dominated (detector-on time) | Marked lightcurve |
|---|---|---|---|---|---|---|---|
| A | 7167 | 5405 | 4 | 4 | 0.06% | 0.07% | 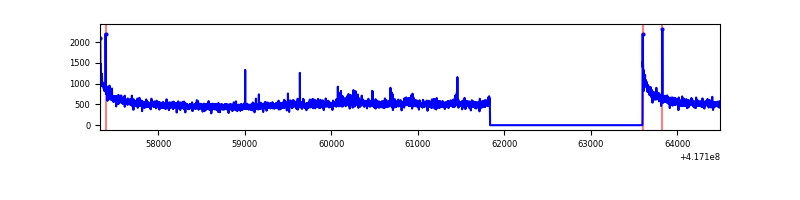 |
| B | 7167 | 5405 | 0 | 0 | 0.00% | 0.00% | 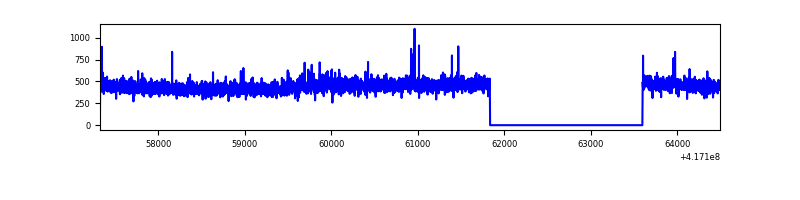 |
| C | 7167 | 5405 | 41 | 41 | 0.57% | 0.76% | 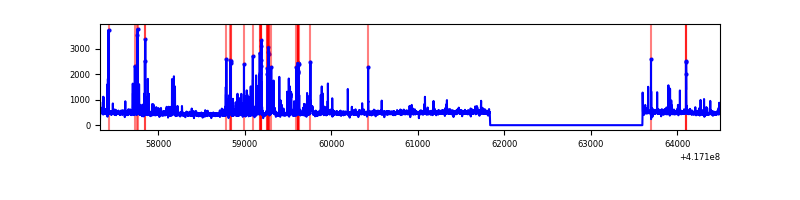 |
| D | 7167 | 5405 | 43 | 43 | 0.60% | 0.80% | 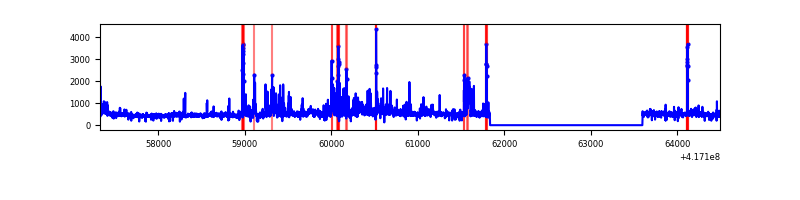 |
Top three noisy pixels from each quadrant. If the there are fewer than three noisy pixels in the level2.evt file, extra rows are filled as -1
| Pixel properties | Quadrant properties | ||||||
|---|---|---|---|---|---|---|---|
| Quadrant | DetID | PixID | Counts | Sigma | Mean | Median | Sigma |
| A | 10 | 83 | 466614 | 3825.05 | 595 | 583 | 121.8 |
| A | 15 | 191 | 52546 | 426.5 | 595 | 583 | 121.8 |
| A | 7 | 3 | 12439 | 97.31 | 595 | 583 | 121.8 |
| B | 4 | 170 | 32843 | 281.43 | 590 | 574 | 114.7 |
| B | 3 | 112 | 24590 | 209.45 | 590 | 574 | 114.7 |
| B | 12 | 111 | 14420 | 120.75 | 590 | 574 | 114.7 |
| C | 14 | 254 | 379509 | 2845.57 | 573 | 577 | 133.2 |
| C | 15 | 214 | 236540 | 1771.95 | 573 | 577 | 133.2 |
| C | 3 | 233 | 6428 | 43.94 | 573 | 577 | 133.2 |
| D | 12 | 227 | 598031 | 4303.68 | 558 | 543 | 138.8 |
| D | 12 | 191 | 131328 | 942.04 | 558 | 543 | 138.8 |
| D | 2 | 250 | 83121 | 594.81 | 558 | 543 | 138.8 |
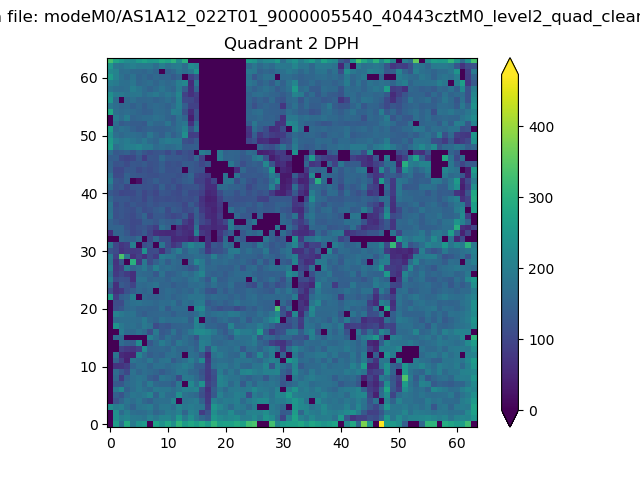
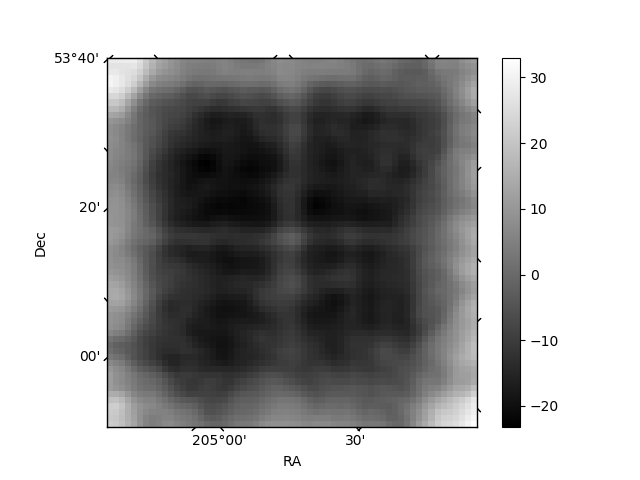
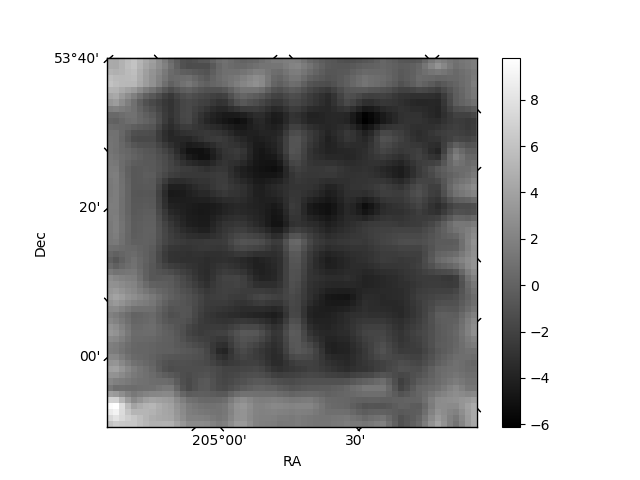
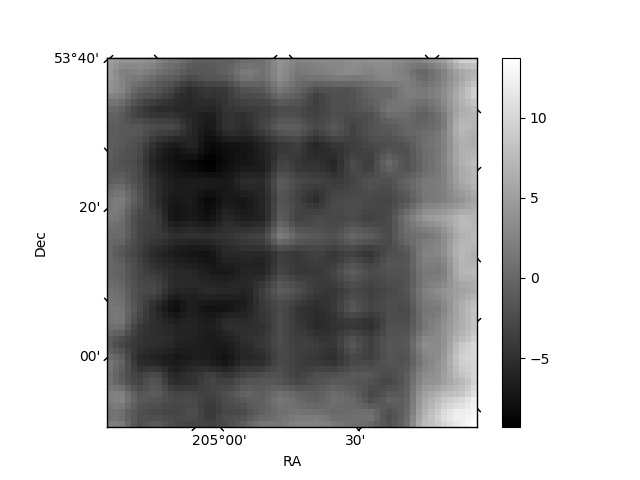
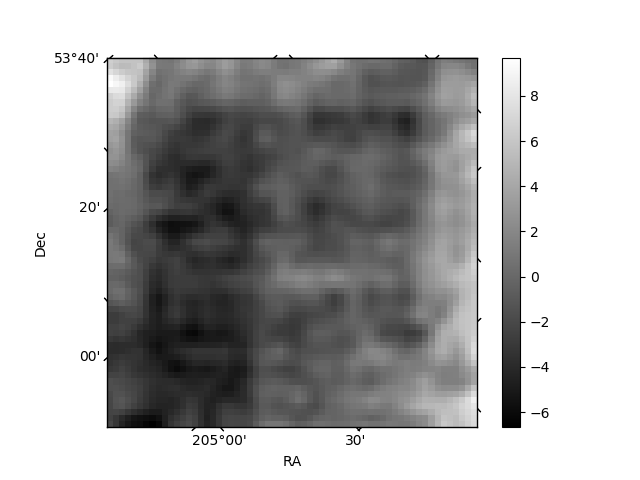
Histogram calculated using DETX and DETY for each event in the final _common_clean file
| Quadrant A | 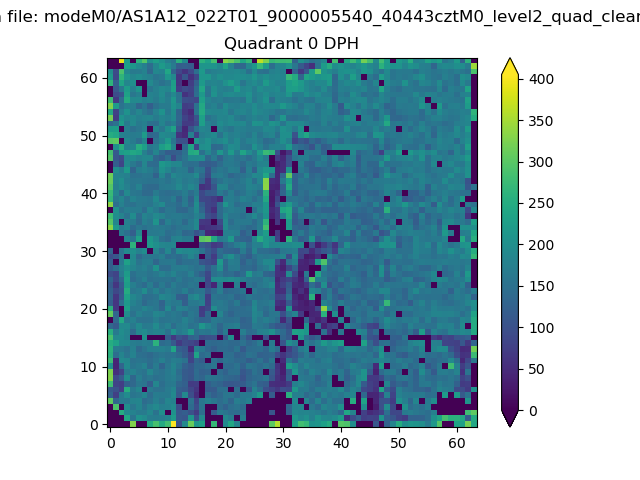 |
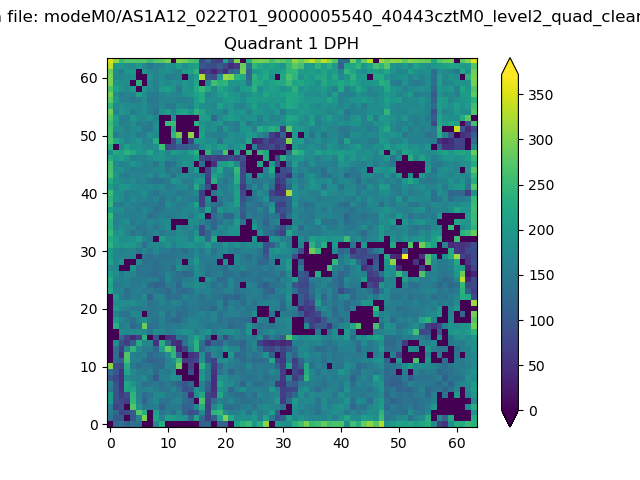 |
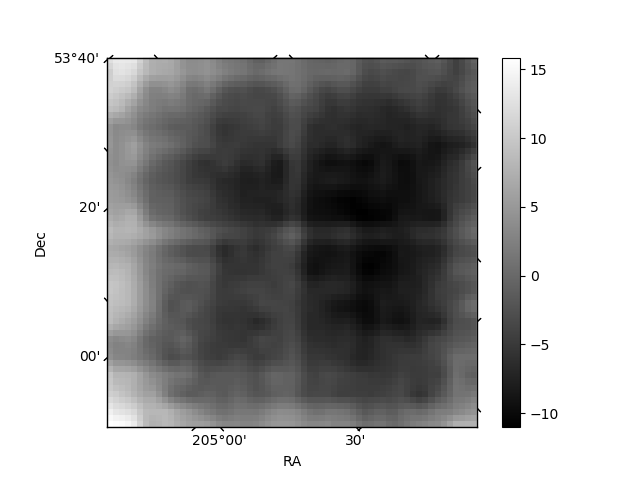
Quadrant B |
|---|---|---|---|
| Quadrant D | 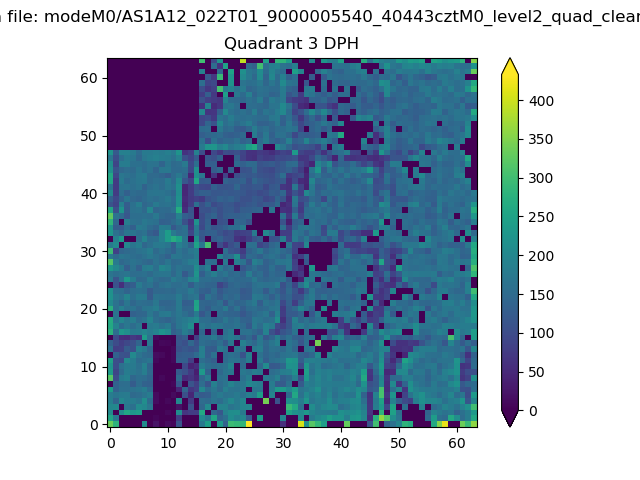 |
 |
Quadrant C |
| Plot type | Count rate plots | Images |
|---|---|---|
| Comparison with Poisson distribution Blue bars denote a histogram of data divided into 1 sec bins. Red curve is a Poisson curve with rate = median count rate of data. |
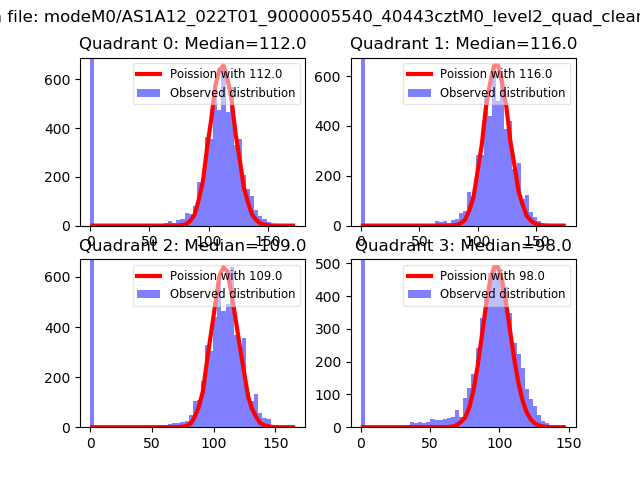 |
 |
| Quadrant-wise count rates Data is divided into 100 sec bins |
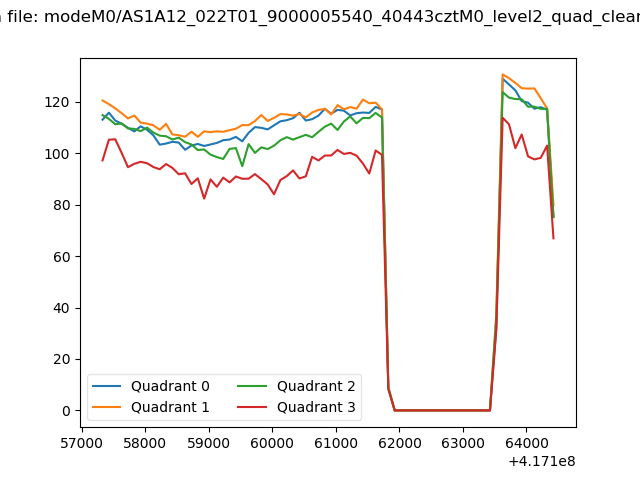 |
|
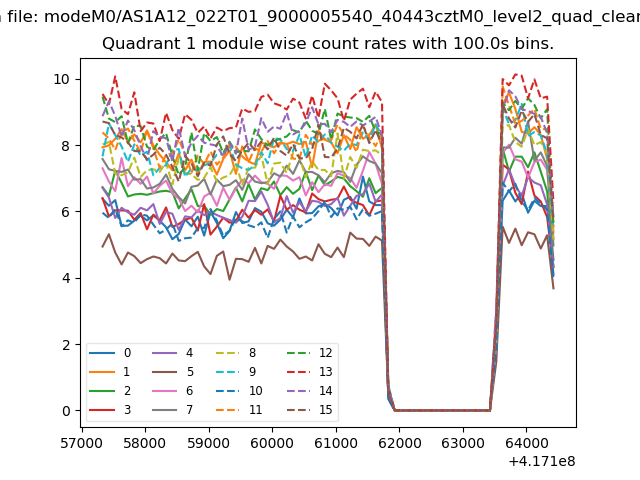
| Module-wise count rates for Quadrant A Data is divided into 100 sec bins |
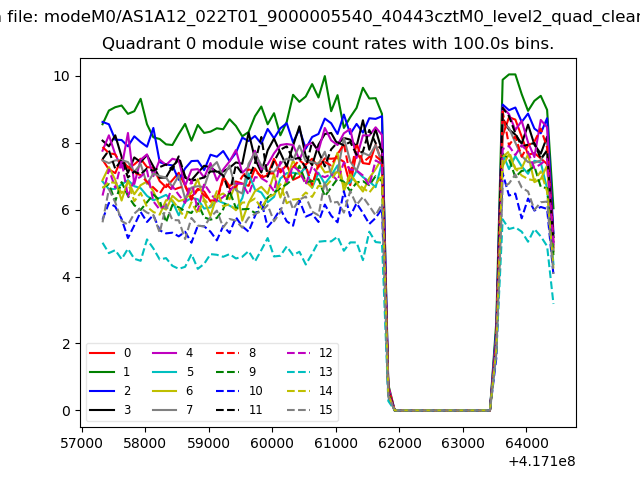 |
 |
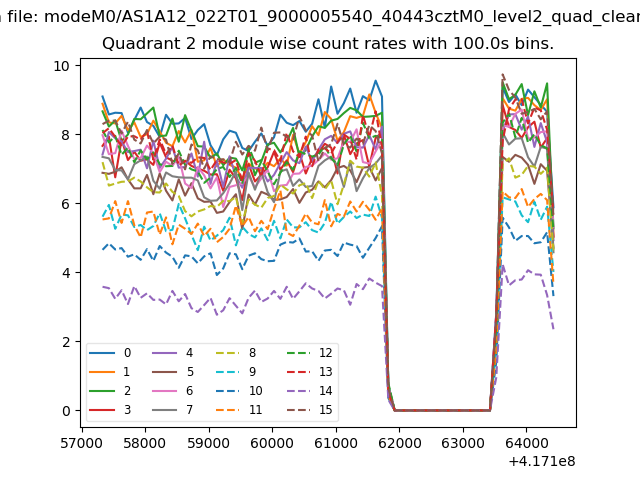
| Module-wise count rates for Quadrant B Data is divided into 100 sec bins |
 |
 |
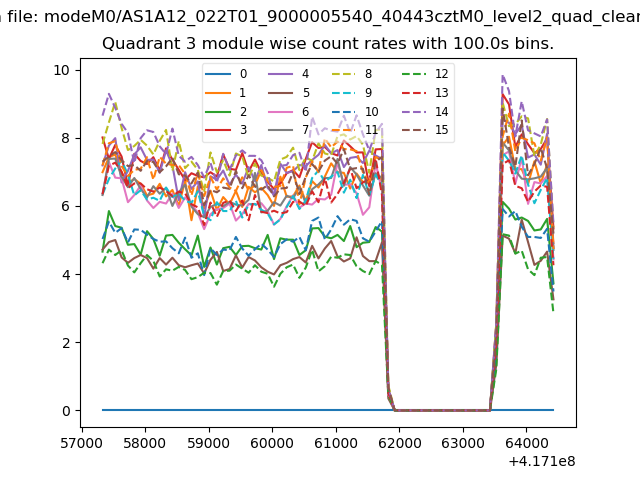
| Module-wise count rates for Quadrant C Data is divided into 100 sec bins |
 |
 |
| Module-wise count rates for Quadrant D Data is divided into 100 sec bins |
 |
 |
| Parameter | Plot |
|---|---|
| CZT HV Monitor | 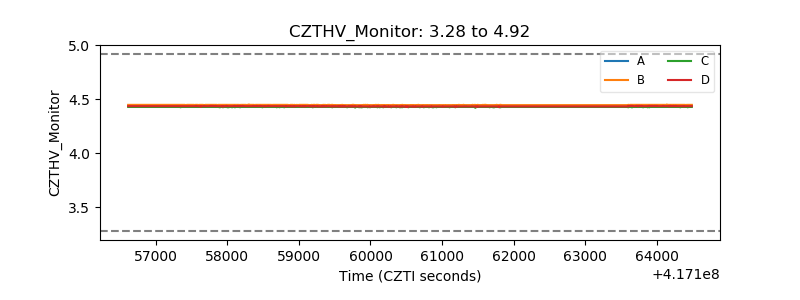 |
| D_VDD | 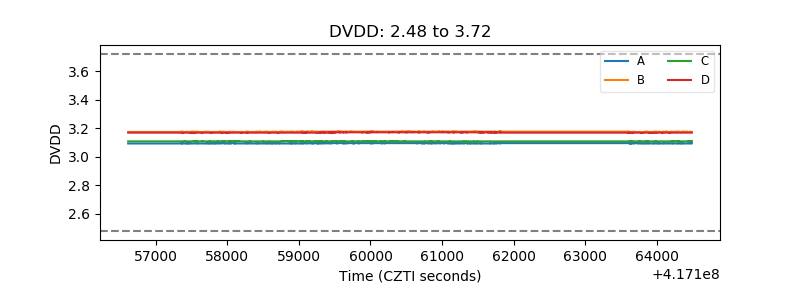 |
| Temperature 1 | 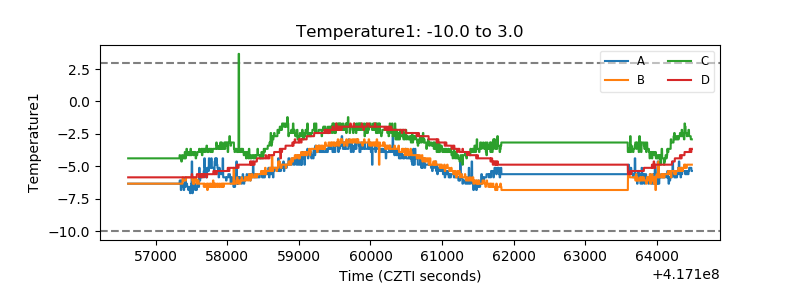 |
| Veto HV Monitor | 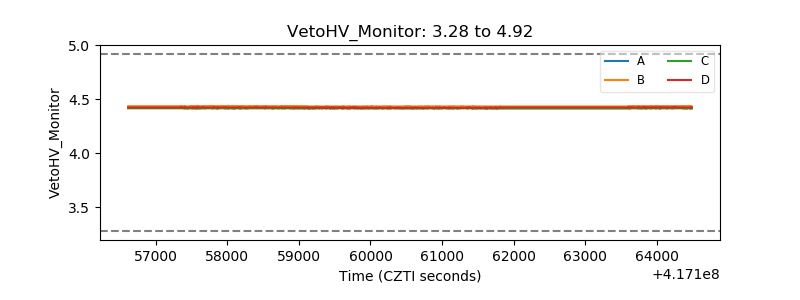 |
| Veto LLD | 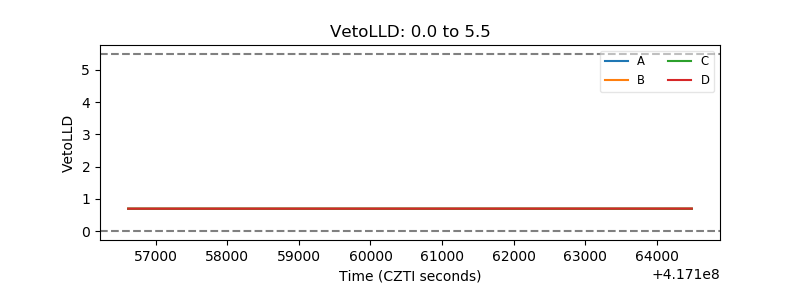 |
| Alpha Counter | 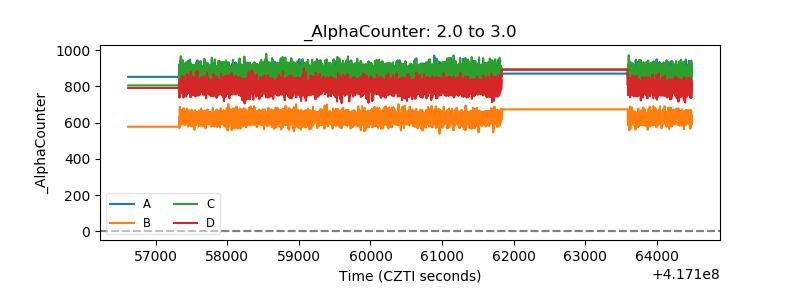 |
| _CPM_Rate | 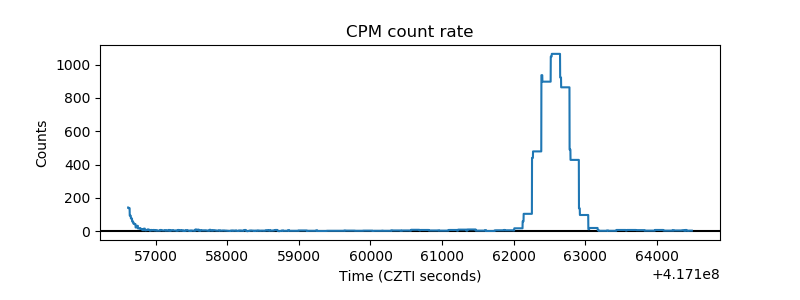 |
| CZT Counter | 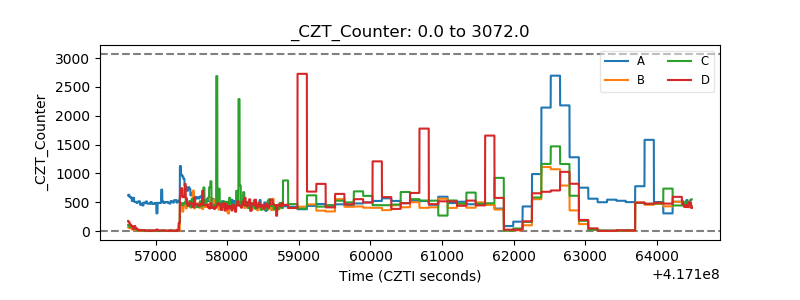 |
| +2.5 Volts monitor | 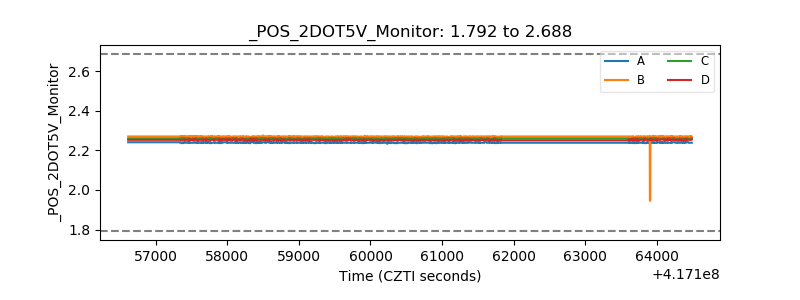 |
| +5 Volts monitor | 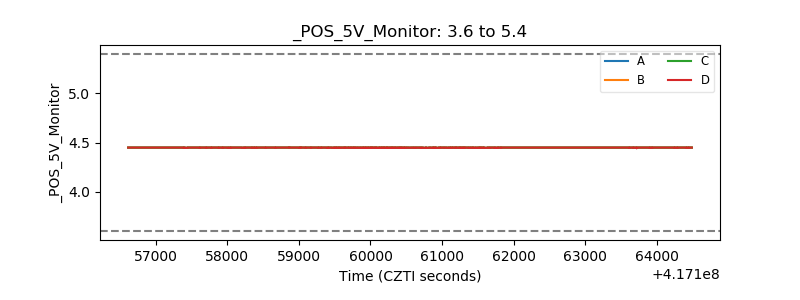 |
| _ROLL_ROT | 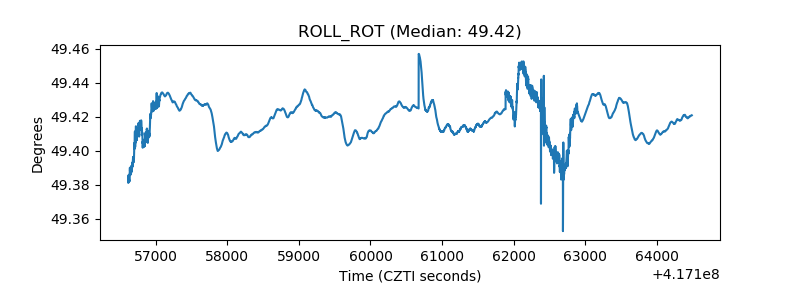 |
| _Roll_DEC | 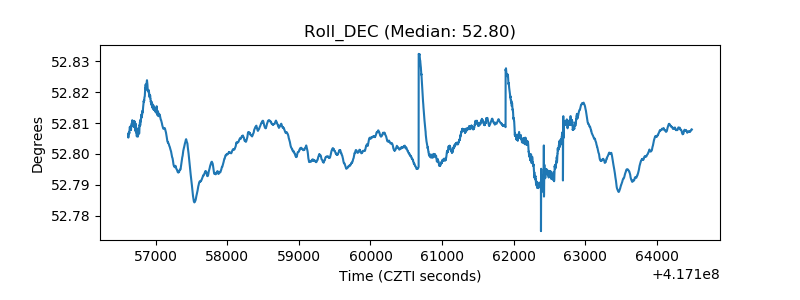 |
| _Roll_RA | 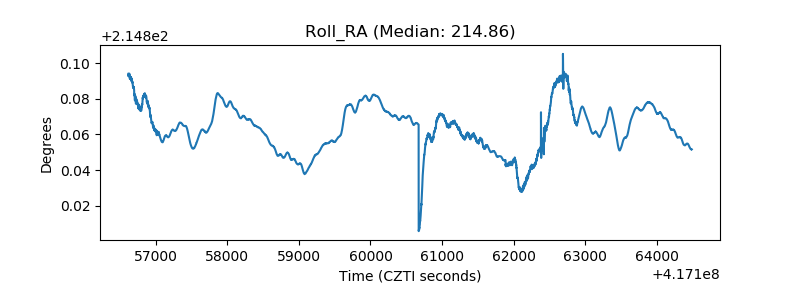 |
| Veto Counter | 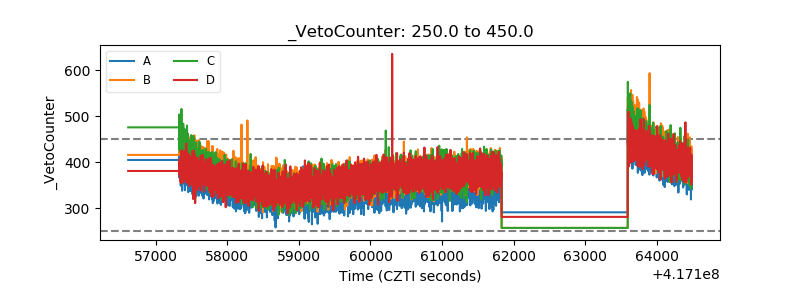 |