| Param | Original file | Final file |
|---|---|---|
| Filename | modeM0/AS1A12_022T01_9000005540_40444cztM0_level2.fits | modeM0/AS1A12_022T01_9000005540_40444cztM0_level2_quad_clean.evt |
| Size (bytes) | 309,430,080 | 88,493,760 |
| Size | 295.1 MB | 84.4 MB |
| Events in quadrant A | 2,737,317 | 609,833 |
| Events in quadrant B | 2,442,612 | 625,846 |
| Events in quadrant C | 2,568,144 | 587,250 |
| Events in quadrant D | 3,305,019 | 496,525 |
| Mode M0 | |||
|---|---|---|---|
| Quadrant | BADHDUFLAG | Total packets | Discarded packets |
| A | 0 | 11206 | 3 |
| B | 0 | 10562 | 2 |
| C | 0 | 10751 | 2 |
| D | 0 | 13063 | 2 |
| Mode M9 | |||
|---|---|---|---|
| Quadrant | BADHDUFLAG | Total packets | Discarded packets |
| A | 0 | 24 | 0 |
| B | 0 | 24 | 0 |
| C | 0 | 24 | 0 |
| D | 0 | 25 | 0 |
| Mode SS | |||
|---|---|---|---|
| Quadrant | BADHDUFLAG | Total packets | Discarded packets |
| A | 0 | 106 | 0 |
| B | 0 | 106 | 0 |
| C | 0 | 106 | 0 |
| D | 0 | 106 | 0 |
| Quadrant | Total seconds | Saturated seconds | Saturation percentage |
|---|---|---|---|
| A | 5137 | 14 | 0.272533% |
| B | 5137 | 20 | 0.389332% |
| C | 5137 | 15 | 0.291999% |
| D | 5137 | 492 | 9.577574% |
Noise dominated data is calculated using 1-second bins in cleaned event files. If a bin has >2000 counts, and if more than 50% of those come from <1% of pixels, then it is considered to be noise-dominated and hence unusable.
| Quadrant | # 1 sec bins | Bins with >0 counts | Bins with >2000 counts | High rate bins dominated by noise | Noise dominated (total time) | Noise dominated (detector-on time) | Marked lightcurve |
|---|---|---|---|---|---|---|---|
| A | 7050 | 5138 | 4 | 4 | 0.06% | 0.08% | 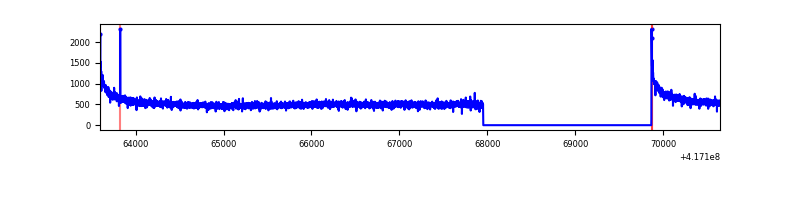 |
| B | 7050 | 5138 | 8 | 8 | 0.11% | 0.16% | 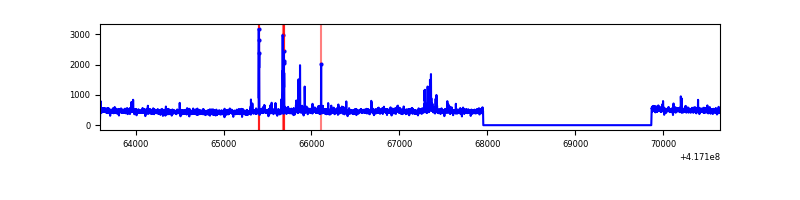 |
| C | 7050 | 5138 | 15 | 15 | 0.21% | 0.29% | 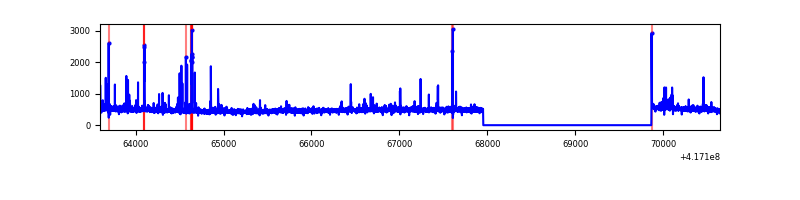 |
| D | 7050 | 5138 | 186 | 186 | 2.64% | 3.62% | 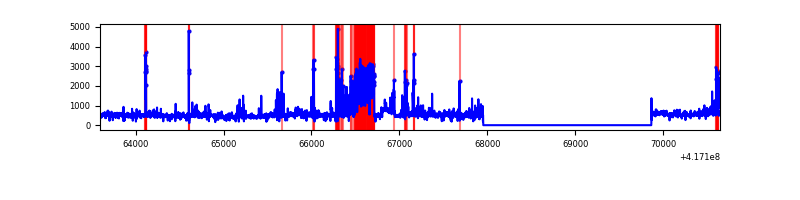 |
Top three noisy pixels from each quadrant. If the there are fewer than three noisy pixels in the level2.evt file, extra rows are filled as -1
| Pixel properties | Quadrant properties | ||||||
|---|---|---|---|---|---|---|---|
| Quadrant | DetID | PixID | Counts | Sigma | Mean | Median | Sigma |
| A | 10 | 83 | 456937 | 3804.7 | 586 | 576 | 119.9 |
| A | 7 | 3 | 8910 | 69.48 | 586 | 576 | 119.9 |
| A | 3 | 137 | 6250 | 47.3 | 586 | 576 | 119.9 |
| B | 4 | 170 | 96299 | 864.8 | 578 | 563 | 110.7 |
| B | 0 | 245 | 31790 | 282.08 | 578 | 563 | 110.7 |
| B | 3 | 112 | 31605 | 280.41 | 578 | 563 | 110.7 |
| C | 15 | 214 | 226609 | 1742.93 | 561 | 565 | 129.7 |
| C | 14 | 254 | 123068 | 944.57 | 561 | 565 | 129.7 |
| C | 0 | 10 | 10149 | 73.9 | 561 | 565 | 129.7 |
| D | 12 | 227 | 880954 | 6637.35 | 541 | 526 | 132.6 |
| D | 12 | 191 | 129321 | 970.96 | 541 | 526 | 132.6 |
| D | 9 | 19 | 85656 | 641.78 | 541 | 526 | 132.6 |
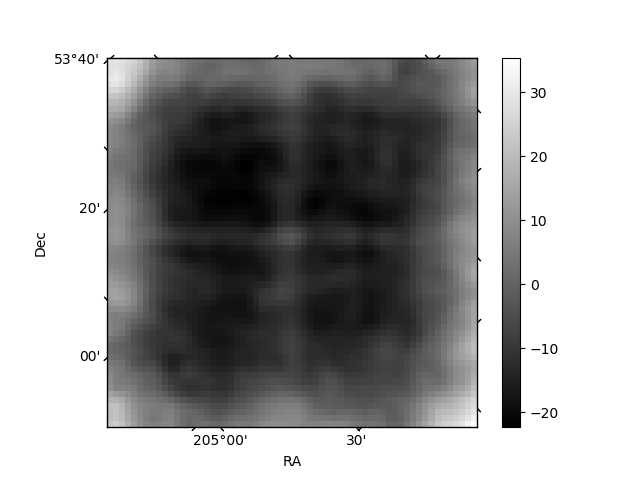
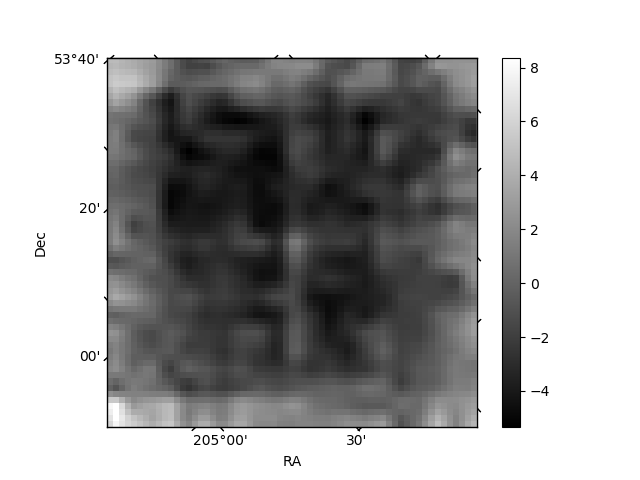
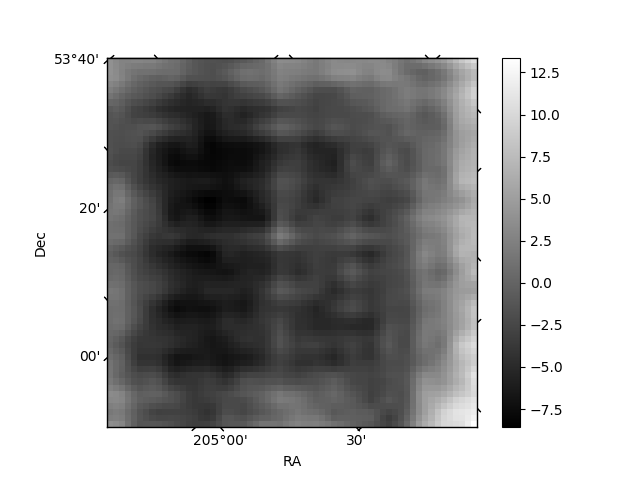
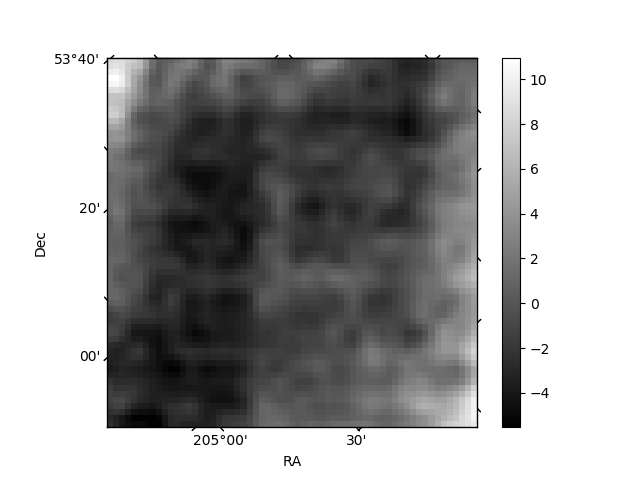
Histogram calculated using DETX and DETY for each event in the final _common_clean file
| Quadrant A | 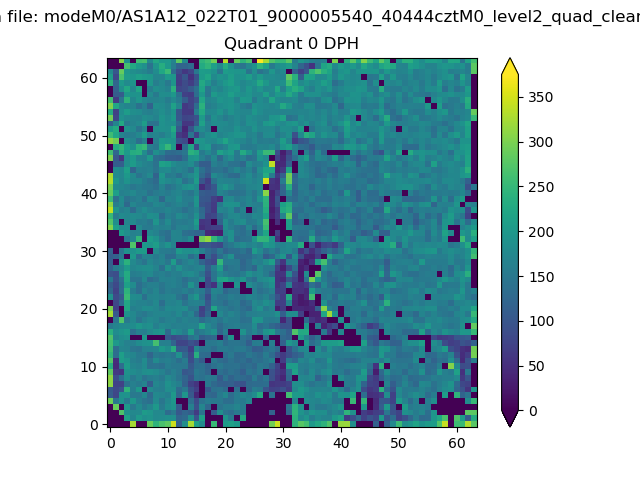 |
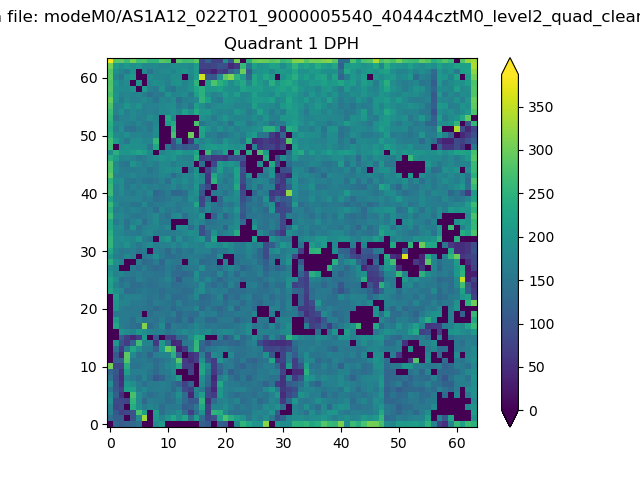 |
Quadrant B |
|---|---|---|---|
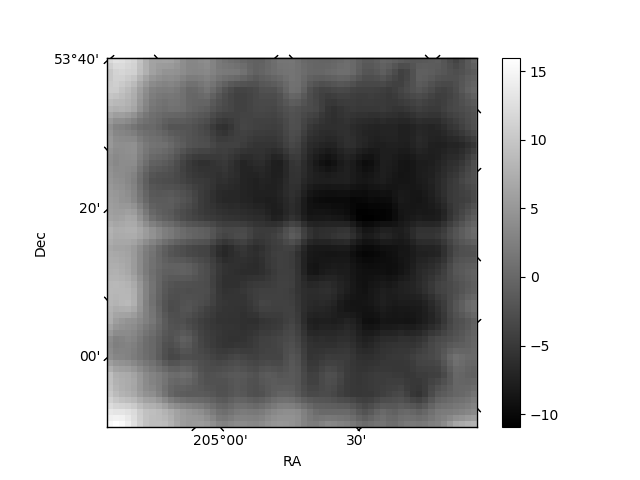
| Quadrant D | 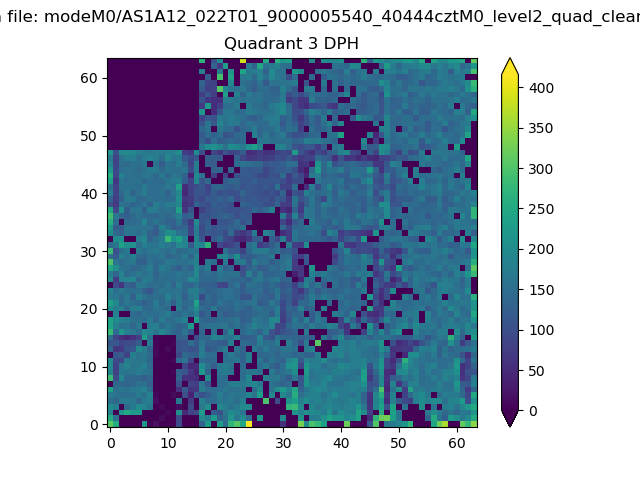 |
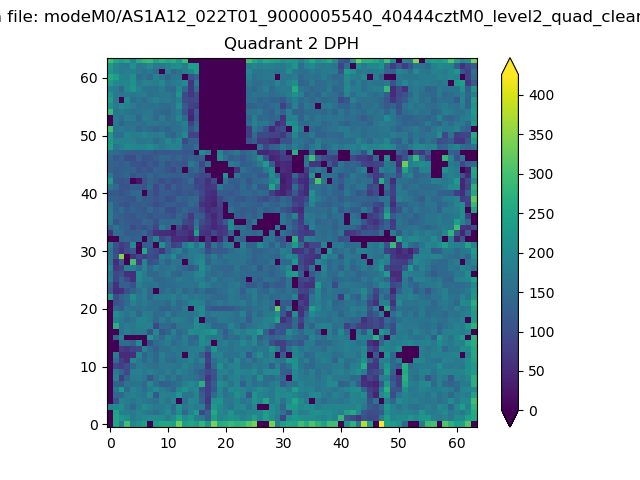 |
Quadrant C |
| Plot type | Count rate plots | Images |
|---|---|---|
| Comparison with Poisson distribution Blue bars denote a histogram of data divided into 1 sec bins. Red curve is a Poisson curve with rate = median count rate of data. |
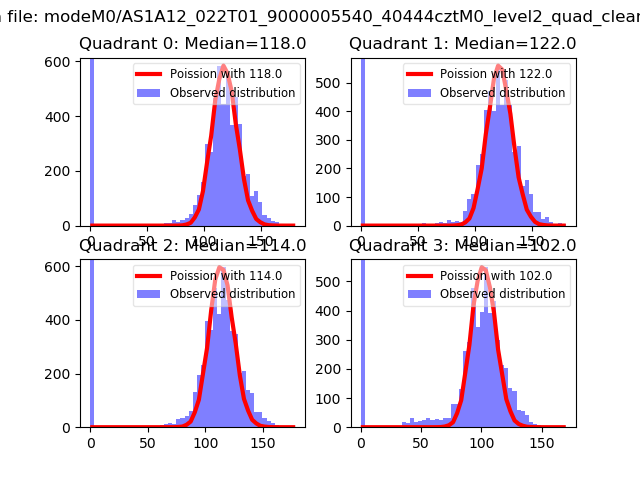 |
 |
| Quadrant-wise count rates Data is divided into 100 sec bins |
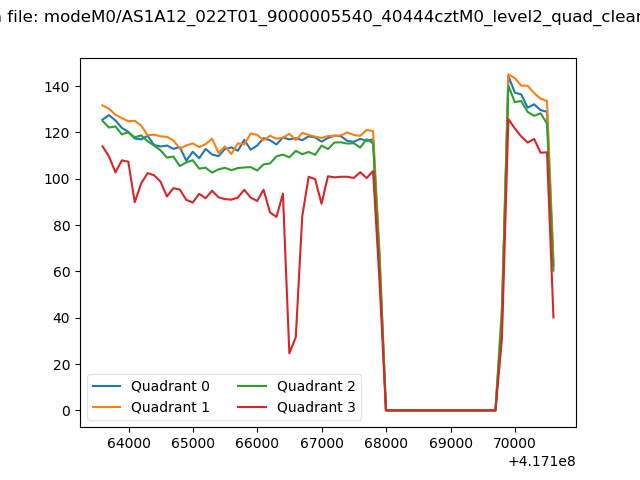 |
|
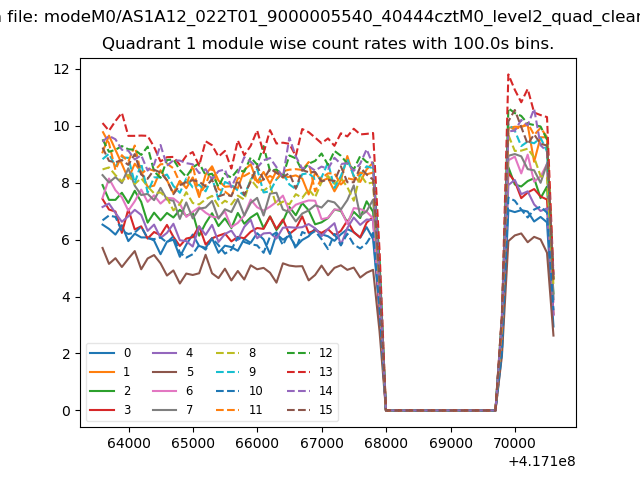
| Module-wise count rates for Quadrant A Data is divided into 100 sec bins |
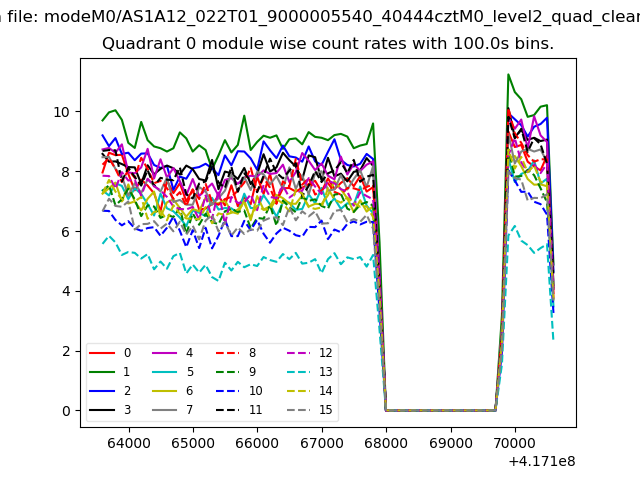 |
 |
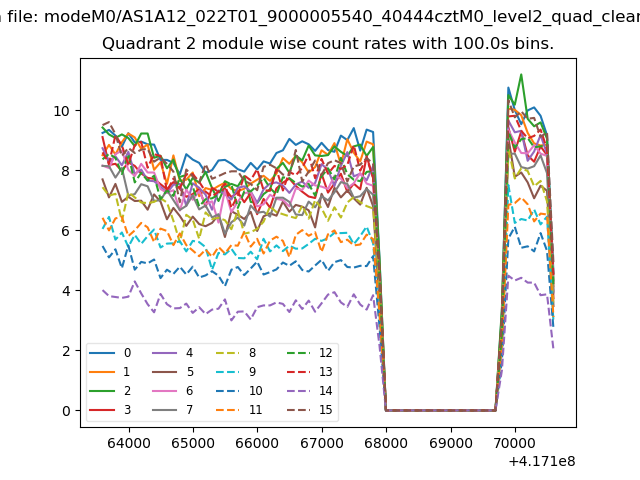
| Module-wise count rates for Quadrant B Data is divided into 100 sec bins |
 |
 |
| Module-wise count rates for Quadrant C Data is divided into 100 sec bins |
 |
 |
| Module-wise count rates for Quadrant D Data is divided into 100 sec bins |
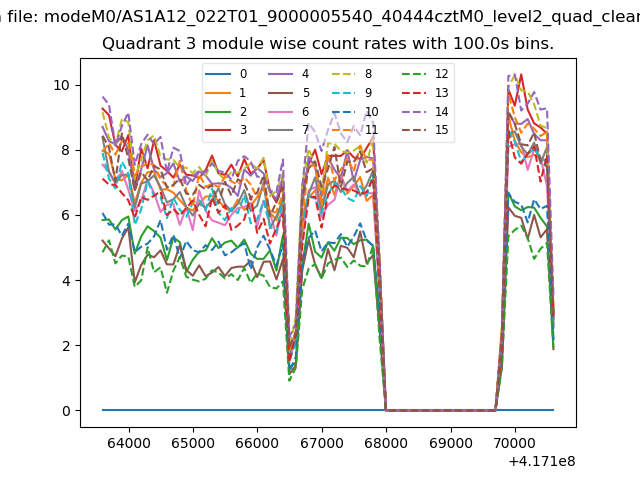 |
 |
| Parameter | Plot |
|---|---|
| CZT HV Monitor | 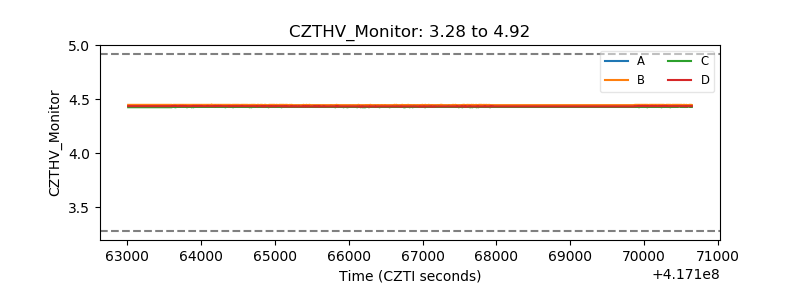 |
| D_VDD | 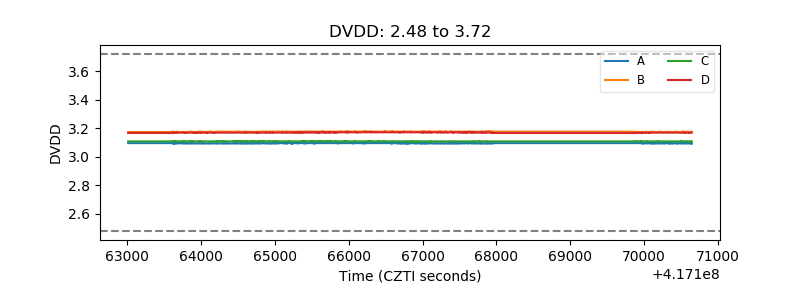 |
| Temperature 1 | 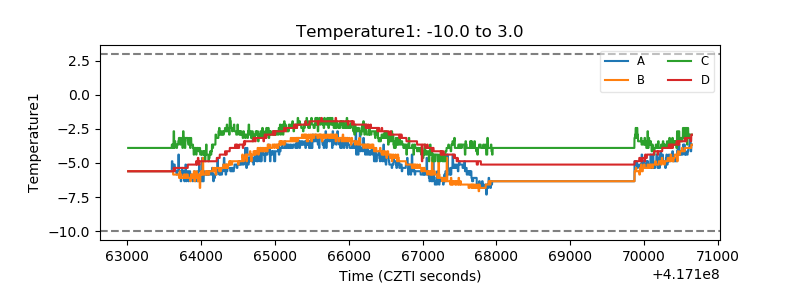 |
| Veto HV Monitor | 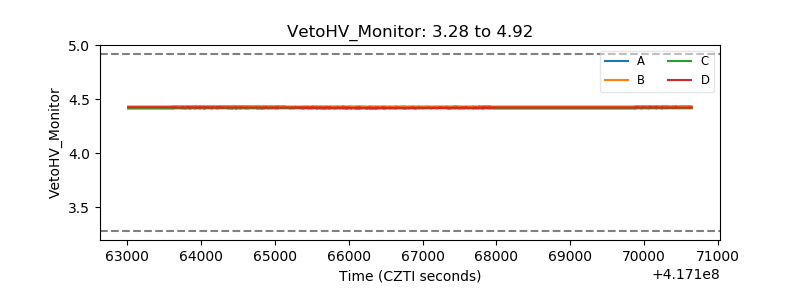 |
| Veto LLD | 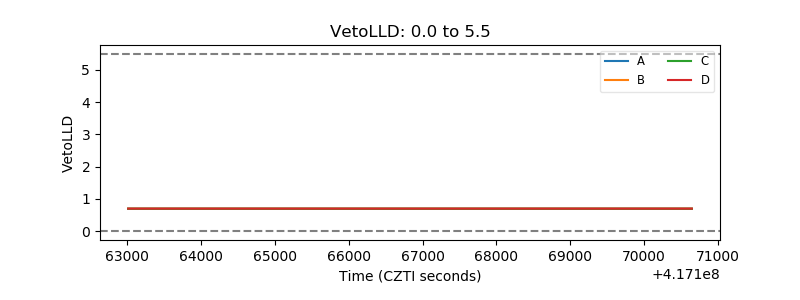 |
| Alpha Counter | 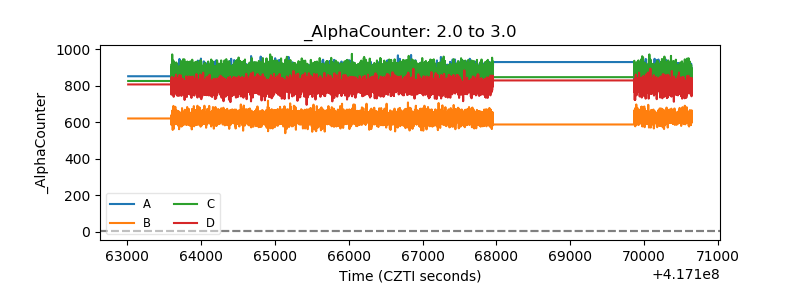 |
| _CPM_Rate | 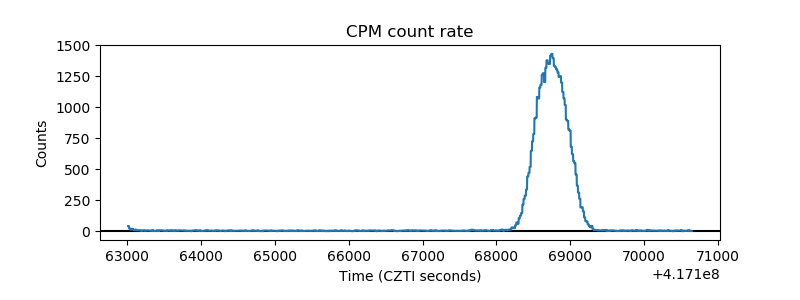 |
| CZT Counter | 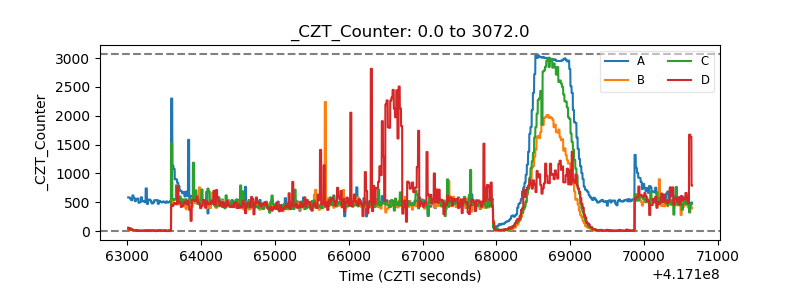 |
| +2.5 Volts monitor | 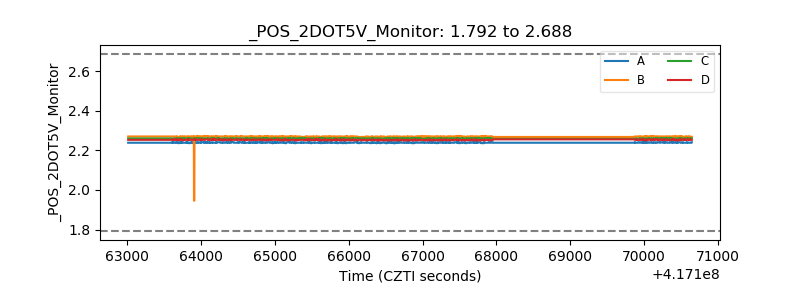 |
| +5 Volts monitor | 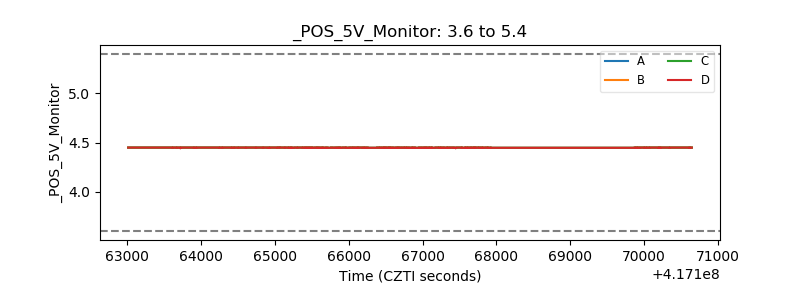 |
| _ROLL_ROT | 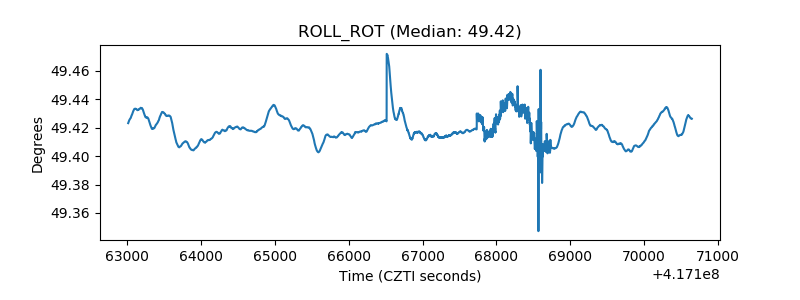 |
| _Roll_DEC | 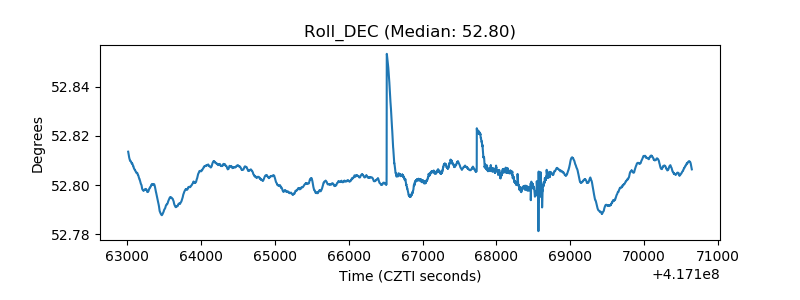 |
| _Roll_RA | 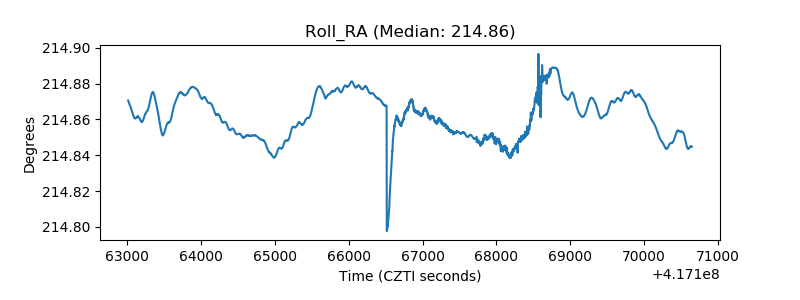 |
| Veto Counter | 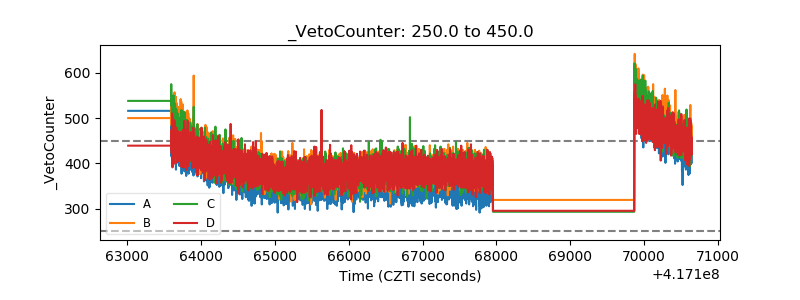 |