| Param | Original file | Final file |
|---|---|---|
| Filename | modeM0/AS1A12_022T01_9000005540_40445cztM0_level2.fits | modeM0/AS1A12_022T01_9000005540_40445cztM0_level2_quad_clean.evt |
| Size (bytes) | 311,371,200 | 95,705,280 |
| Size | 296.9 MB | 91.3 MB |
| Events in quadrant A | 2,911,193 | 665,875 |
| Events in quadrant B | 2,495,434 | 681,231 |
| Events in quadrant C | 2,846,997 | 630,256 |
| Events in quadrant D | 2,863,935 | 554,383 |
| Mode M0 | |||
|---|---|---|---|
| Quadrant | BADHDUFLAG | Total packets | Discarded packets |
| A | 0 | 11716 | 3 |
| B | 0 | 10608 | 2 |
| C | 0 | 11549 | 2 |
| D | 0 | 11742 | 2 |
| Mode M9 | |||
|---|---|---|---|
| Quadrant | BADHDUFLAG | Total packets | Discarded packets |
| A | 0 | 27 | 0 |
| B | 0 | 27 | 0 |
| C | 0 | 27 | 0 |
| D | 0 | 28 | 0 |
| Mode SS | |||
|---|---|---|---|
| Quadrant | BADHDUFLAG | Total packets | Discarded packets |
| A | 0 | 106 | 0 |
| B | 0 | 106 | 0 |
| C | 0 | 106 | 0 |
| D | 0 | 106 | 0 |
| Quadrant | Total seconds | Saturated seconds | Saturation percentage |
|---|---|---|---|
| A | 5235 | 11 | 0.210124% |
| B | 5235 | 3 | 0.057307% |
| C | 5235 | 41 | 0.783190% |
| D | 5235 | 310 | 5.921681% |
Noise dominated data is calculated using 1-second bins in cleaned event files. If a bin has >2000 counts, and if more than 50% of those come from <1% of pixels, then it is considered to be noise-dominated and hence unusable.
| Quadrant | # 1 sec bins | Bins with >0 counts | Bins with >2000 counts | High rate bins dominated by noise | Noise dominated (total time) | Noise dominated (detector-on time) | Marked lightcurve |
|---|---|---|---|---|---|---|---|
| A | 7268 | 5236 | 3 | 3 | 0.04% | 0.06% | 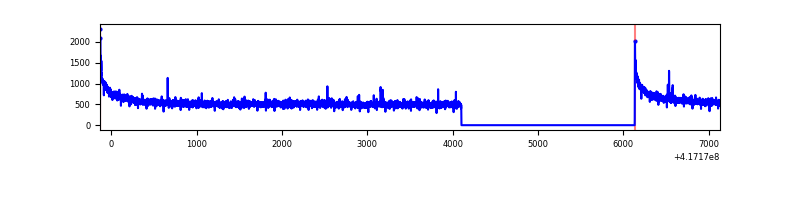 |
| B | 7268 | 5236 | 0 | 0 | 0.00% | 0.00% | 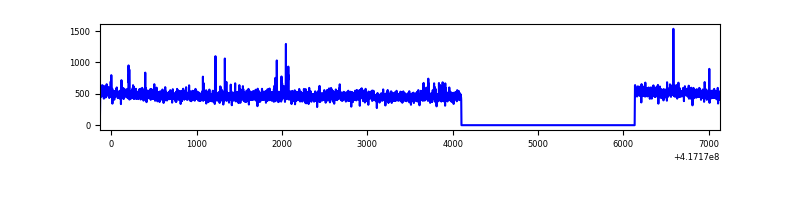 |
| C | 7268 | 5236 | 30 | 30 | 0.41% | 0.57% | 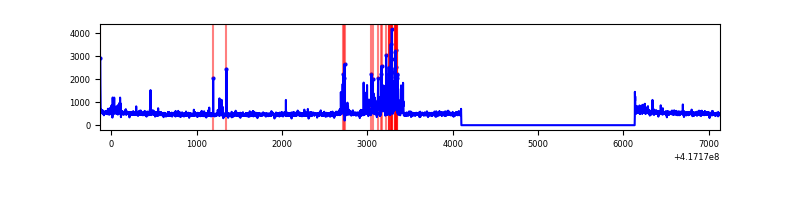 |
| D | 7268 | 5236 | 22 | 22 | 0.30% | 0.42% | 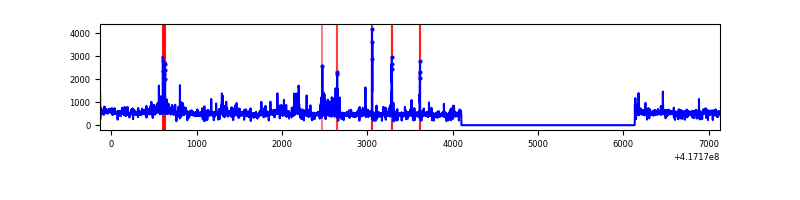 |
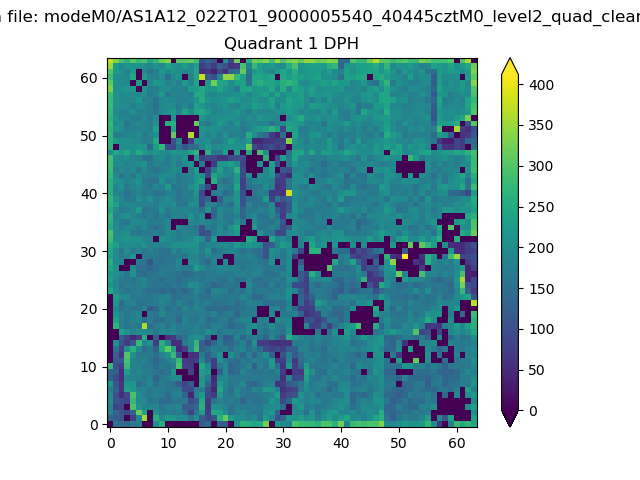
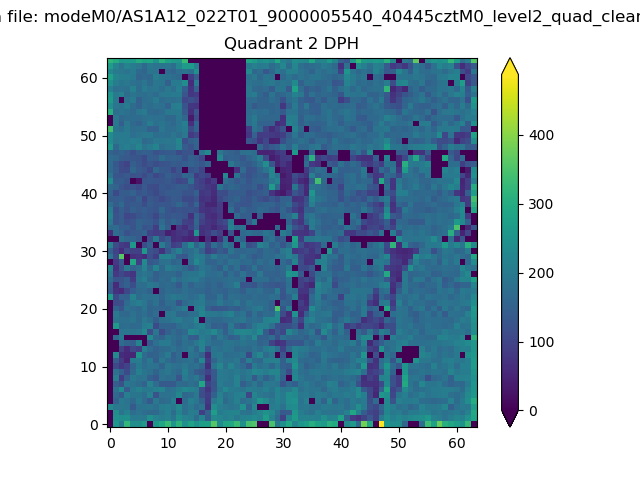
Top three noisy pixels from each quadrant. If the there are fewer than three noisy pixels in the level2.evt file, extra rows are filled as -1
| Pixel properties | Quadrant properties | ||||||
|---|---|---|---|---|---|---|---|
| Quadrant | DetID | PixID | Counts | Sigma | Mean | Median | Sigma |
| A | 10 | 83 | 471034 | 3728.67 | 623 | 614 | 126.2 |
| A | 7 | 3 | 15335 | 116.68 | 623 | 614 | 126.2 |
| A | 3 | 1 | 12168 | 91.58 | 623 | 614 | 126.2 |
| B | 3 | 112 | 37577 | 313.22 | 613 | 597 | 118.1 |
| B | 4 | 170 | 22611 | 186.46 | 613 | 597 | 118.1 |
| B | 0 | 230 | 22557 | 186.0 | 613 | 597 | 118.1 |
| C | 14 | 254 | 280377 | 2061.37 | 595 | 599 | 135.7 |
| C | 15 | 214 | 230027 | 1690.4 | 595 | 599 | 135.7 |
| C | 0 | 10 | 10817 | 75.28 | 595 | 599 | 135.7 |
| D | 12 | 227 | 258238 | 1837.25 | 579 | 565 | 140.2 |
| D | 12 | 191 | 142865 | 1014.62 | 579 | 565 | 140.2 |
| D | 13 | 249 | 97260 | 689.45 | 579 | 565 | 140.2 |
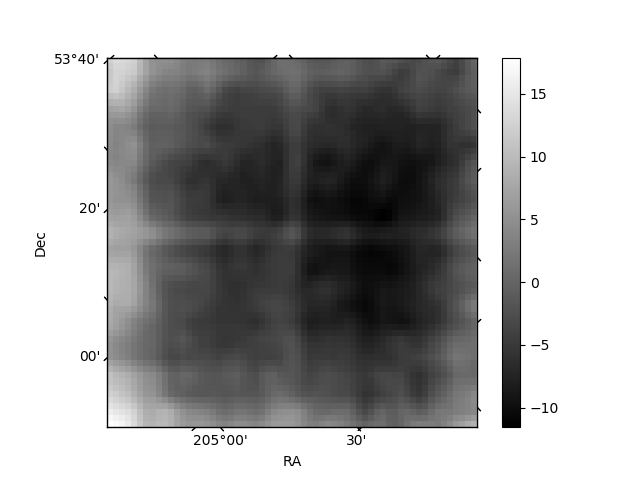
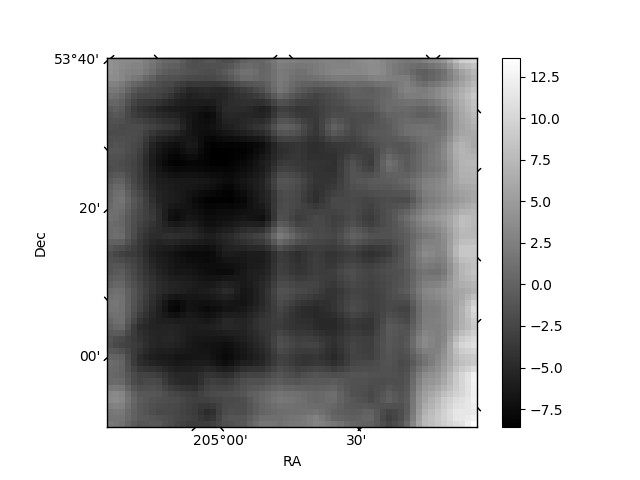
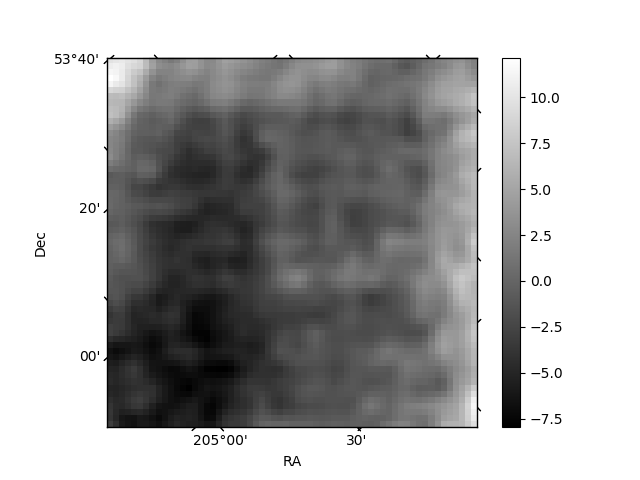
Histogram calculated using DETX and DETY for each event in the final _common_clean file
| Quadrant A | 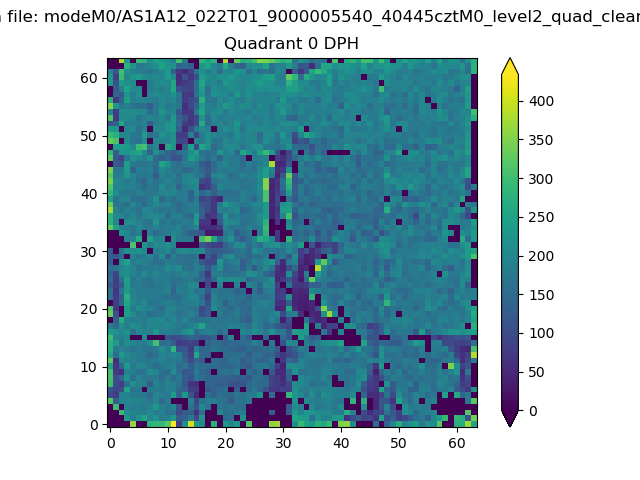 |
 |
Quadrant B |
|---|---|---|---|
| Quadrant D | 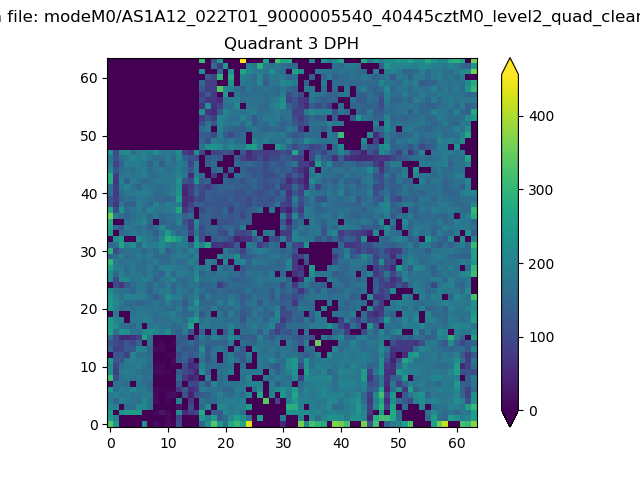 |
 |
Quadrant C |
| Plot type | Count rate plots | Images |
|---|---|---|
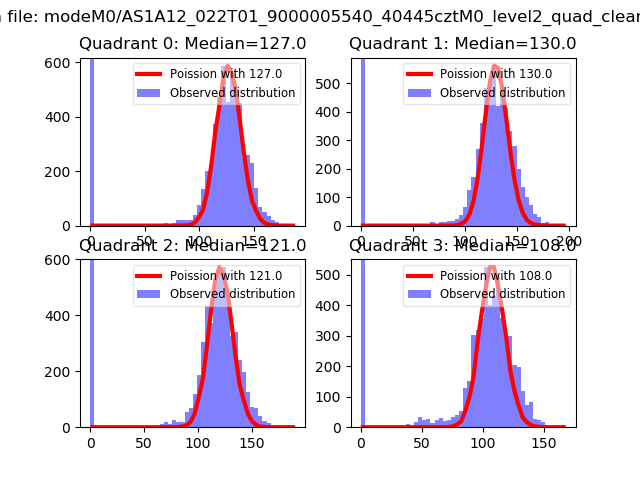
| Comparison with Poisson distribution Blue bars denote a histogram of data divided into 1 sec bins. Red curve is a Poisson curve with rate = median count rate of data. |
 |
 |
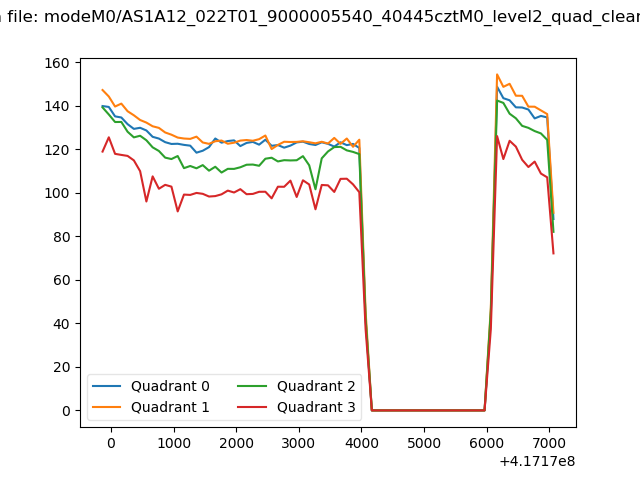
| Quadrant-wise count rates Data is divided into 100 sec bins |
 |
|
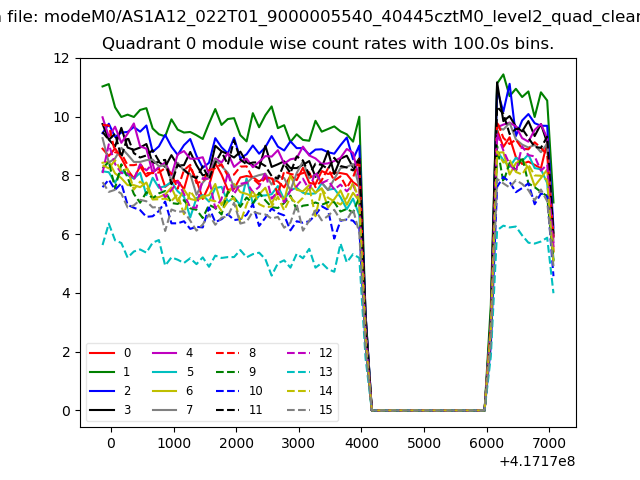
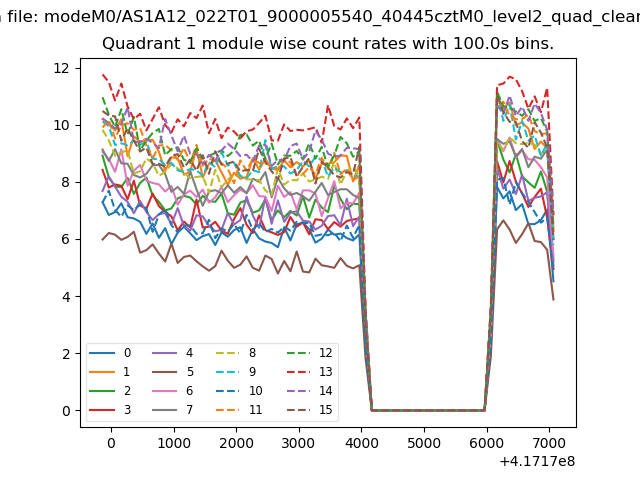
| Module-wise count rates for Quadrant A Data is divided into 100 sec bins |
 |
 |
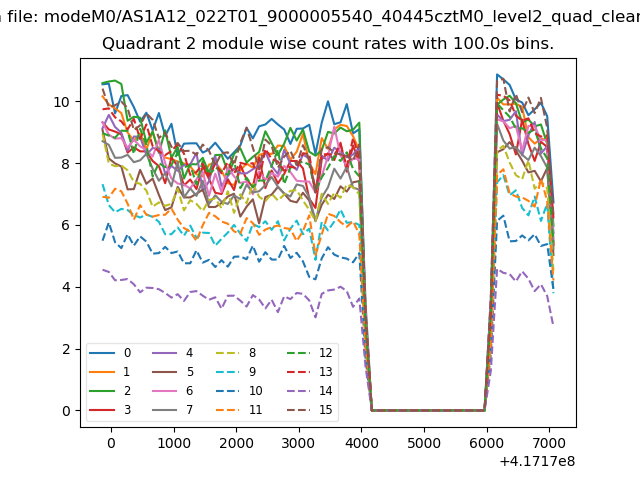
| Module-wise count rates for Quadrant B Data is divided into 100 sec bins |
 |
 |
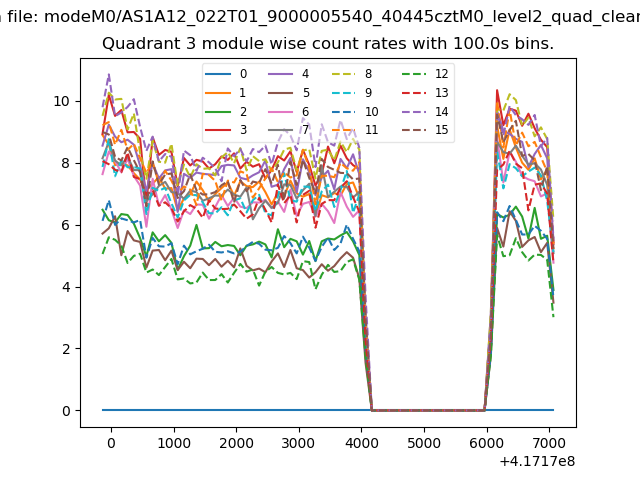
| Module-wise count rates for Quadrant C Data is divided into 100 sec bins |
 |
 |
| Module-wise count rates for Quadrant D Data is divided into 100 sec bins |
 |
 |
| Parameter | Plot |
|---|---|
| CZT HV Monitor | 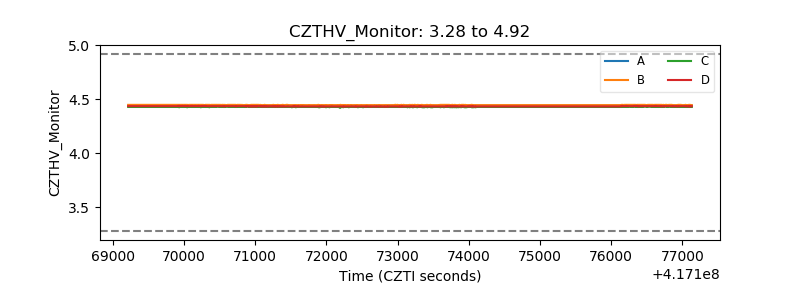 |
| D_VDD | 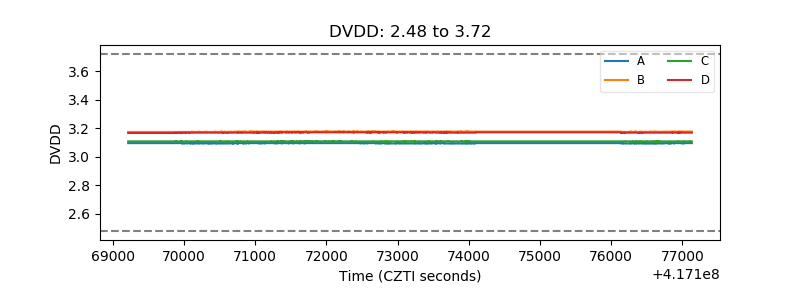 |
| Temperature 1 | 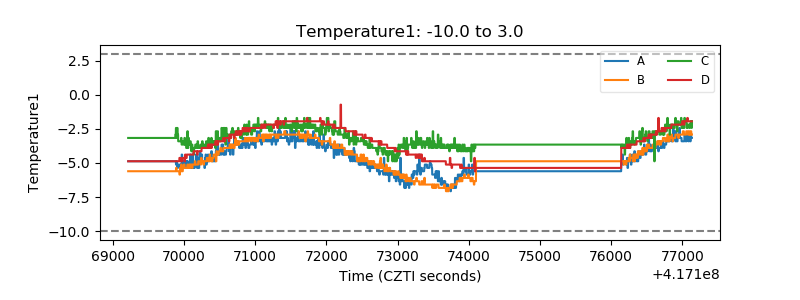 |
| Veto HV Monitor | 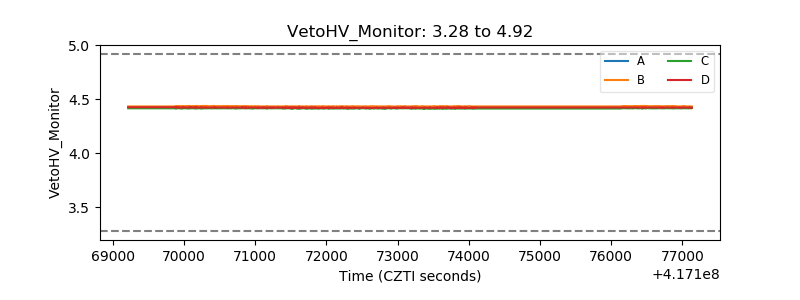 |
| Veto LLD | 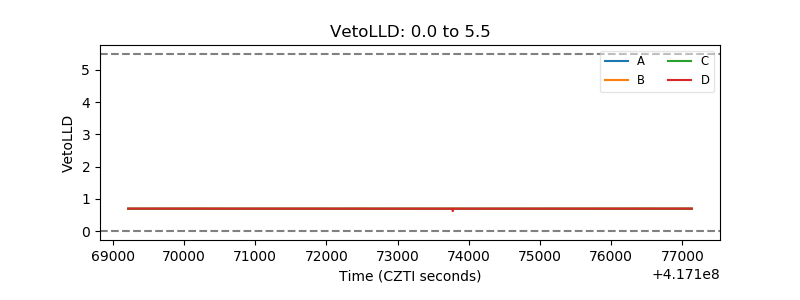 |
| Alpha Counter | 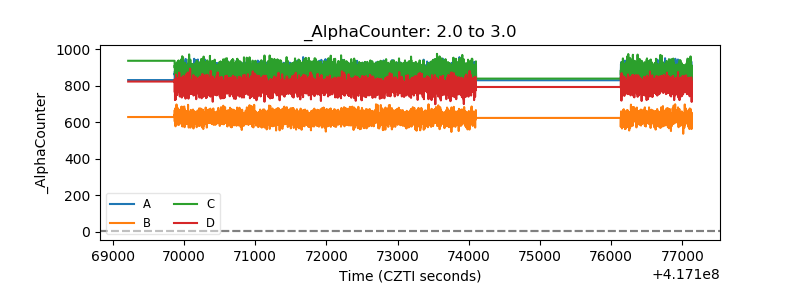 |
| _CPM_Rate | 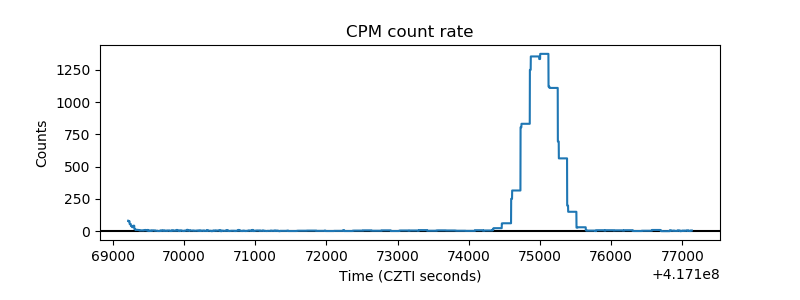 |
| CZT Counter | 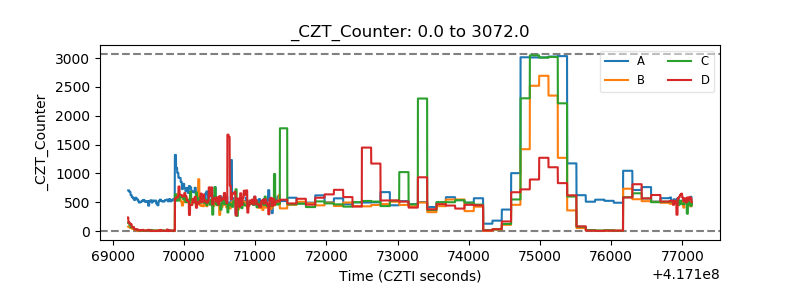 |
| +2.5 Volts monitor |  |
| +5 Volts monitor | 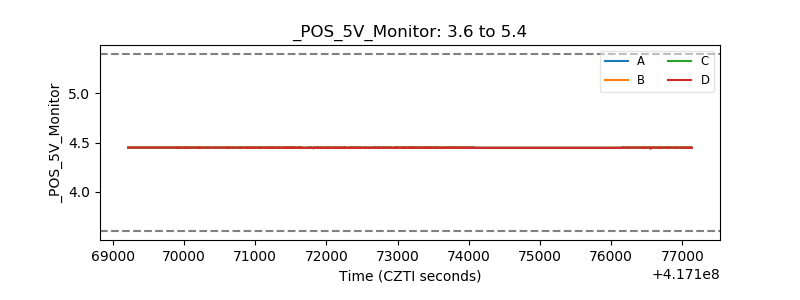 |
| _ROLL_ROT | 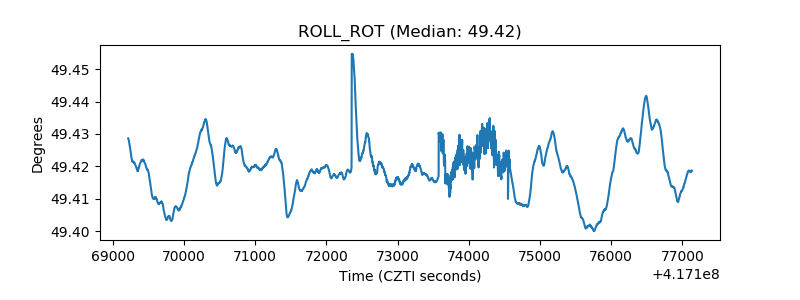 |
| _Roll_DEC |  |
| _Roll_RA | 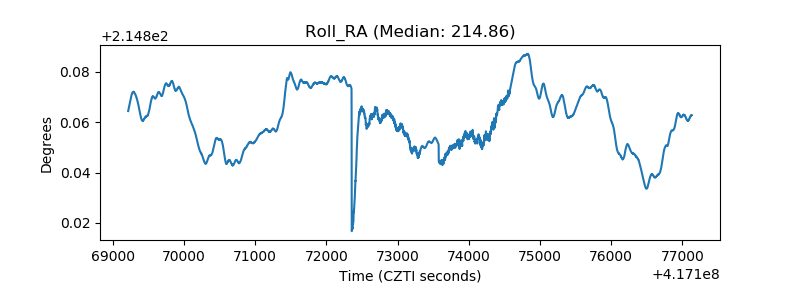 |
| Veto Counter | 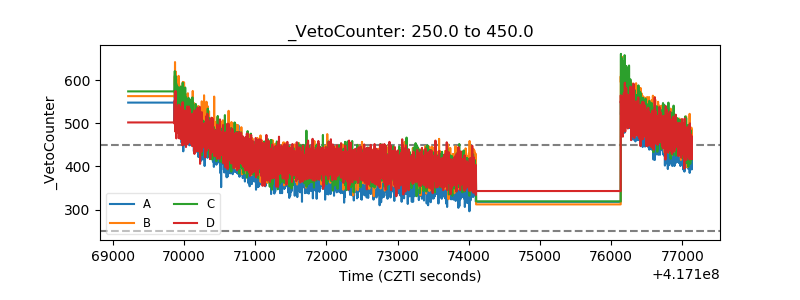 |