| Param | Original file | Final file |
|---|---|---|
| Filename | modeM0/AS1A12_022T01_9000005540_40446cztM0_level2.fits | modeM0/AS1A12_022T01_9000005540_40446cztM0_level2_quad_clean.evt |
| Size (bytes) | 319,656,960 | 96,410,880 |
| Size | 304.8 MB | 91.9 MB |
| Events in quadrant A | 2,927,204 | 676,852 |
| Events in quadrant B | 2,530,430 | 692,977 |
| Events in quadrant C | 2,634,993 | 641,130 |
| Events in quadrant D | 3,335,121 | 545,025 |
| Mode M0 | |||
|---|---|---|---|
| Quadrant | BADHDUFLAG | Total packets | Discarded packets |
| A | 0 | 11858 | 3 |
| B | 0 | 10497 | 2 |
| C | 0 | 10775 | 2 |
| D | 0 | 13235 | 2 |
| Mode M9 | |||
|---|---|---|---|
| Quadrant | BADHDUFLAG | Total packets | Discarded packets |
| A | 0 | 25 | 0 |
| B | 0 | 25 | 0 |
| C | 0 | 25 | 0 |
| D | 0 | 26 | 0 |
| Mode SS | |||
|---|---|---|---|
| Quadrant | BADHDUFLAG | Total packets | Discarded packets |
| A | 0 | 106 | 0 |
| B | 0 | 106 | 0 |
| C | 0 | 106 | 0 |
| D | 0 | 106 | 0 |
| Quadrant | Total seconds | Saturated seconds | Saturation percentage |
|---|---|---|---|
| A | 5190 | 13 | 0.250482% |
| B | 5190 | 2 | 0.038536% |
| C | 5190 | 13 | 0.250482% |
| D | 5190 | 557 | 10.732177% |
Noise dominated data is calculated using 1-second bins in cleaned event files. If a bin has >2000 counts, and if more than 50% of those come from <1% of pixels, then it is considered to be noise-dominated and hence unusable.
| Quadrant | # 1 sec bins | Bins with >0 counts | Bins with >2000 counts | High rate bins dominated by noise | Noise dominated (total time) | Noise dominated (detector-on time) | Marked lightcurve |
|---|---|---|---|---|---|---|---|
| A | 7283 | 5191 | 2 | 2 | 0.03% | 0.04% | 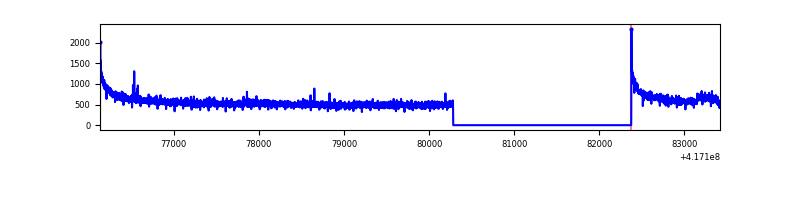 |
| B | 7283 | 5191 | 0 | 0 | 0.00% | 0.00% | 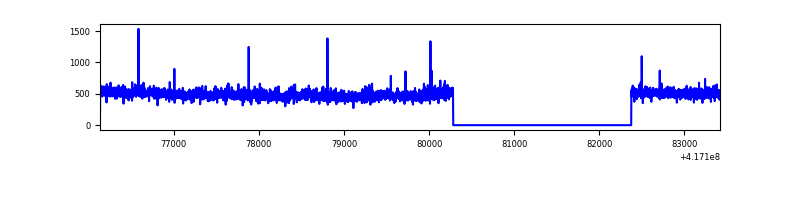 |
| C | 7283 | 5191 | 7 | 7 | 0.10% | 0.13% | 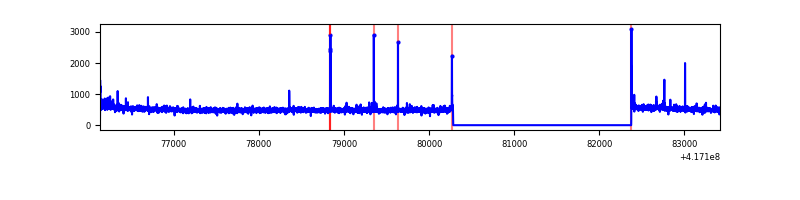 |
| D | 7283 | 5191 | 40 | 40 | 0.55% | 0.77% | 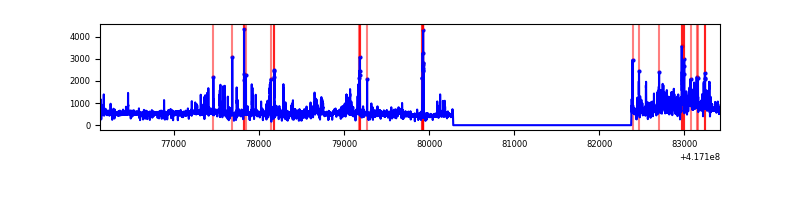 |
Top three noisy pixels from each quadrant. If the there are fewer than three noisy pixels in the level2.evt file, extra rows are filled as -1
| Pixel properties | Quadrant properties | ||||||
|---|---|---|---|---|---|---|---|
| Quadrant | DetID | PixID | Counts | Sigma | Mean | Median | Sigma |
| A | 10 | 83 | 463590 | 3688.7 | 624 | 613 | 125.5 |
| A | 0 | 8 | 25242 | 196.23 | 624 | 613 | 125.5 |
| A | 7 | 3 | 9179 | 68.25 | 624 | 613 | 125.5 |
| B | 3 | 112 | 73087 | 623.53 | 618 | 603 | 116.2 |
| B | 12 | 111 | 14066 | 115.81 | 618 | 603 | 116.2 |
| B | 11 | 111 | 13538 | 111.27 | 618 | 603 | 116.2 |
| C | 15 | 214 | 227024 | 1646.88 | 601 | 607 | 137.5 |
| C | 14 | 254 | 49254 | 353.84 | 601 | 607 | 137.5 |
| C | 0 | 10 | 11043 | 75.91 | 601 | 607 | 137.5 |
| D | 12 | 227 | 282252 | 2026.17 | 574 | 560 | 139.0 |
| D | 2 | 120 | 254191 | 1824.33 | 574 | 560 | 139.0 |
| D | 12 | 191 | 166999 | 1197.17 | 574 | 560 | 139.0 |
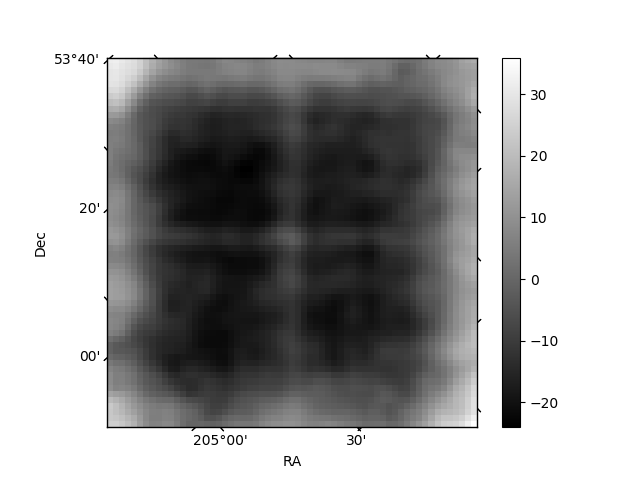
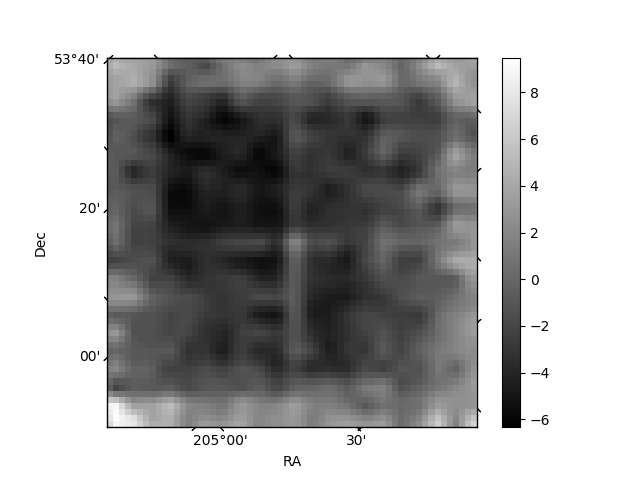
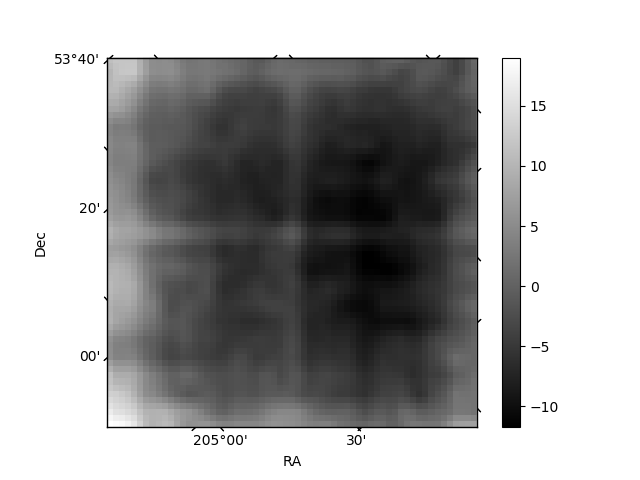
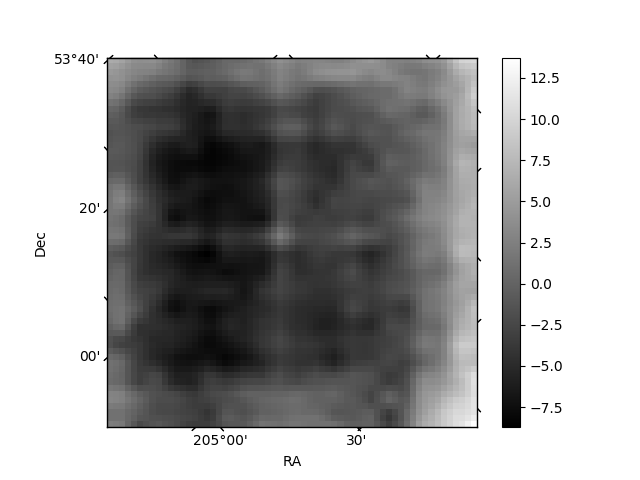
Histogram calculated using DETX and DETY for each event in the final _common_clean file
| Quadrant A | 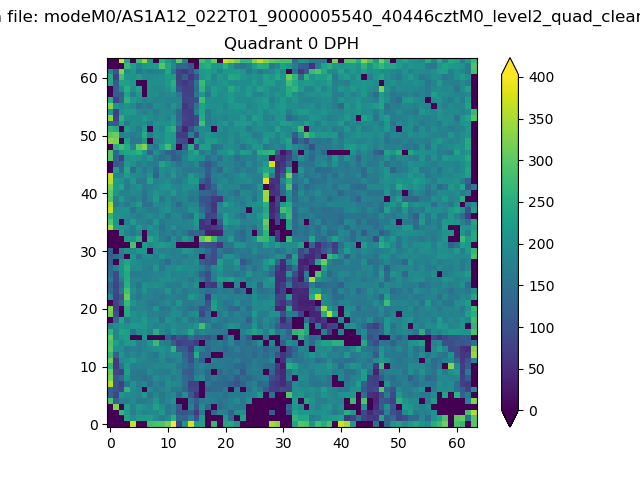 |
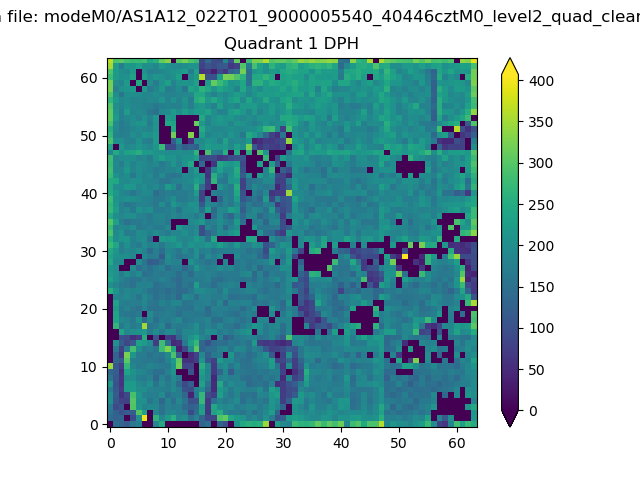 |
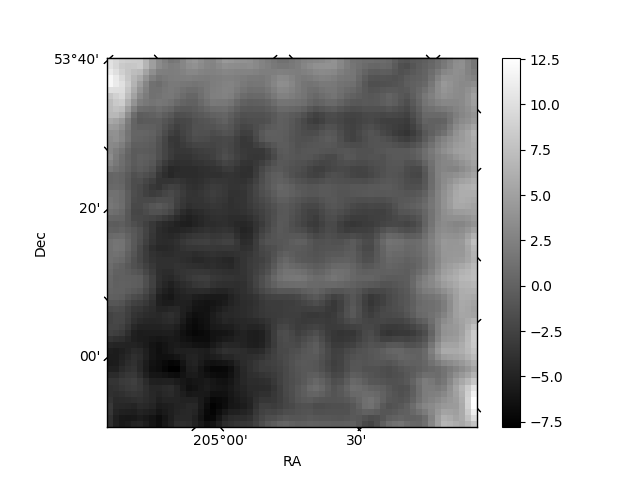
Quadrant B |
|---|---|---|---|
| Quadrant D | 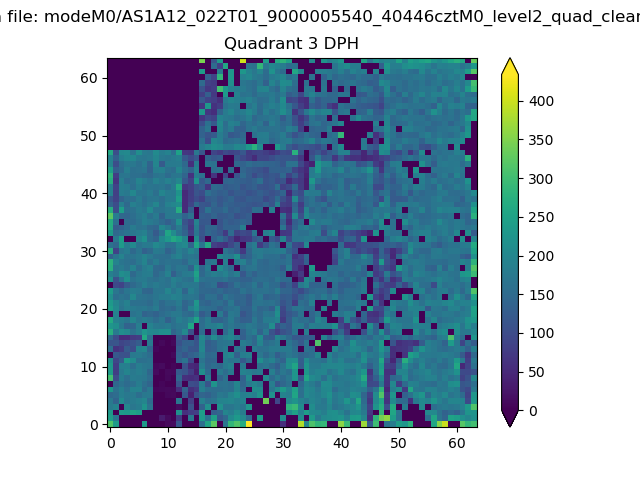 |
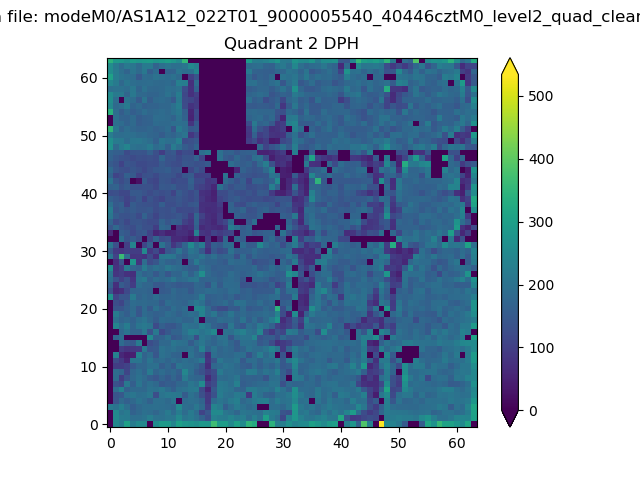 |
Quadrant C |
| Plot type | Count rate plots | Images |
|---|---|---|
| Comparison with Poisson distribution Blue bars denote a histogram of data divided into 1 sec bins. Red curve is a Poisson curve with rate = median count rate of data. |
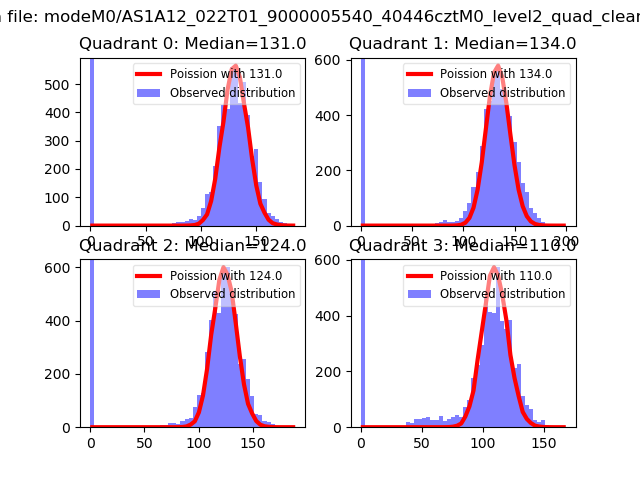 |
 |
| Quadrant-wise count rates Data is divided into 100 sec bins |
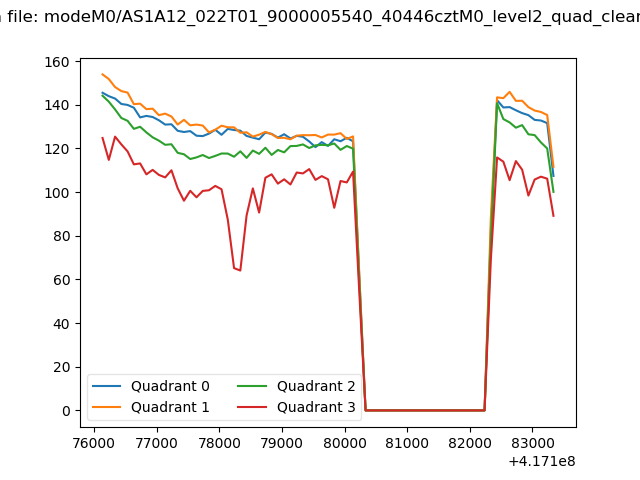 |
|
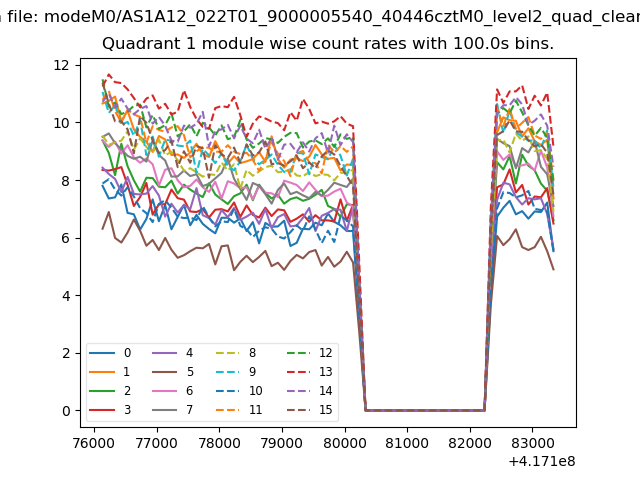
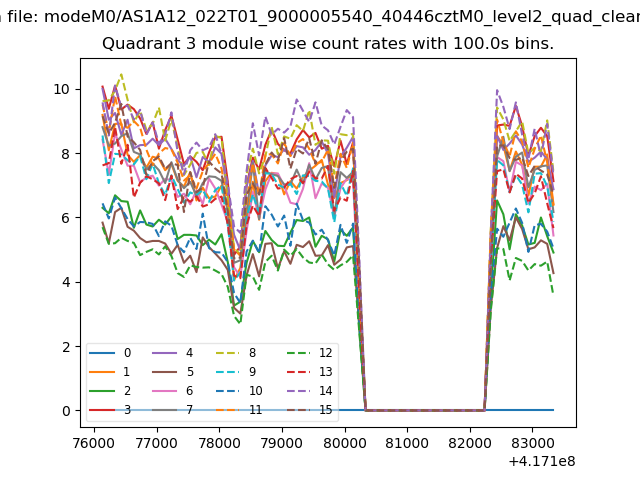
| Module-wise count rates for Quadrant A Data is divided into 100 sec bins |
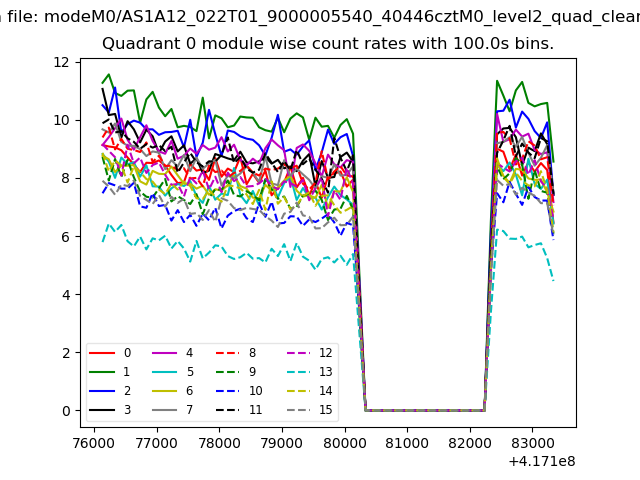 |
 |
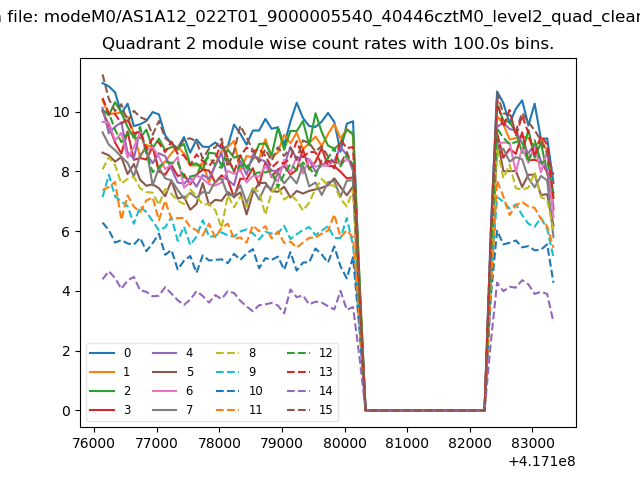
| Module-wise count rates for Quadrant B Data is divided into 100 sec bins |
 |
 |
| Module-wise count rates for Quadrant C Data is divided into 100 sec bins |
 |
 |
| Module-wise count rates for Quadrant D Data is divided into 100 sec bins |
 |
 |
| Parameter | Plot |
|---|---|
| CZT HV Monitor | 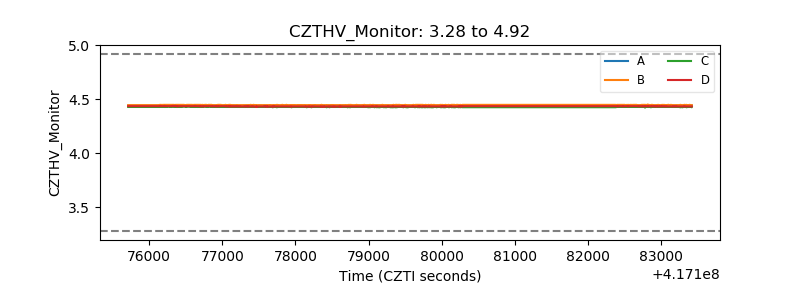 |
| D_VDD | 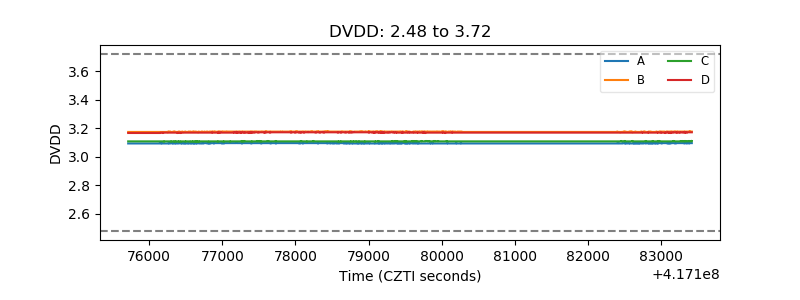 |
| Temperature 1 | 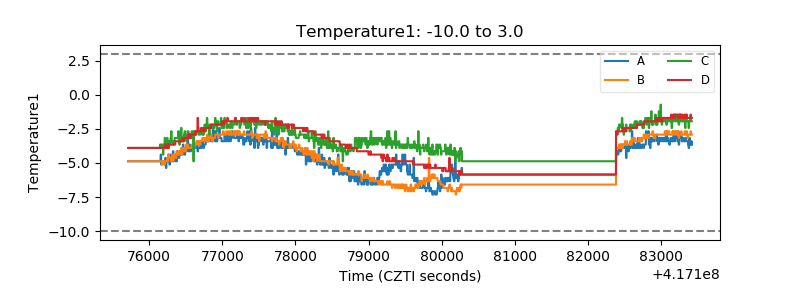 |
| Veto HV Monitor | 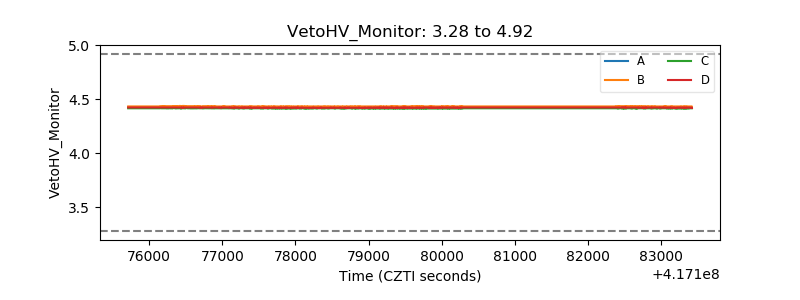 |
| Veto LLD | 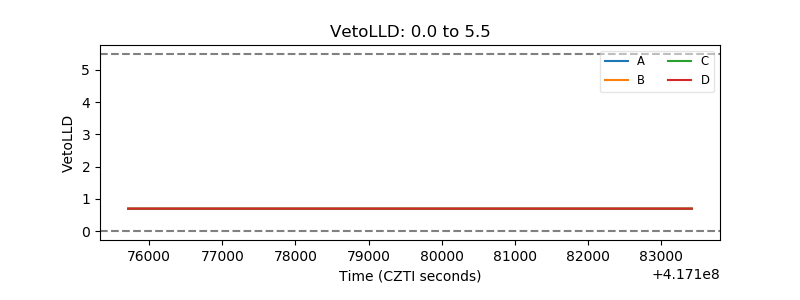 |
| Alpha Counter | 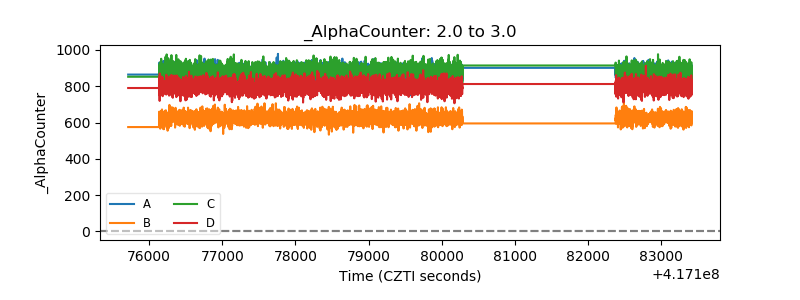 |
| _CPM_Rate | 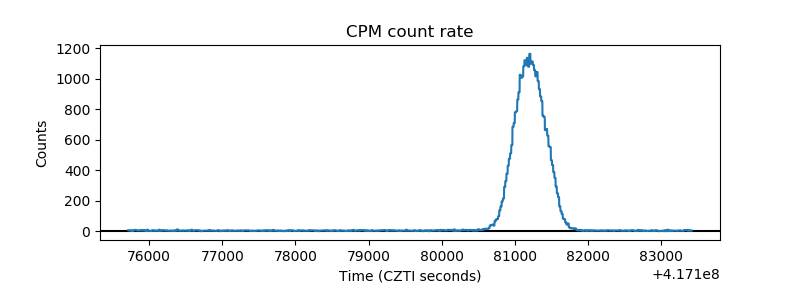 |
| CZT Counter | 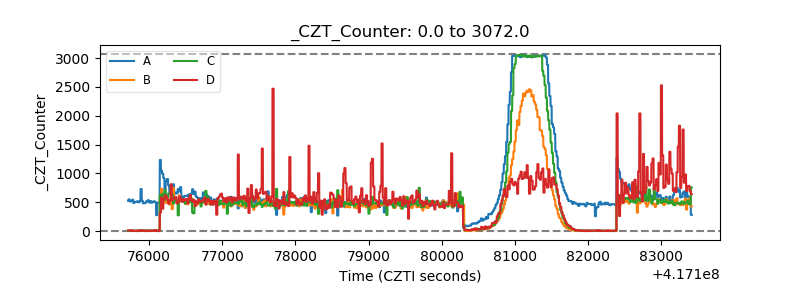 |
| +2.5 Volts monitor | 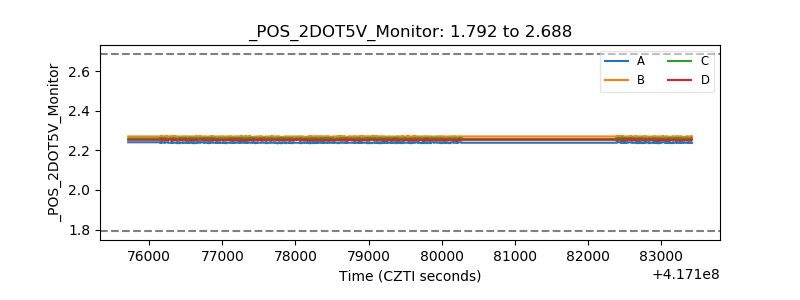 |
| +5 Volts monitor | 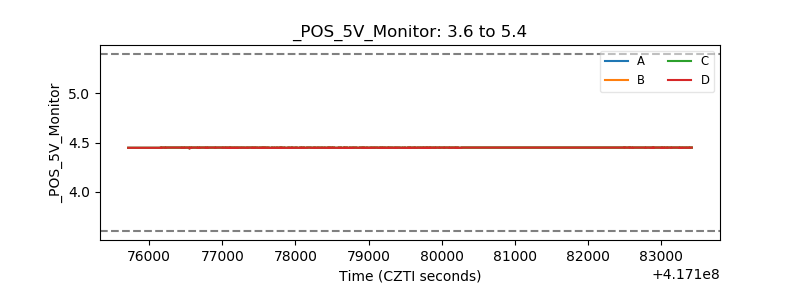 |
| _ROLL_ROT | 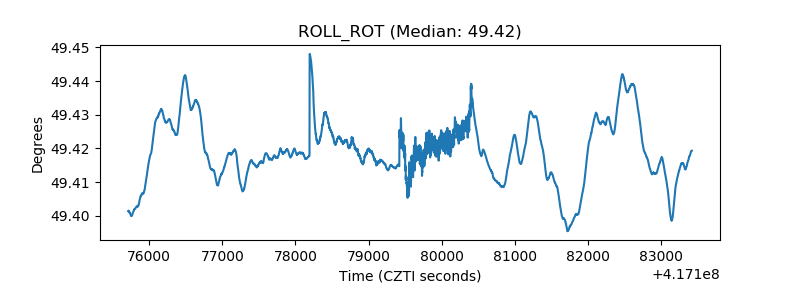 |
| _Roll_DEC | 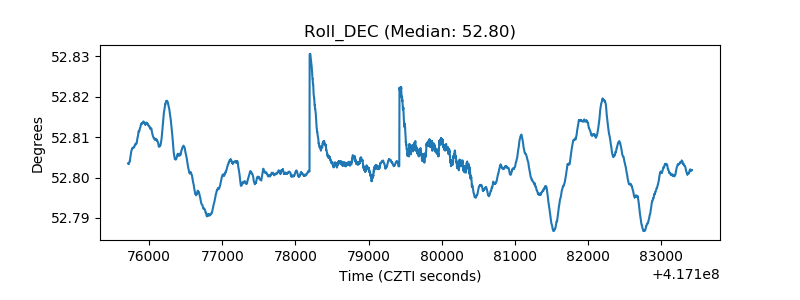 |
| _Roll_RA |  |
| Veto Counter | 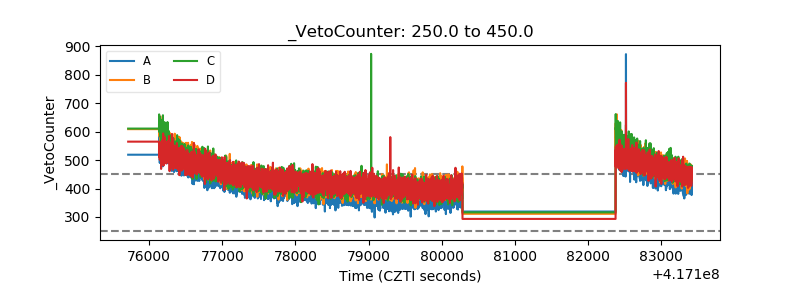 |