| Param | Original file | Final file |
|---|---|---|
| Filename | modeM0/AS1A12_022T01_9000005540_40447cztM0_level2.fits | modeM0/AS1A12_022T01_9000005540_40447cztM0_level2_quad_clean.evt |
| Size (bytes) | 810,308,160 | 240,295,680 |
| Size | 772.8 MB | 229.2 MB |
| Events in quadrant A | 7,149,950 | 1,677,867 |
| Events in quadrant B | 6,347,216 | 1,713,886 |
| Events in quadrant C | 6,796,518 | 1,593,453 |
| Events in quadrant D | 8,668,055 | 1,371,584 |
| Mode M0 | |||
|---|---|---|---|
| Quadrant | BADHDUFLAG | Total packets | Discarded packets |
| A | 0 | 29012 | 4 |
| B | 0 | 27074 | 3 |
| C | 0 | 27965 | 3 |
| D | 0 | 34460 | 3 |
| Mode M9 | |||
|---|---|---|---|
| Quadrant | BADHDUFLAG | Total packets | Discarded packets |
| A | 0 | 63 | 0 |
| B | 0 | 63 | 0 |
| C | 0 | 63 | 0 |
| D | 0 | 63 | 0 |
| Mode SS | |||
|---|---|---|---|
| Quadrant | BADHDUFLAG | Total packets | Discarded packets |
| A | 0 | 270 | 0 |
| B | 0 | 270 | 0 |
| C | 0 | 270 | 0 |
| D | 0 | 270 | 0 |
| Quadrant | Total seconds | Saturated seconds | Saturation percentage |
|---|---|---|---|
| A | 13321 | 20 | 0.150139% |
| B | 13321 | 34 | 0.255236% |
| C | 13321 | 55 | 0.412882% |
| D | 13321 | 1228 | 9.218527% |
Noise dominated data is calculated using 1-second bins in cleaned event files. If a bin has >2000 counts, and if more than 50% of those come from <1% of pixels, then it is considered to be noise-dominated and hence unusable.
| Quadrant | # 1 sec bins | Bins with >0 counts | Bins with >2000 counts | High rate bins dominated by noise | Noise dominated (total time) | Noise dominated (detector-on time) | Marked lightcurve |
|---|---|---|---|---|---|---|---|
| A | 19570 | 13324 | 4 | 4 | 0.02% | 0.03% | 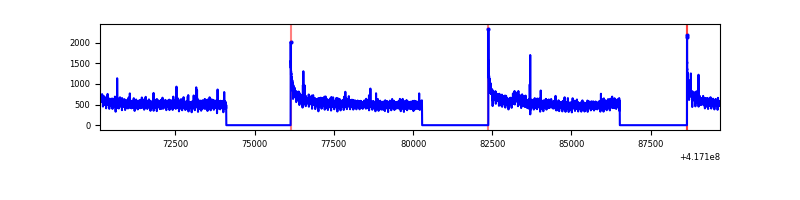 |
| B | 19570 | 13324 | 16 | 16 | 0.08% | 0.12% | 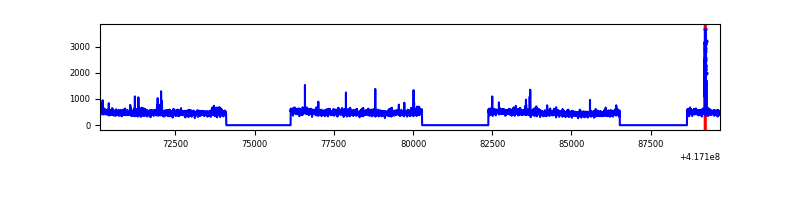 |
| C | 19570 | 13324 | 37 | 37 | 0.19% | 0.28% | 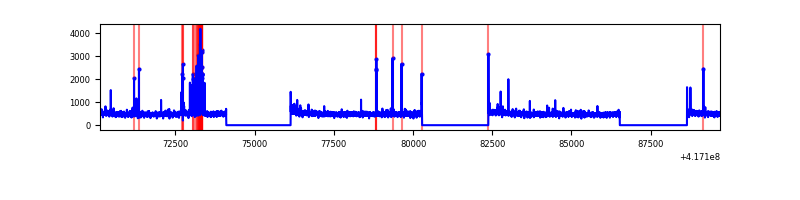 |
| D | 19570 | 13324 | 116 | 116 | 0.59% | 0.87% | 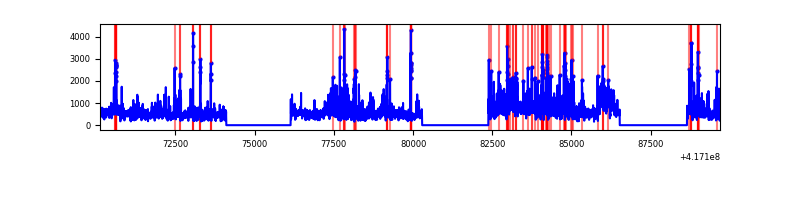 |
Top three noisy pixels from each quadrant. If the there are fewer than three noisy pixels in the level2.evt file, extra rows are filled as -1
| Pixel properties | Quadrant properties | ||||||
|---|---|---|---|---|---|---|---|
| Quadrant | DetID | PixID | Counts | Sigma | Mean | Median | Sigma |
| A | 10 | 83 | 1028141 | 3307.46 | 1558 | 1534 | 310.4 |
| A | 3 | 1 | 30860 | 94.48 | 1558 | 1534 | 310.4 |
| A | 0 | 8 | 26258 | 79.65 | 1558 | 1534 | 310.4 |
| B | 3 | 112 | 139998 | 478.54 | 1543 | 1500 | 289.4 |
| B | 4 | 171 | 78655 | 266.59 | 1543 | 1500 | 289.4 |
| B | 12 | 111 | 35420 | 117.2 | 1543 | 1500 | 289.4 |
| C | 15 | 214 | 568591 | 1658.45 | 1510 | 1522 | 341.9 |
| C | 14 | 254 | 316441 | 921.01 | 1510 | 1522 | 341.9 |
| C | 0 | 10 | 15691 | 41.44 | 1510 | 1522 | 341.9 |
| D | 12 | 227 | 1177309 | 3352.43 | 1449 | 1412 | 350.8 |
| D | 12 | 191 | 397608 | 1129.54 | 1449 | 1412 | 350.8 |
| D | 8 | 230 | 361301 | 1026.03 | 1449 | 1412 | 350.8 |
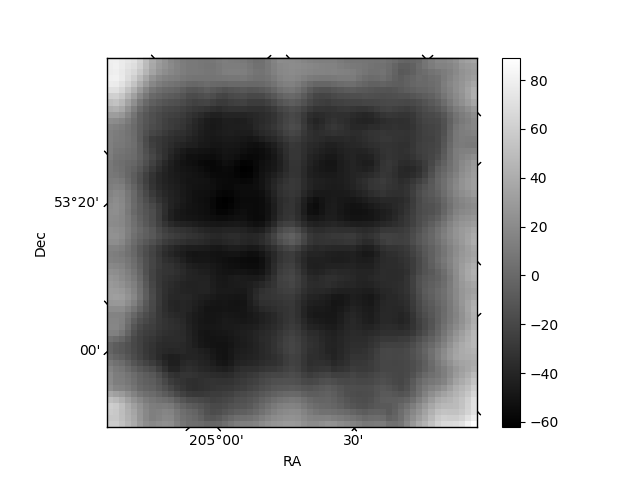
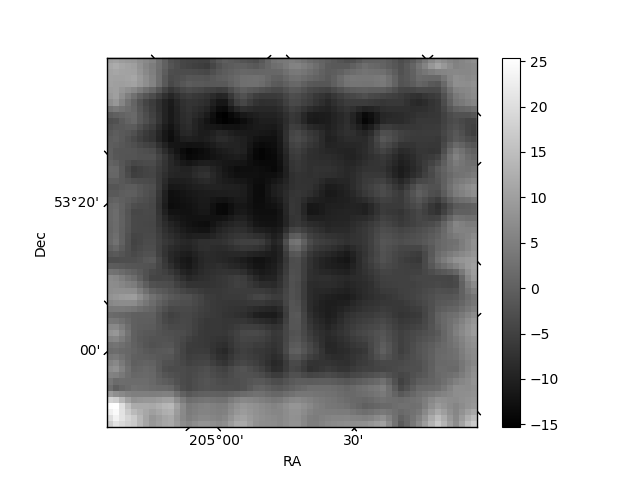
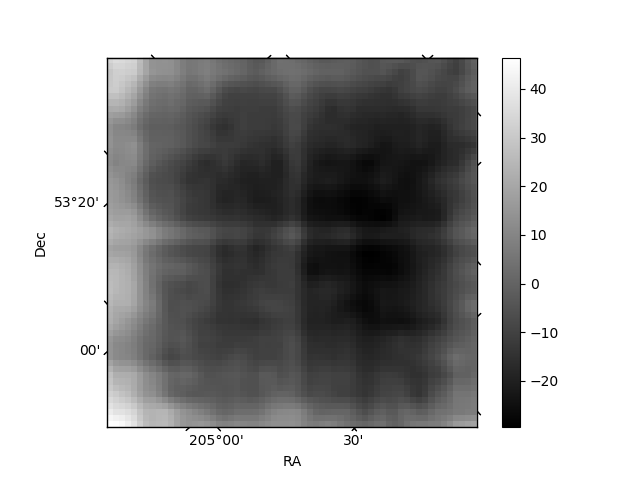
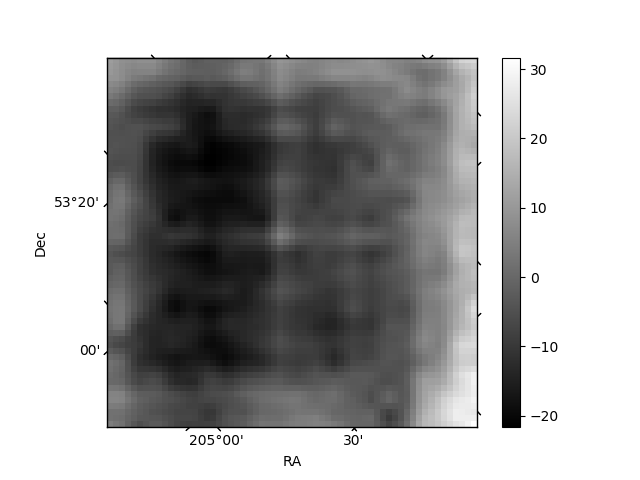
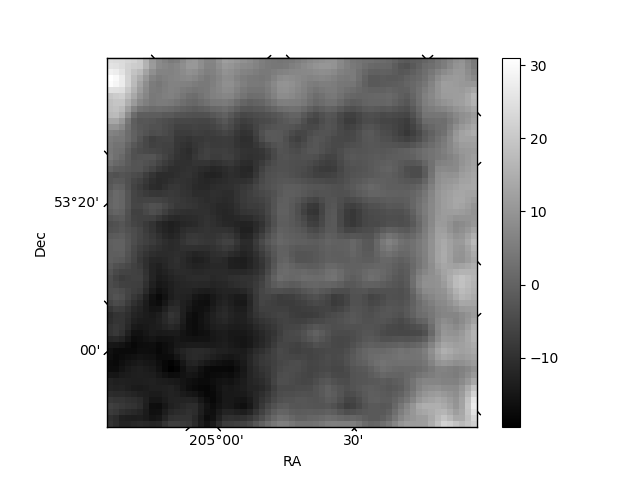
Histogram calculated using DETX and DETY for each event in the final _common_clean file
| Quadrant A | 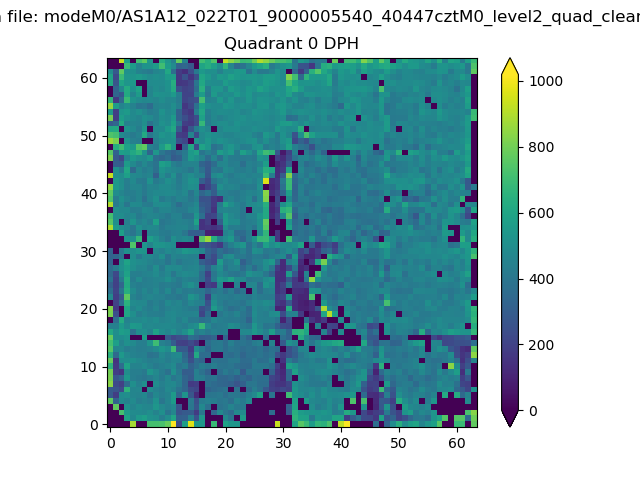 |
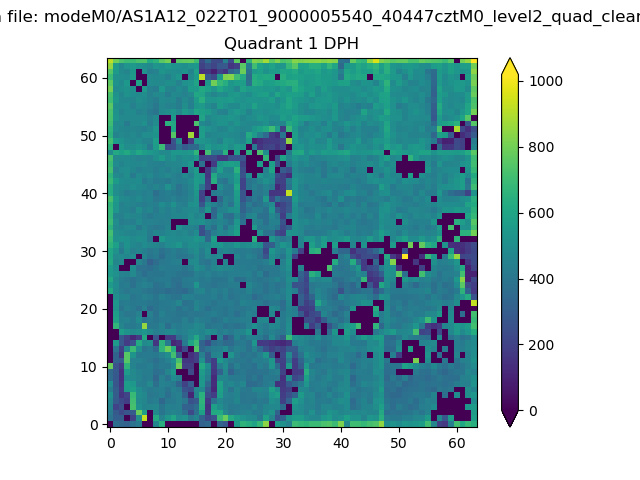 |
Quadrant B |
|---|---|---|---|
| Quadrant D | 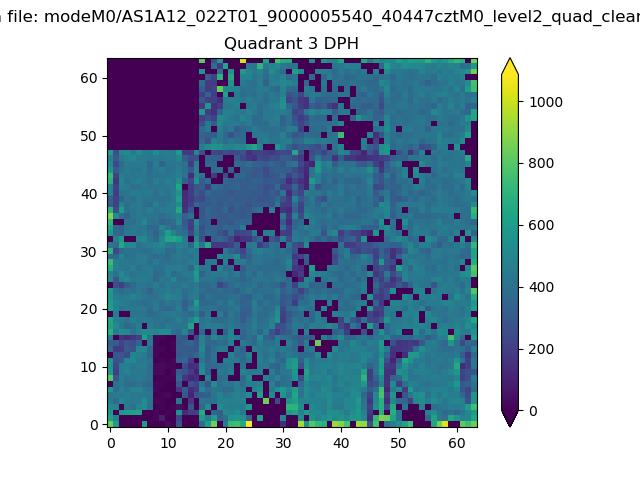 |
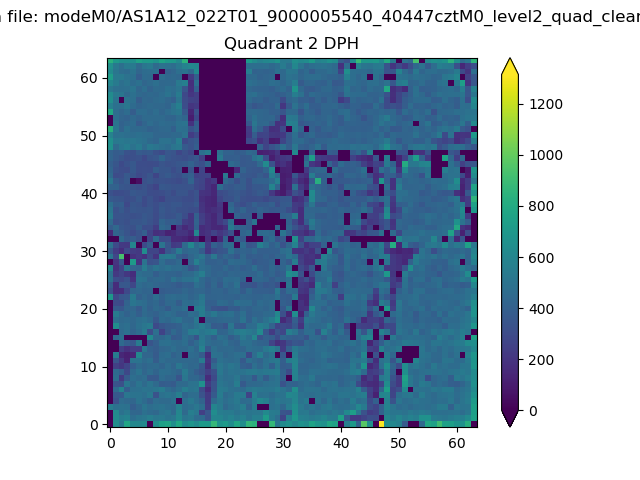 |
Quadrant C |
| Plot type | Count rate plots | Images |
|---|---|---|
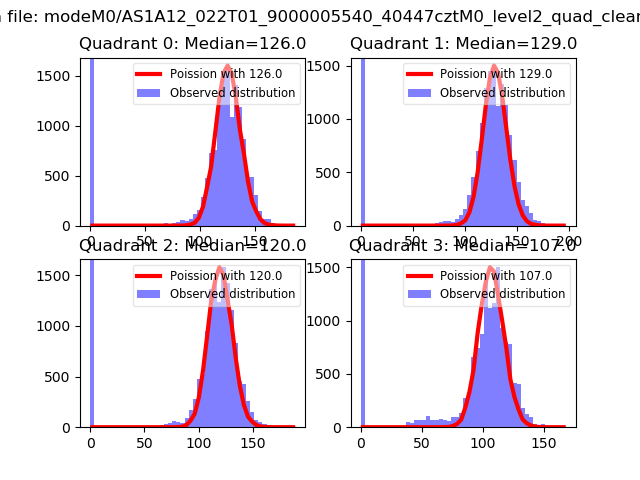
| Comparison with Poisson distribution Blue bars denote a histogram of data divided into 1 sec bins. Red curve is a Poisson curve with rate = median count rate of data. |
 |
 |
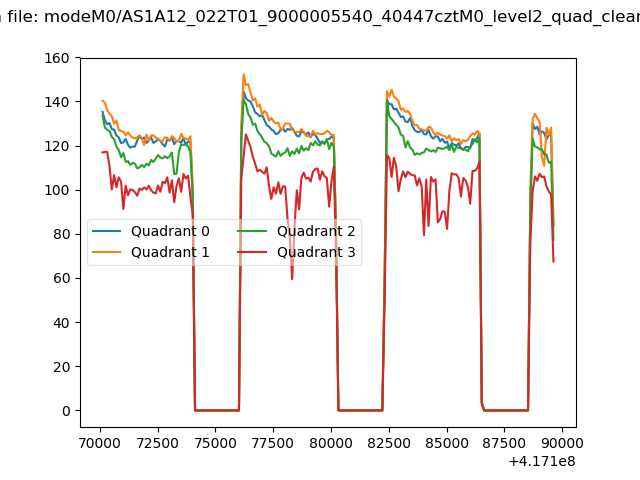
| Quadrant-wise count rates Data is divided into 100 sec bins |
 |
|
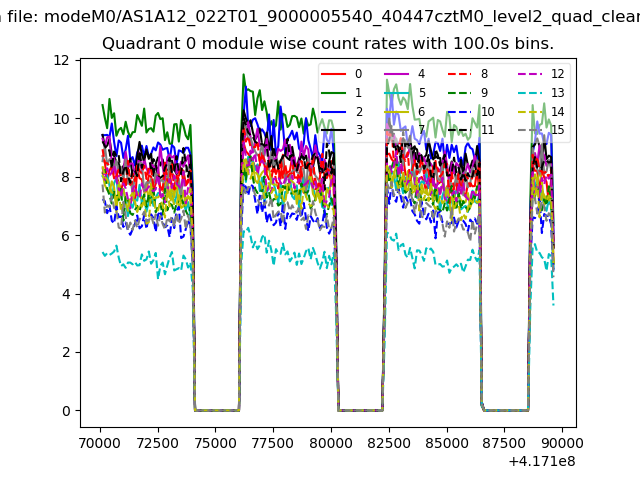
| Module-wise count rates for Quadrant A Data is divided into 100 sec bins |
 |
 |
| Module-wise count rates for Quadrant B Data is divided into 100 sec bins |
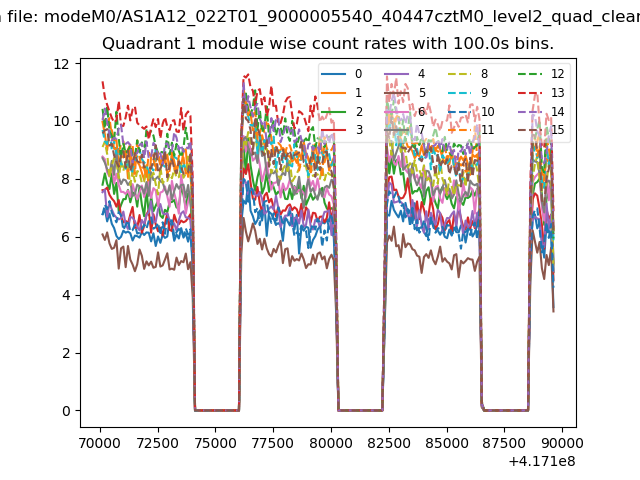 |
 |
| Module-wise count rates for Quadrant C Data is divided into 100 sec bins |
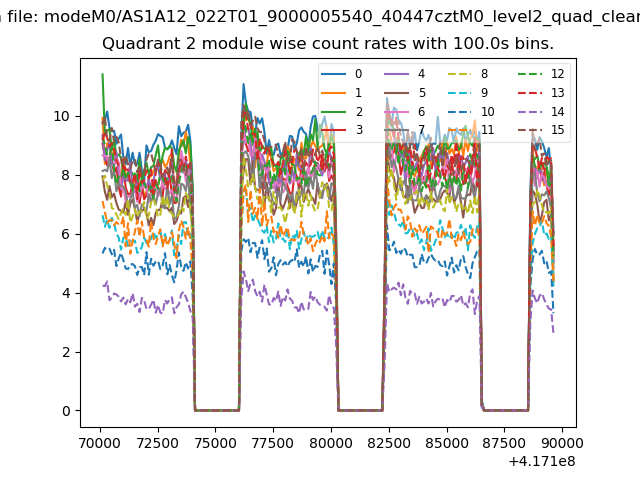 |
 |
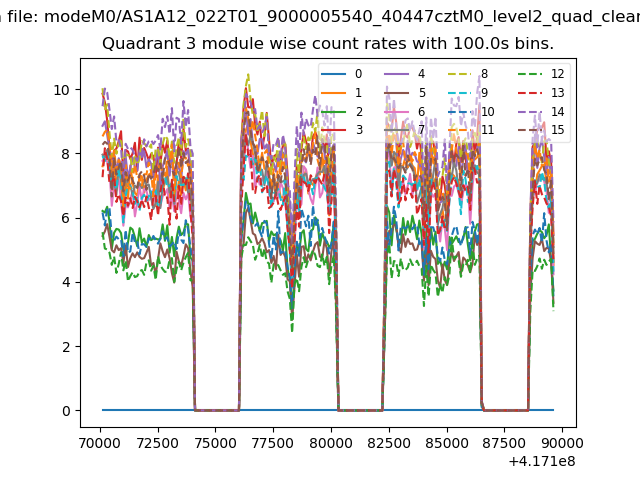
| Module-wise count rates for Quadrant D Data is divided into 100 sec bins |
 |
 |
| Parameter | Plot |
|---|---|
| CZT HV Monitor | 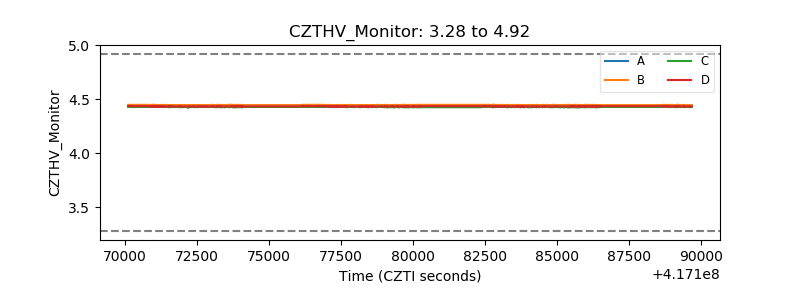 |
| D_VDD | 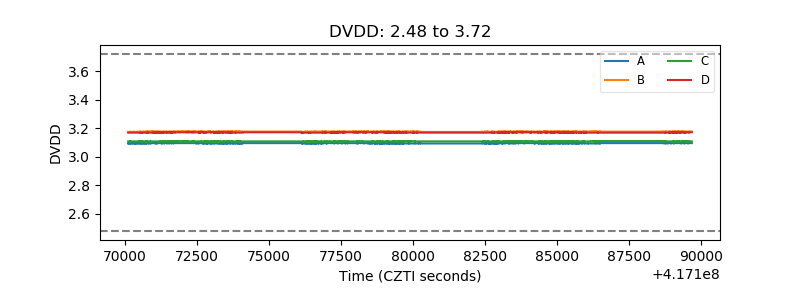 |
| Temperature 1 | 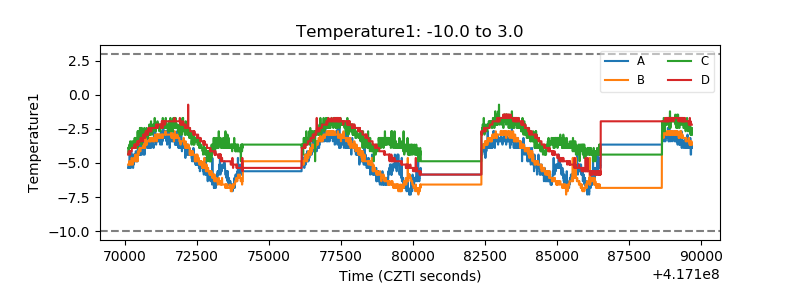 |
| Veto HV Monitor | 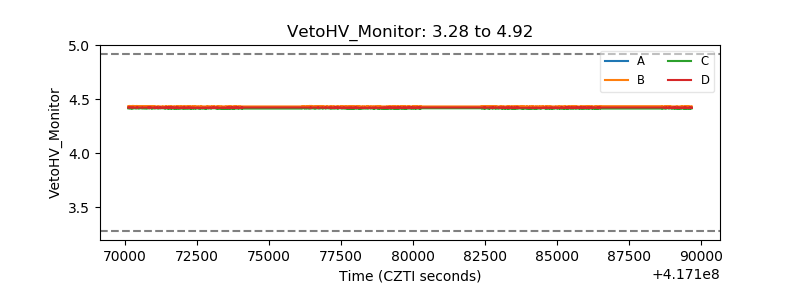 |
| Veto LLD | 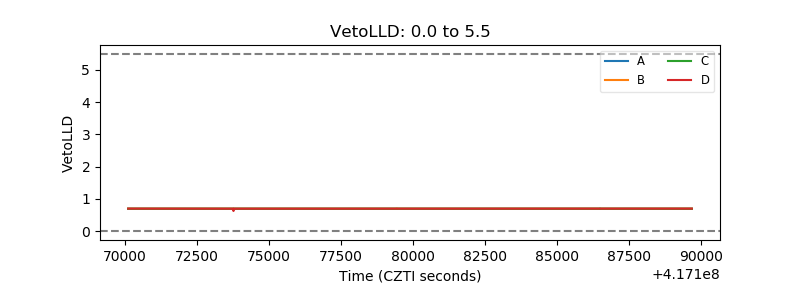 |
| Alpha Counter | 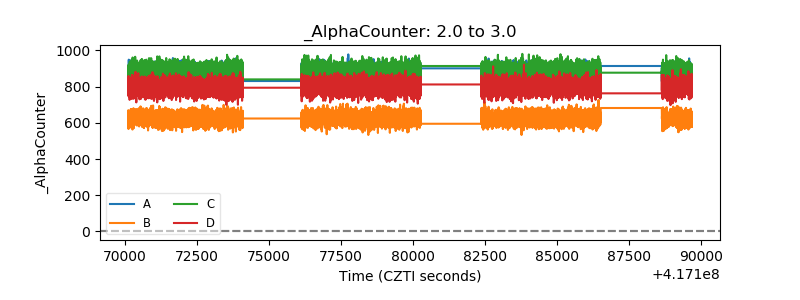 |
| _CPM_Rate | 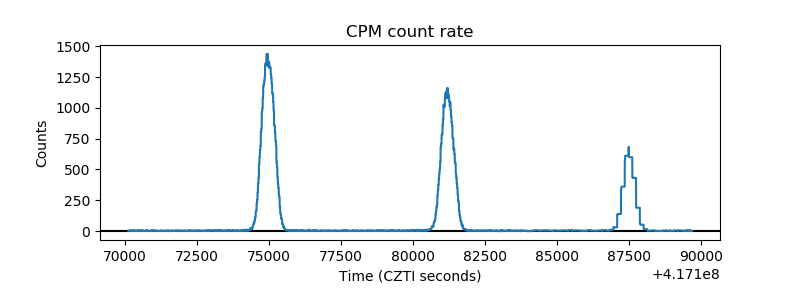 |
| CZT Counter | 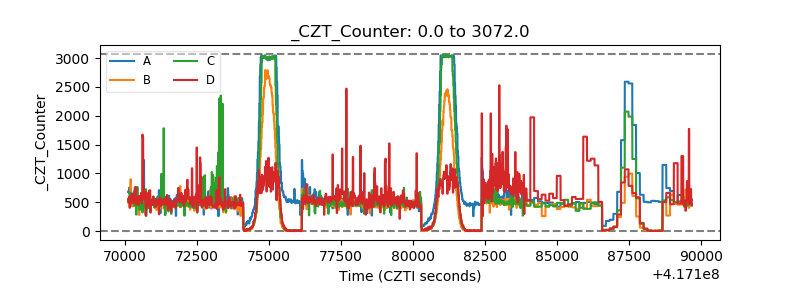 |
| +2.5 Volts monitor |  |
| +5 Volts monitor | 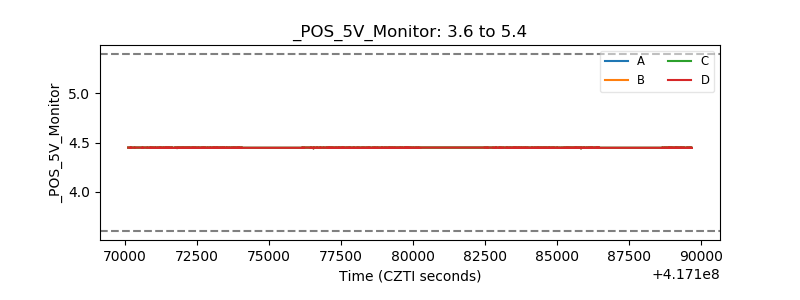 |
| _ROLL_ROT | 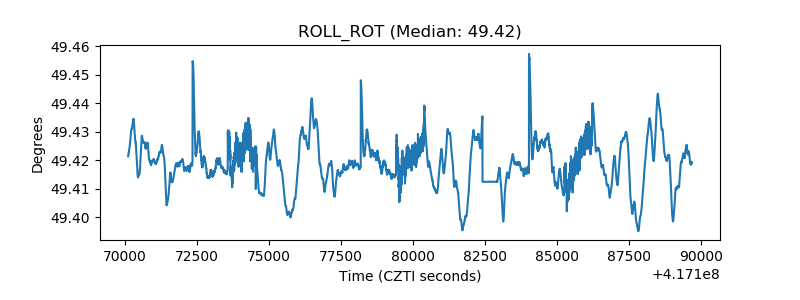 |
| _Roll_DEC | 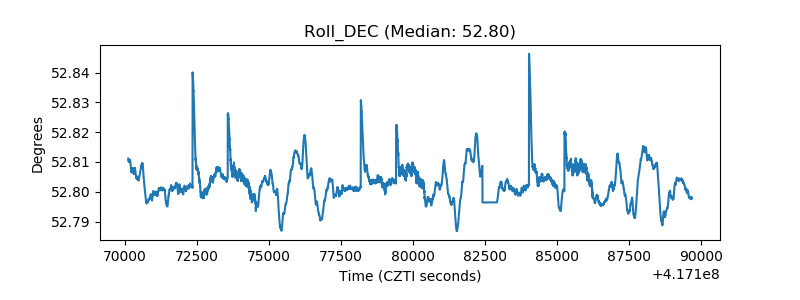 |
| _Roll_RA | 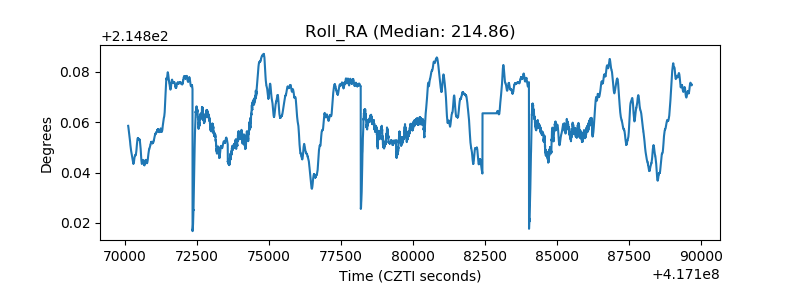 |
| Veto Counter | 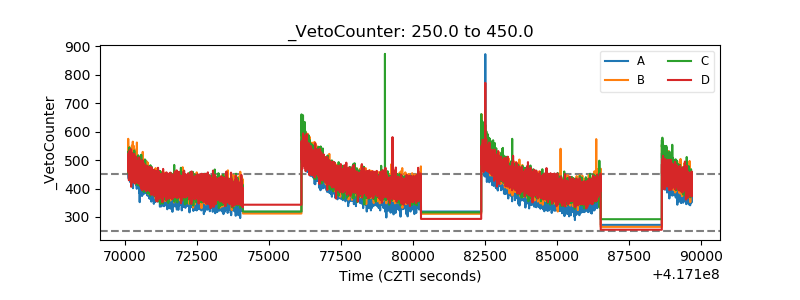 |