| Param | Original file | Final file |
|---|---|---|
| Filename | modeM0/AS1A12_022T01_9000005540_40448cztM0_level2.fits | modeM0/AS1A12_022T01_9000005540_40448cztM0_level2_quad_clean.evt |
| Size (bytes) | 316,065,600 | 87,549,120 |
| Size | 301.4 MB | 83.5 MB |
| Events in quadrant A | 2,672,280 | 601,562 |
| Events in quadrant B | 2,301,191 | 611,957 |
| Events in quadrant C | 2,433,465 | 577,675 |
| Events in quadrant D | 3,900,921 | 507,641 |
| Mode M0 | |||
|---|---|---|---|
| Quadrant | BADHDUFLAG | Total packets | Discarded packets |
| A | 0 | 11081 | 3 |
| B | 0 | 10270 | 2 |
| C | 0 | 10287 | 2 |
| D | 0 | 15113 | 2 |
| Mode M9 | |||
|---|---|---|---|
| Quadrant | BADHDUFLAG | Total packets | Discarded packets |
| A | 0 | 30 | 0 |
| B | 0 | 30 | 0 |
| C | 0 | 30 | 0 |
| D | 0 | 31 | 0 |
| Mode SS | |||
|---|---|---|---|
| Quadrant | BADHDUFLAG | Total packets | Discarded packets |
| A | 0 | 102 | 0 |
| B | 0 | 102 | 0 |
| C | 0 | 102 | 0 |
| D | 0 | 102 | 0 |
| Quadrant | Total seconds | Saturated seconds | Saturation percentage |
|---|---|---|---|
| A | 5026 | 15 | 0.298448% |
| B | 5026 | 34 | 0.676482% |
| C | 5026 | 7 | 0.139276% |
| D | 5026 | 334 | 6.645444% |
Noise dominated data is calculated using 1-second bins in cleaned event files. If a bin has >2000 counts, and if more than 50% of those come from <1% of pixels, then it is considered to be noise-dominated and hence unusable.
| Quadrant | # 1 sec bins | Bins with >0 counts | Bins with >2000 counts | High rate bins dominated by noise | Noise dominated (total time) | Noise dominated (detector-on time) | Marked lightcurve |
|---|---|---|---|---|---|---|---|
| A | 7090 | 5027 | 3 | 3 | 0.04% | 0.06% | 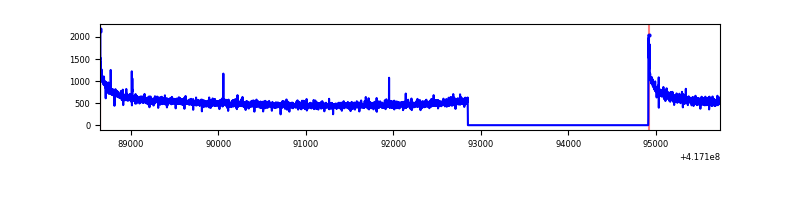 |
| B | 7090 | 5027 | 16 | 16 | 0.23% | 0.32% | 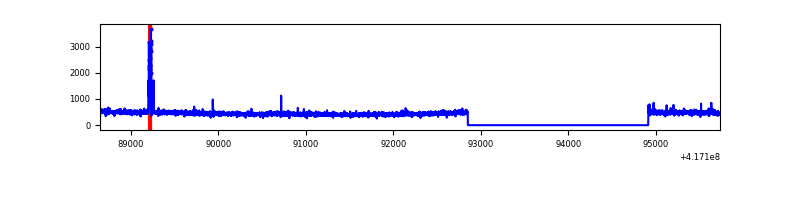 |
| C | 7090 | 5027 | 3 | 3 | 0.04% | 0.06% | 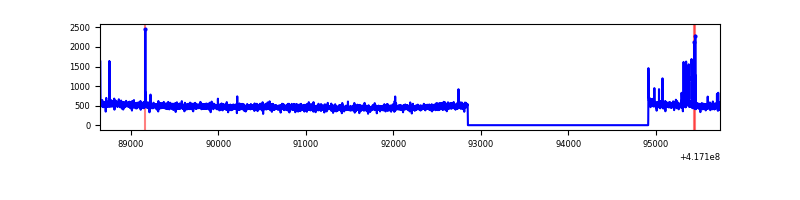 |
| D | 7090 | 5026 | 85 | 85 | 1.20% | 1.69% | 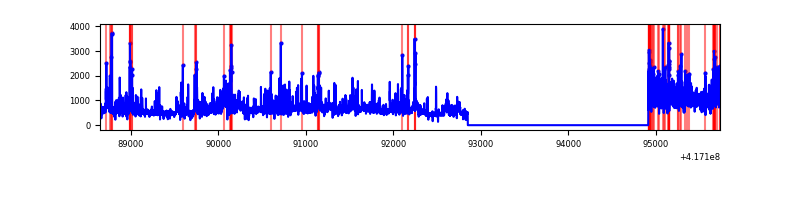 |
Top three noisy pixels from each quadrant. If the there are fewer than three noisy pixels in the level2.evt file, extra rows are filled as -1
| Pixel properties | Quadrant properties | ||||||
|---|---|---|---|---|---|---|---|
| Quadrant | DetID | PixID | Counts | Sigma | Mean | Median | Sigma |
| A | 10 | 83 | 465371 | 4081.23 | 564 | 554 | 113.9 |
| A | 3 | 1 | 10649 | 88.64 | 564 | 554 | 113.9 |
| A | 7 | 3 | 7207 | 58.42 | 564 | 554 | 113.9 |
| B | 4 | 171 | 65141 | 606.98 | 559 | 544 | 106.4 |
| B | 3 | 112 | 26223 | 241.29 | 559 | 544 | 106.4 |
| B | 12 | 111 | 13233 | 119.23 | 559 | 544 | 106.4 |
| C | 15 | 214 | 220106 | 1736.97 | 551 | 554 | 126.4 |
| C | 14 | 254 | 53983 | 422.7 | 551 | 554 | 126.4 |
| C | 0 | 10 | 7113 | 51.89 | 551 | 554 | 126.4 |
| D | 12 | 227 | 1498669 | 11302.73 | 535 | 519 | 132.5 |
| D | 12 | 191 | 115756 | 869.4 | 535 | 519 | 132.5 |
| D | 2 | 250 | 112610 | 845.67 | 535 | 519 | 132.5 |
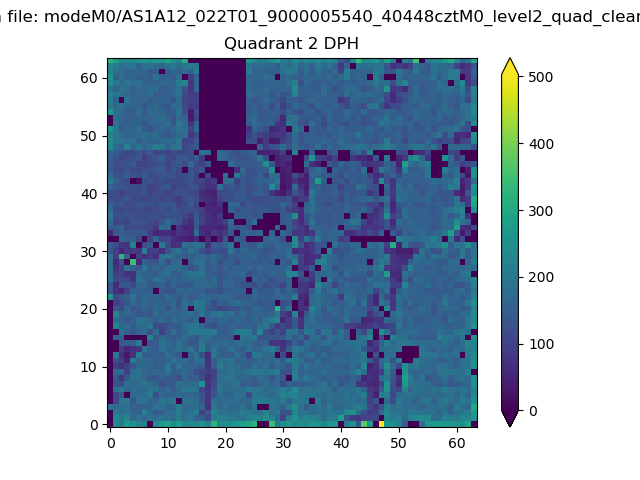
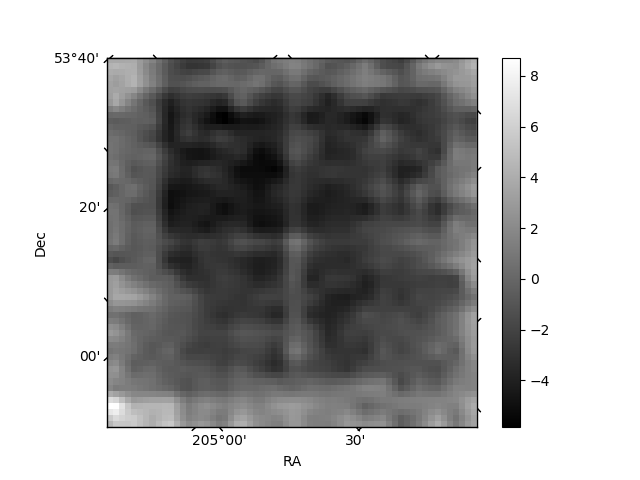
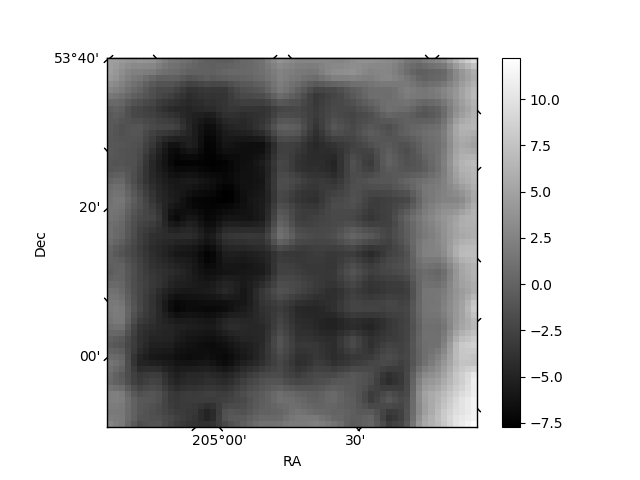
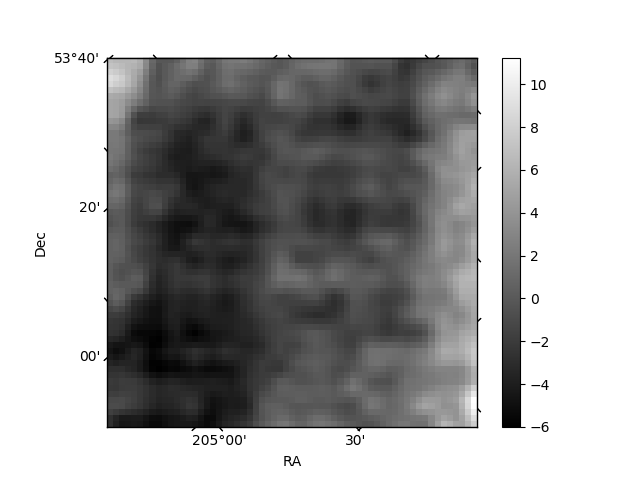
Histogram calculated using DETX and DETY for each event in the final _common_clean file
| Quadrant A | 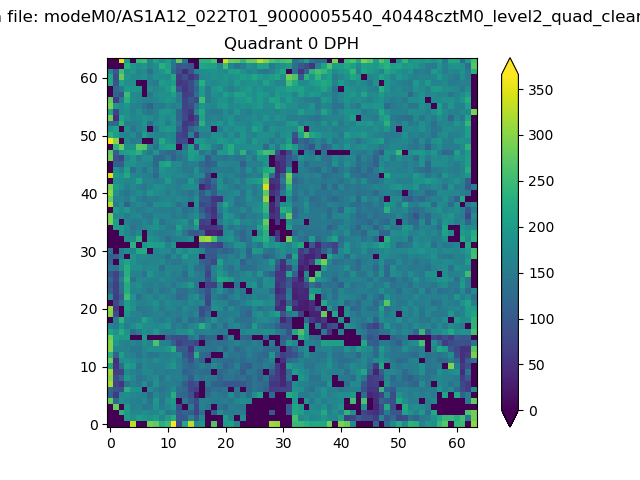 |
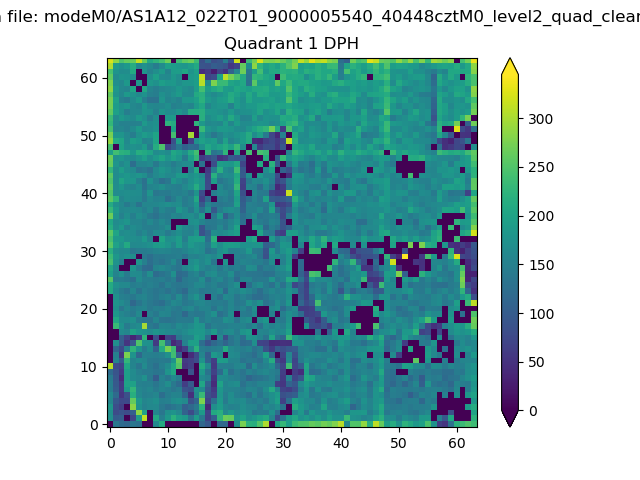 |
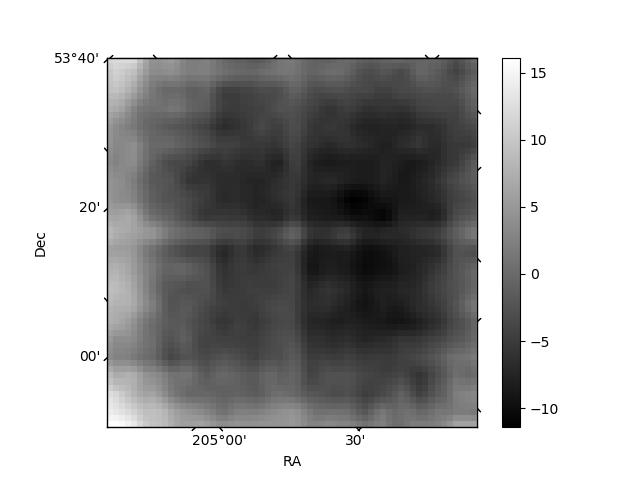
Quadrant B |
|---|---|---|---|
| Quadrant D | 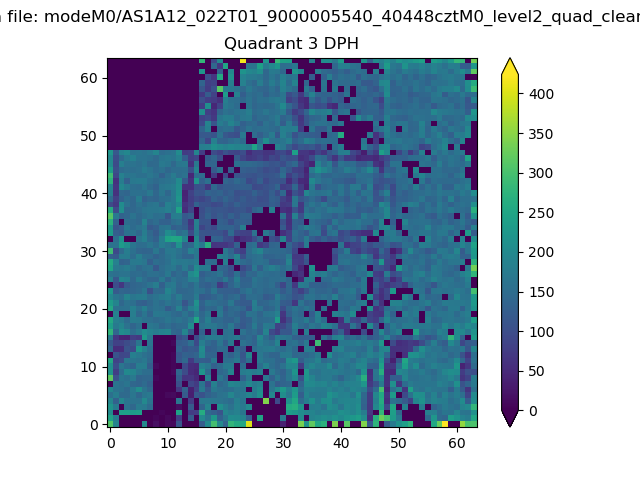 |
 |
Quadrant C |
| Plot type | Count rate plots | Images |
|---|---|---|
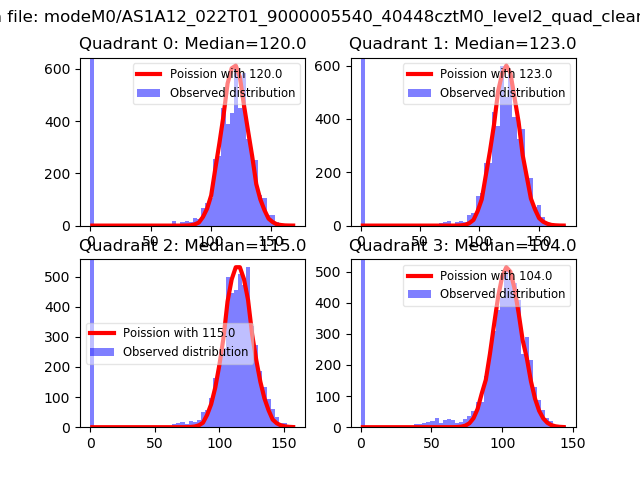
| Comparison with Poisson distribution Blue bars denote a histogram of data divided into 1 sec bins. Red curve is a Poisson curve with rate = median count rate of data. |
 |
 |
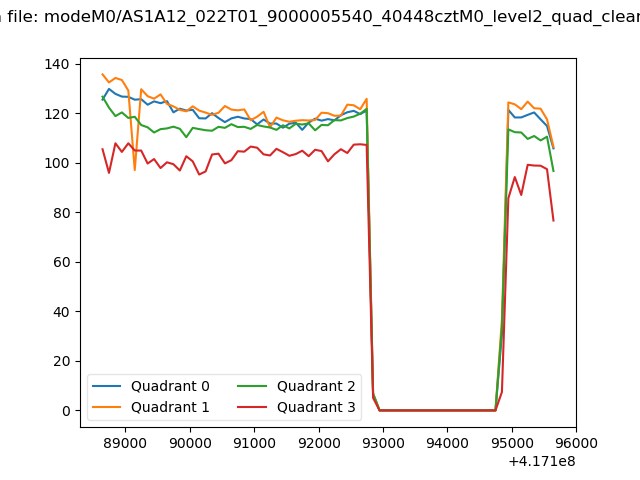
| Quadrant-wise count rates Data is divided into 100 sec bins |
 |
|
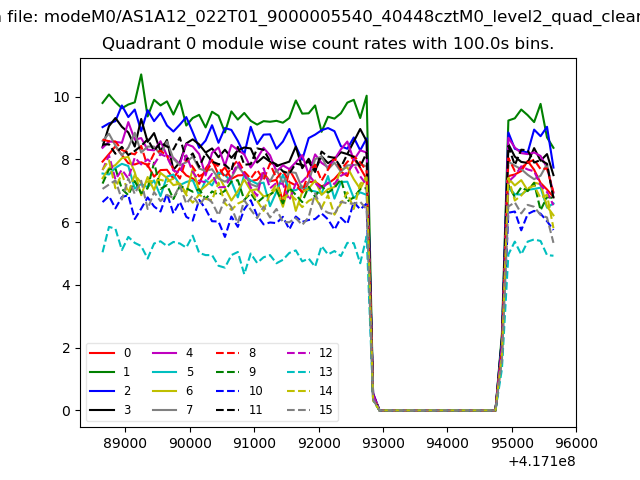
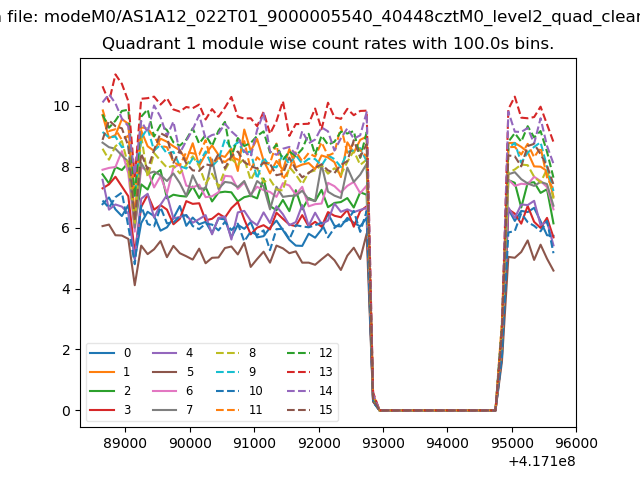
| Module-wise count rates for Quadrant A Data is divided into 100 sec bins |
 |
 |
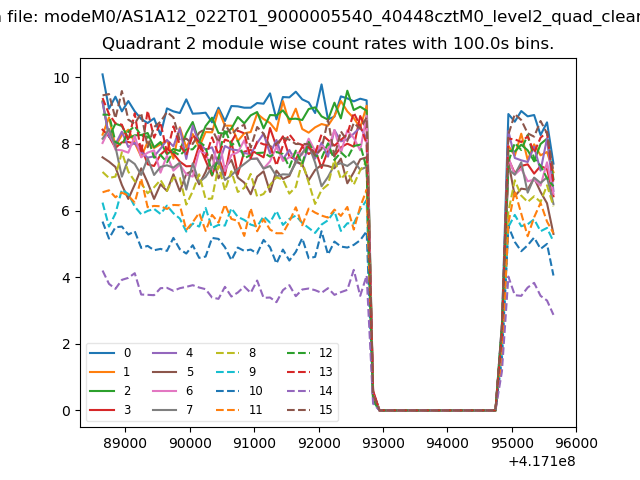
| Module-wise count rates for Quadrant B Data is divided into 100 sec bins |
 |
 |
| Module-wise count rates for Quadrant C Data is divided into 100 sec bins |
 |
 |
| Module-wise count rates for Quadrant D Data is divided into 100 sec bins |
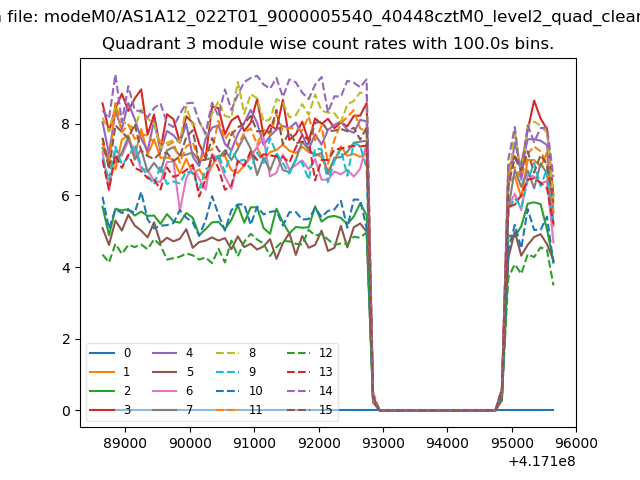 |
 |
| Parameter | Plot |
|---|---|
| CZT HV Monitor | 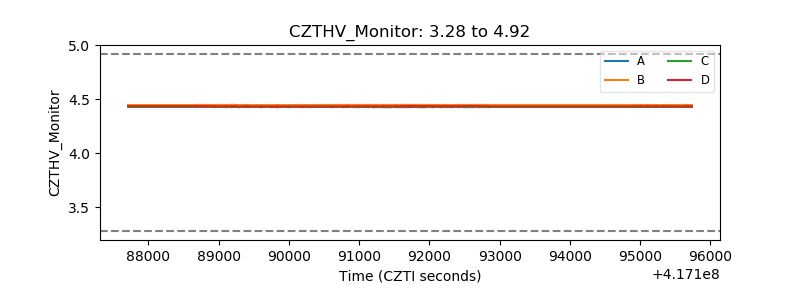 |
| D_VDD | 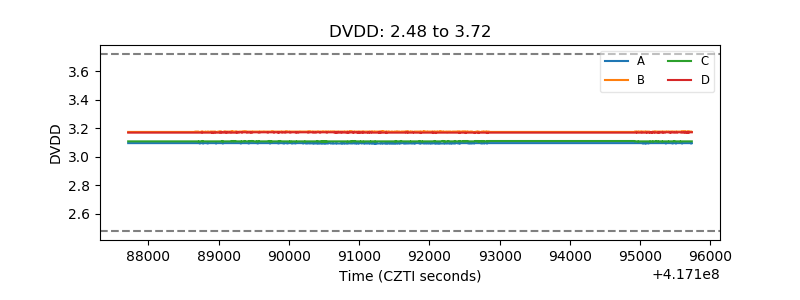 |
| Temperature 1 | 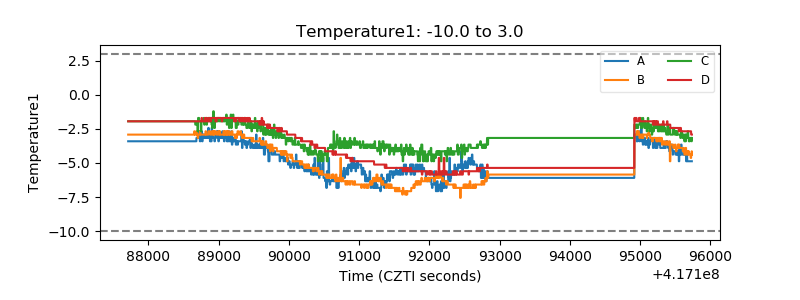 |
| Veto HV Monitor | 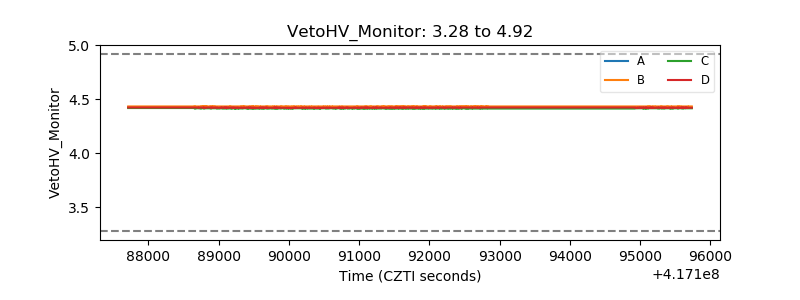 |
| Veto LLD | 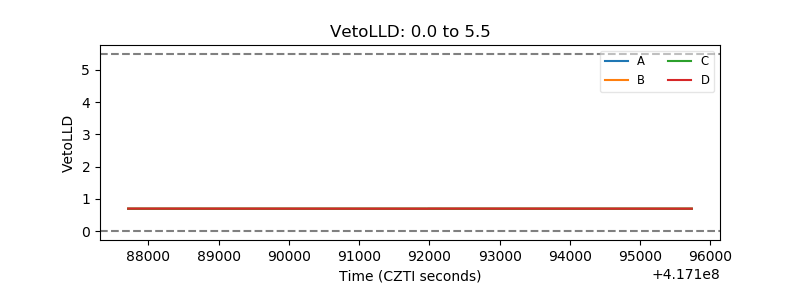 |
| Alpha Counter | 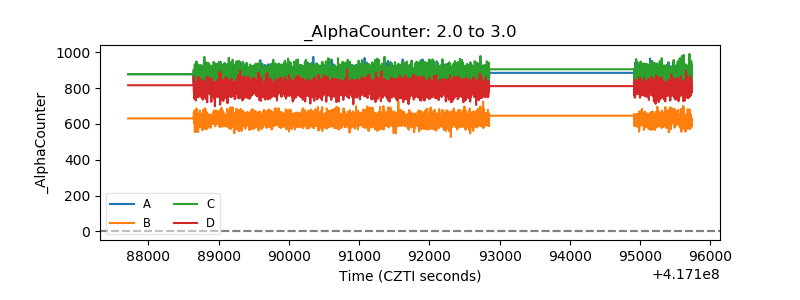 |
| _CPM_Rate | 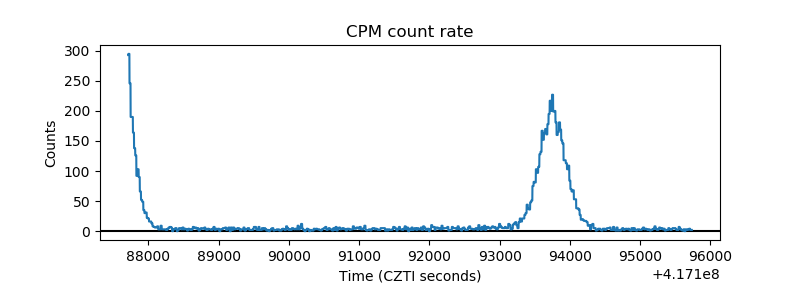 |
| CZT Counter | 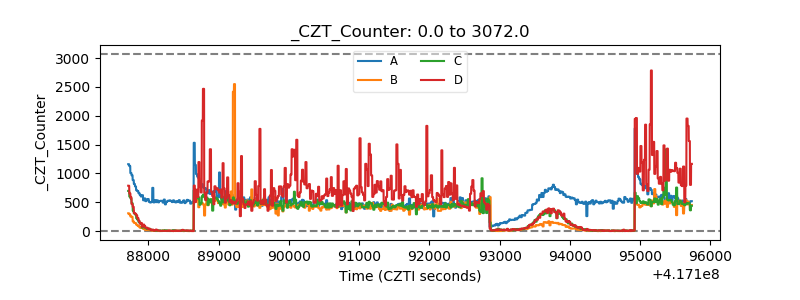 |
| +2.5 Volts monitor |  |
| +5 Volts monitor | 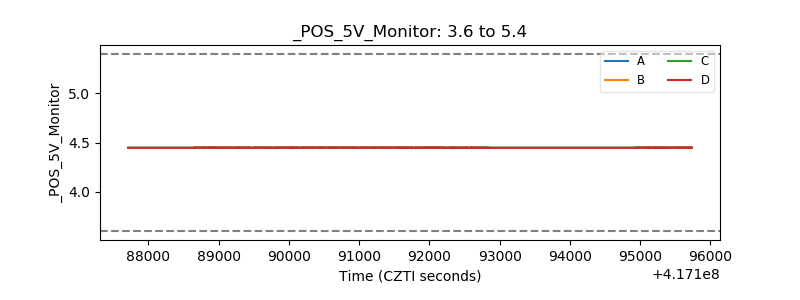 |
| _ROLL_ROT | 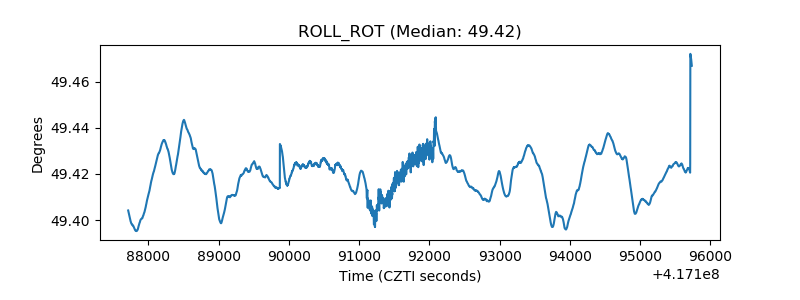 |
| _Roll_DEC | 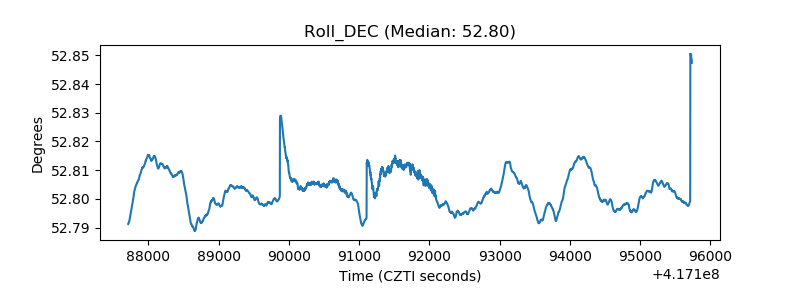 |
| _Roll_RA | 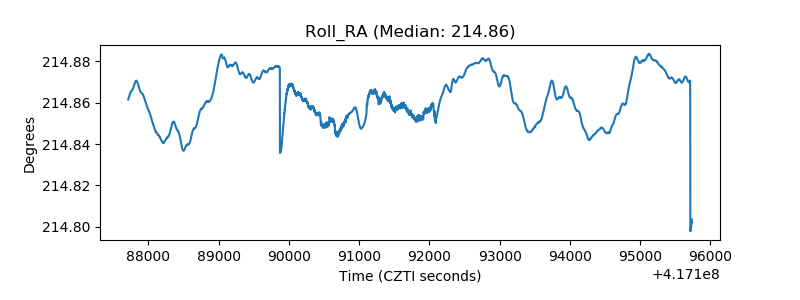 |
| Veto Counter | 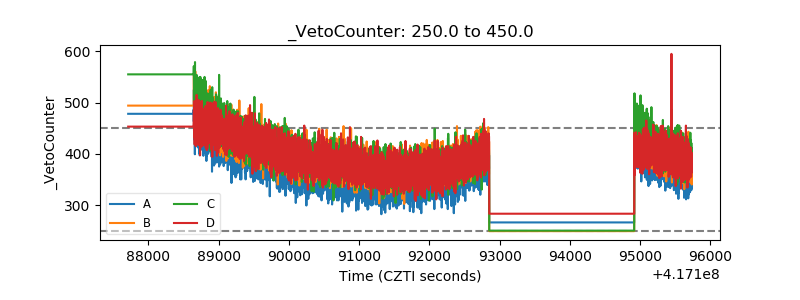 |