| Param | Original file | Final file |
|---|---|---|
| Filename | modeM0/AS1A12_022T01_9000005540_40449cztM0_level2.fits | modeM0/AS1A12_022T01_9000005540_40449cztM0_level2_quad_clean.evt |
| Size (bytes) | 344,269,440 | 85,282,560 |
| Size | 328.3 MB | 81.3 MB |
| Events in quadrant A | 2,692,858 | 591,163 |
| Events in quadrant B | 2,302,386 | 603,922 |
| Events in quadrant C | 2,652,863 | 576,329 |
| Events in quadrant D | 4,688,798 | 445,730 |
| Mode M0 | |||
|---|---|---|---|
| Quadrant | BADHDUFLAG | Total packets | Discarded packets |
| A | 0 | 11334 | 3 |
| B | 0 | 10486 | 2 |
| C | 0 | 11203 | 2 |
| D | 0 | 17577 | 2 |
| Mode M9 | |||
|---|---|---|---|
| Quadrant | BADHDUFLAG | Total packets | Discarded packets |
| A | 0 | 35 | 0 |
| B | 0 | 35 | 0 |
| C | 0 | 35 | 0 |
| D | 0 | 36 | 0 |
| Mode SS | |||
|---|---|---|---|
| Quadrant | BADHDUFLAG | Total packets | Discarded packets |
| A | 0 | 106 | 0 |
| B | 0 | 106 | 0 |
| C | 0 | 106 | 0 |
| D | 0 | 106 | 0 |
| Quadrant | Total seconds | Saturated seconds | Saturation percentage |
|---|---|---|---|
| A | 5215 | 17 | 0.325983% |
| B | 5215 | 5 | 0.095877% |
| C | 5215 | 29 | 0.556088% |
| D | 5215 | 1014 | 19.443912% |
Noise dominated data is calculated using 1-second bins in cleaned event files. If a bin has >2000 counts, and if more than 50% of those come from <1% of pixels, then it is considered to be noise-dominated and hence unusable.
| Quadrant | # 1 sec bins | Bins with >0 counts | Bins with >2000 counts | High rate bins dominated by noise | Noise dominated (total time) | Noise dominated (detector-on time) | Marked lightcurve |
|---|---|---|---|---|---|---|---|
| A | 7068 | 5216 | 3 | 3 | 0.04% | 0.06% | 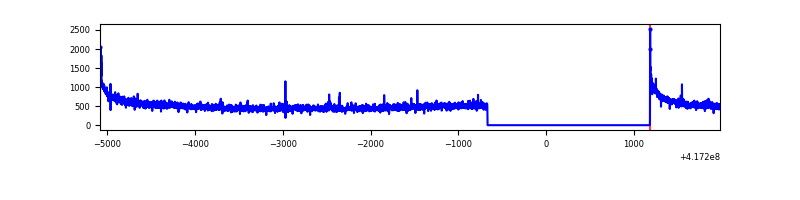 |
| B | 7068 | 5216 | 0 | 0 | 0.00% | 0.00% | 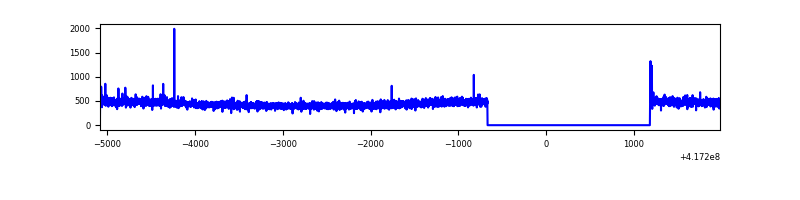 |
| C | 7068 | 5216 | 22 | 22 | 0.31% | 0.42% | 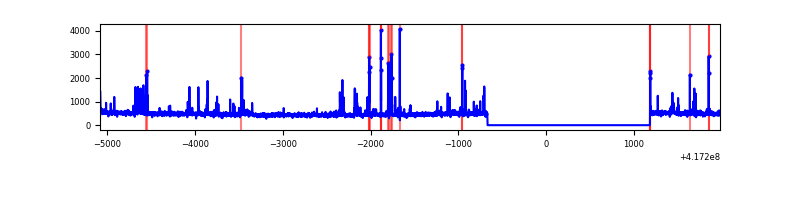 |
| D | 7067 | 5215 | 297 | 297 | 4.20% | 5.70% | 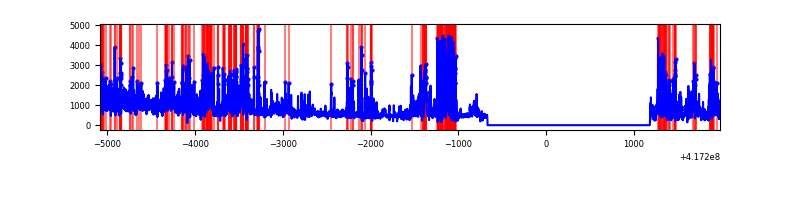 |
Top three noisy pixels from each quadrant. If the there are fewer than three noisy pixels in the level2.evt file, extra rows are filled as -1
| Pixel properties | Quadrant properties | ||||||
|---|---|---|---|---|---|---|---|
| Quadrant | DetID | PixID | Counts | Sigma | Mean | Median | Sigma |
| A | 10 | 83 | 471337 | 4076.25 | 564 | 554 | 115.5 |
| A | 12 | 189 | 11968 | 98.83 | 564 | 554 | 115.5 |
| A | 7 | 3 | 10285 | 84.26 | 564 | 554 | 115.5 |
| B | 3 | 112 | 70665 | 638.25 | 563 | 546 | 109.9 |
| B | 12 | 111 | 13745 | 120.14 | 563 | 546 | 109.9 |
| B | 11 | 111 | 12393 | 107.84 | 563 | 546 | 109.9 |
| C | 14 | 254 | 236456 | 1823.92 | 555 | 558 | 129.3 |
| C | 15 | 214 | 228096 | 1759.29 | 555 | 558 | 129.3 |
| C | 0 | 10 | 10588 | 77.55 | 555 | 558 | 129.3 |
| D | 12 | 227 | 1849721 | 14921.42 | 504 | 491 | 123.9 |
| D | 2 | 250 | 582402 | 4695.43 | 504 | 491 | 123.9 |
| D | 12 | 191 | 152954 | 1230.22 | 504 | 491 | 123.9 |
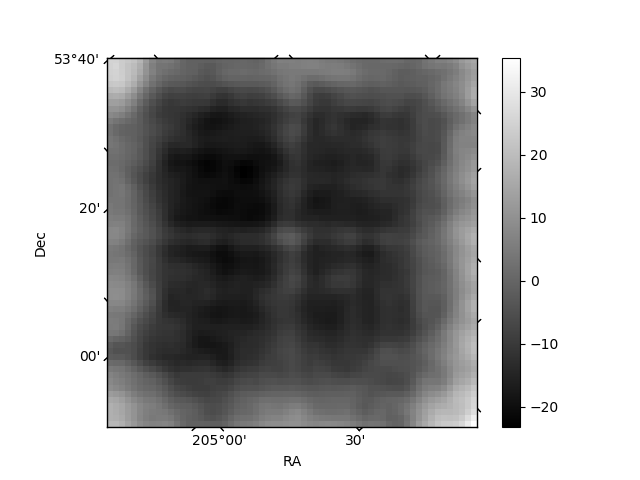
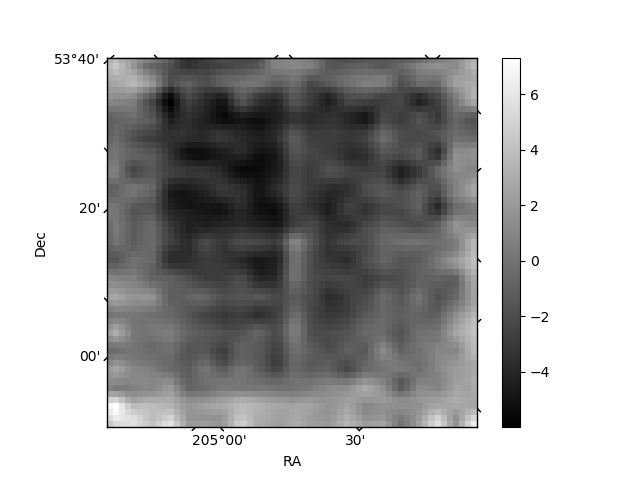
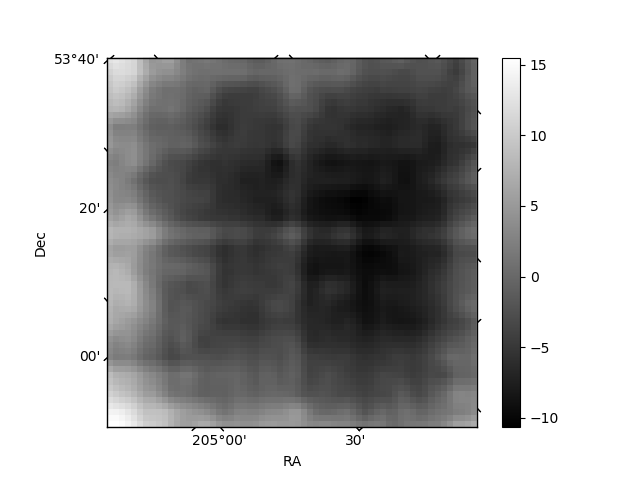
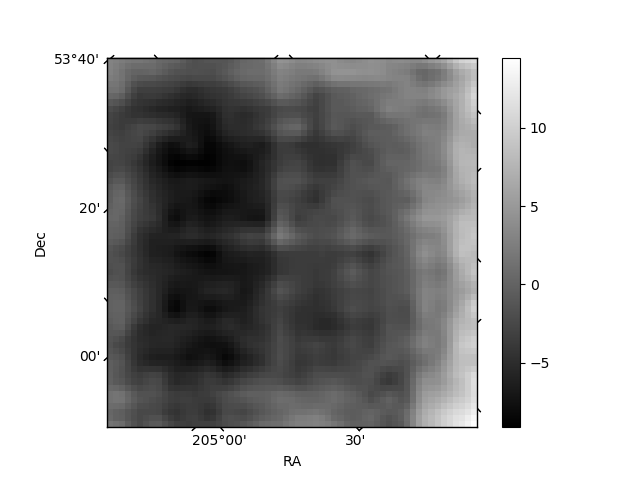
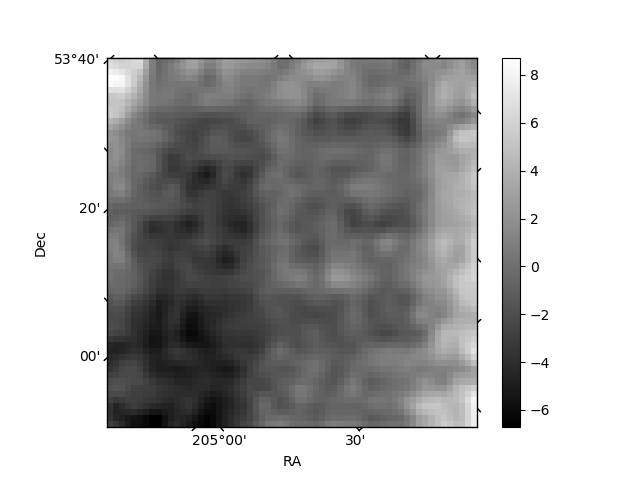
Histogram calculated using DETX and DETY for each event in the final _common_clean file
| Quadrant A | 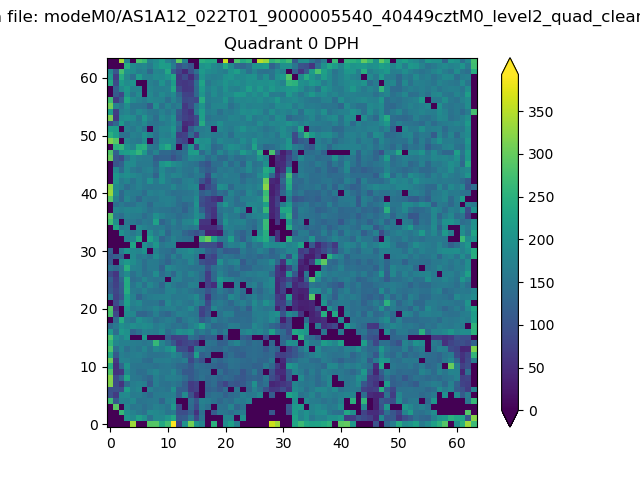 |
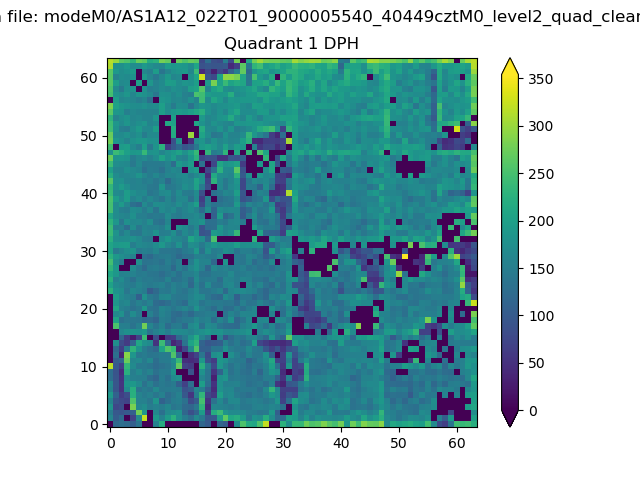 |
Quadrant B |
|---|---|---|---|
| Quadrant D | 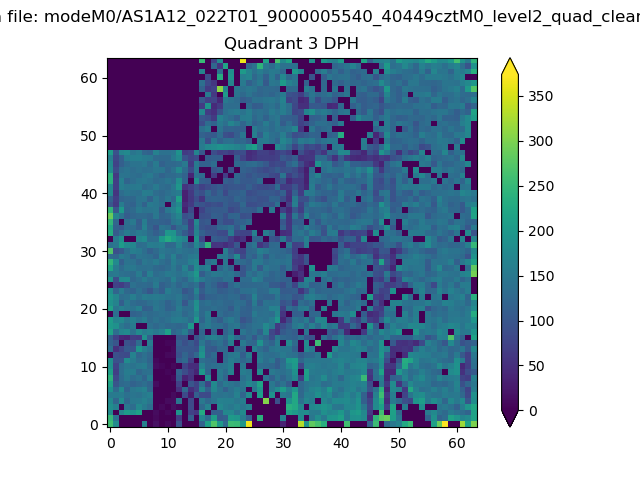 |
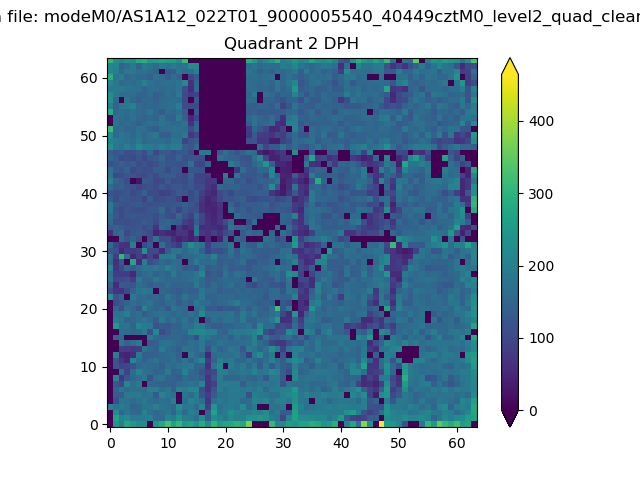 |
Quadrant C |
| Plot type | Count rate plots | Images |
|---|---|---|
| Comparison with Poisson distribution Blue bars denote a histogram of data divided into 1 sec bins. Red curve is a Poisson curve with rate = median count rate of data. |
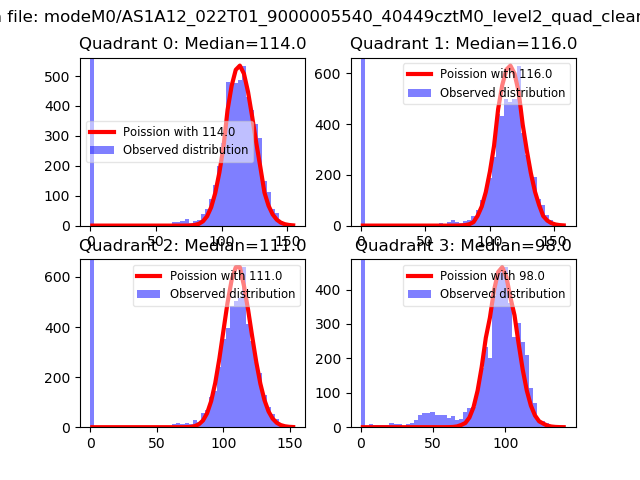 |
 |
| Quadrant-wise count rates Data is divided into 100 sec bins |
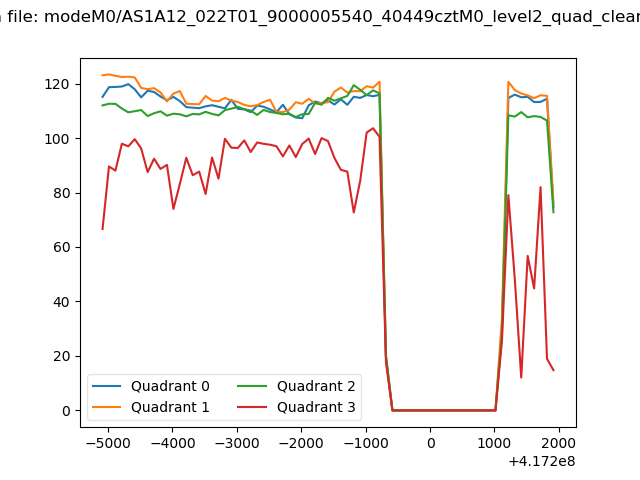 |
|
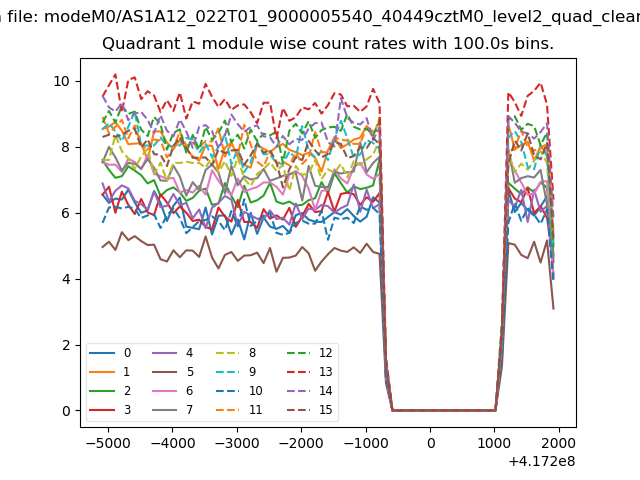
| Module-wise count rates for Quadrant A Data is divided into 100 sec bins |
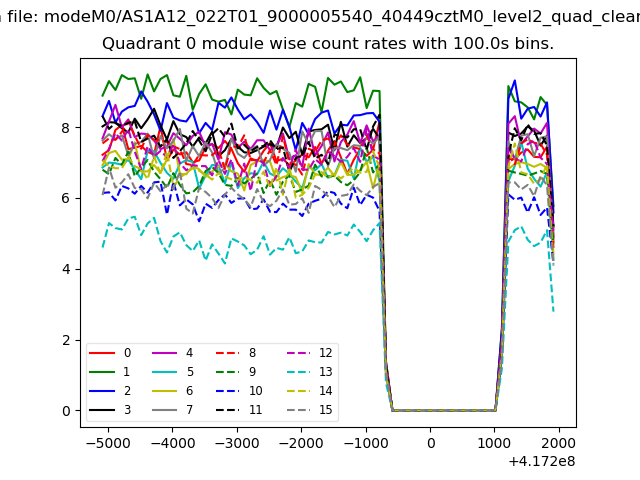 |
 |
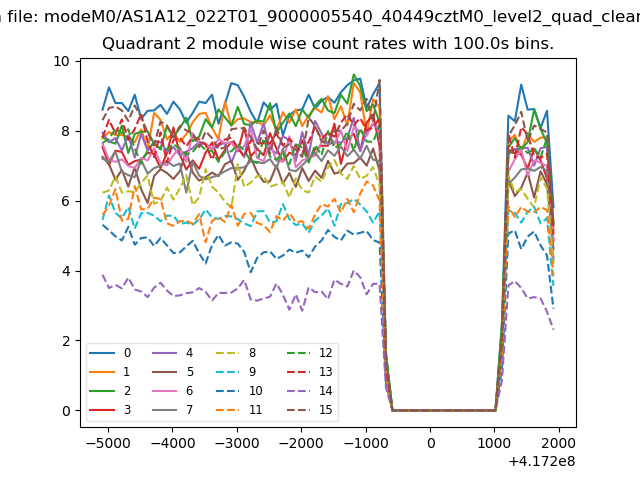
| Module-wise count rates for Quadrant B Data is divided into 100 sec bins |
 |
 |
| Module-wise count rates for Quadrant C Data is divided into 100 sec bins |
 |
 |
| Module-wise count rates for Quadrant D Data is divided into 100 sec bins |
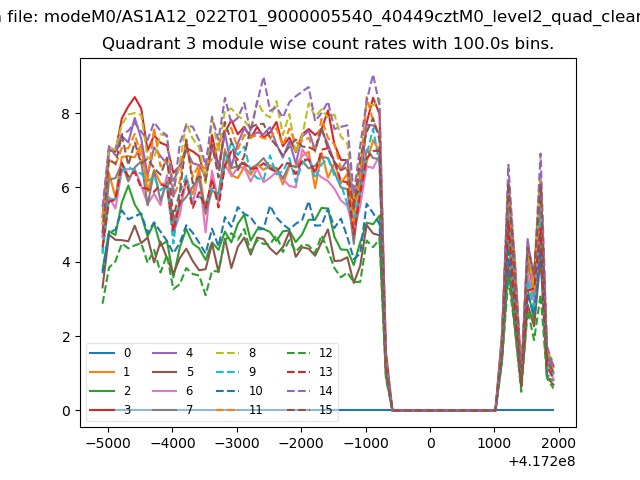 |
 |
| Parameter | Plot |
|---|---|
| CZT HV Monitor |  |
| D_VDD |  |
| Temperature 1 | 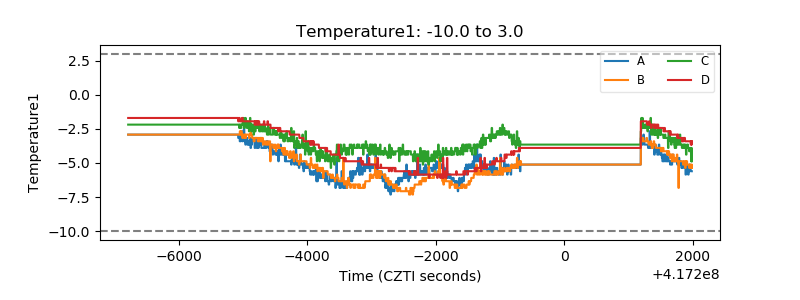 |
| Veto HV Monitor | 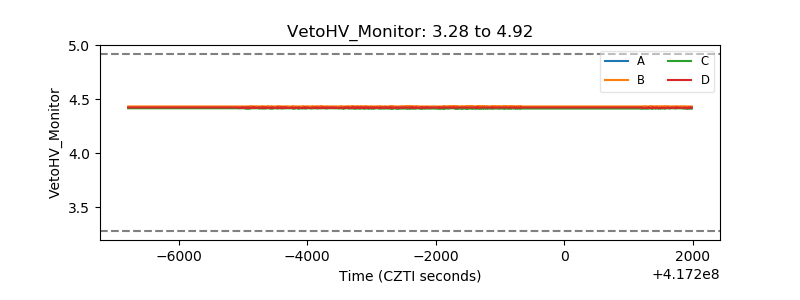 |
| Veto LLD | 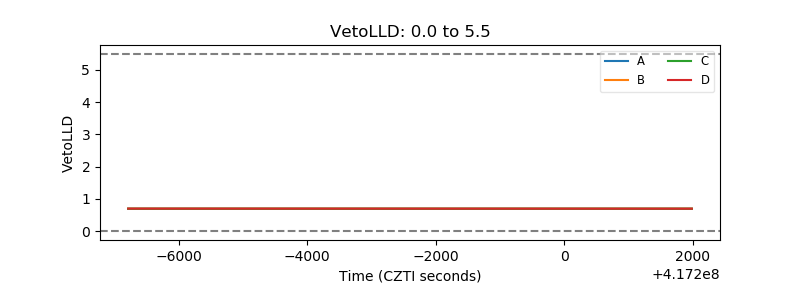 |
| Alpha Counter | 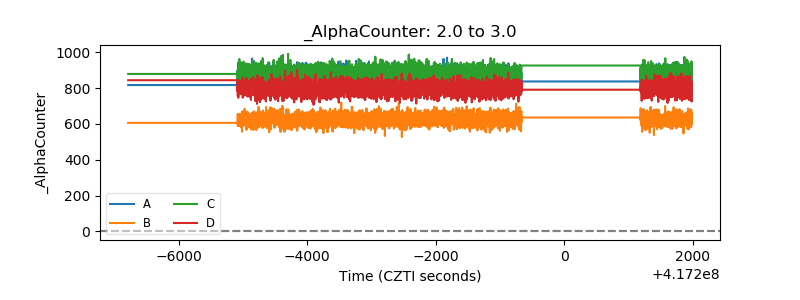 |
| _CPM_Rate | 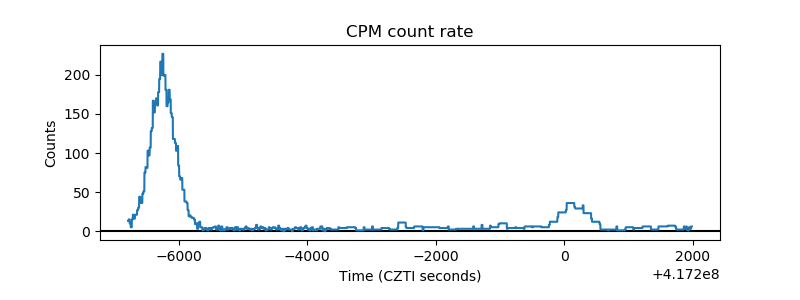 |
| CZT Counter | 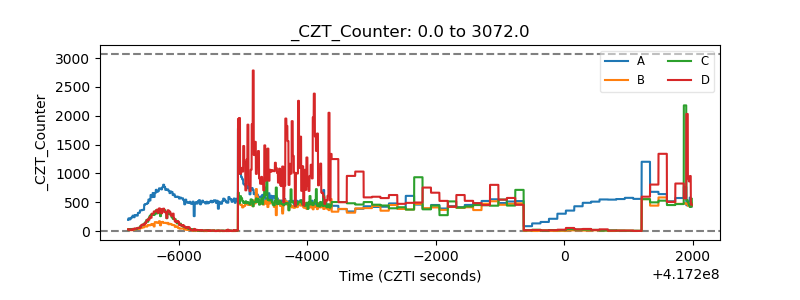 |
| +2.5 Volts monitor | 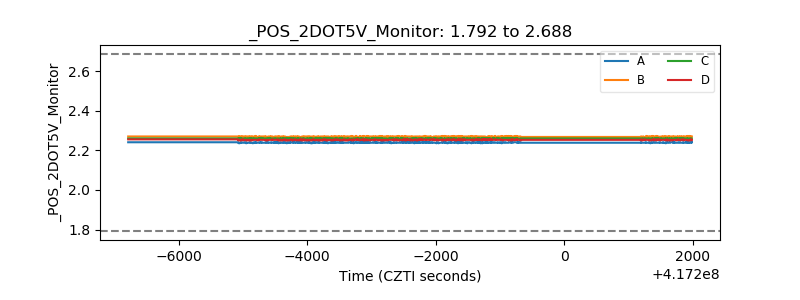 |
| +5 Volts monitor | 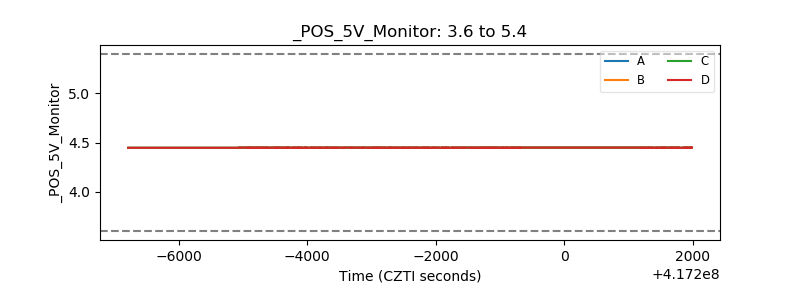 |
| _ROLL_ROT | 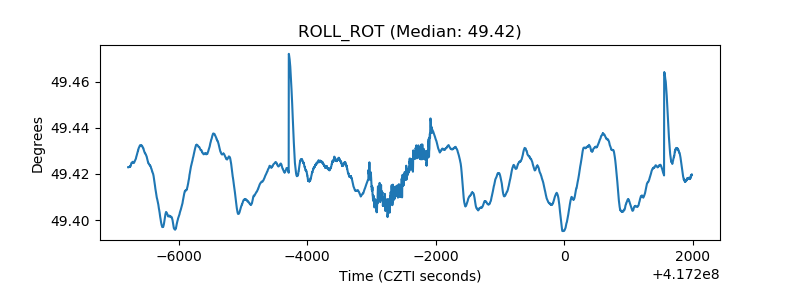 |
| _Roll_DEC | 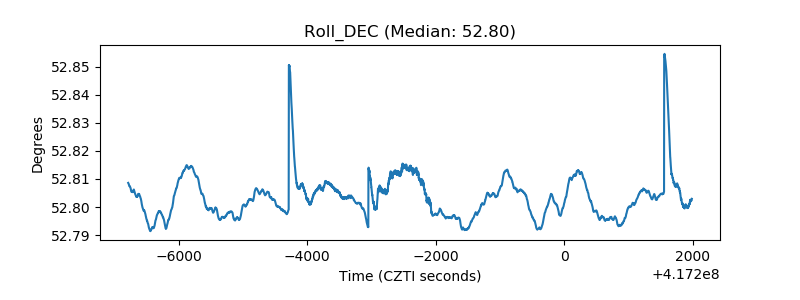 |
| _Roll_RA | 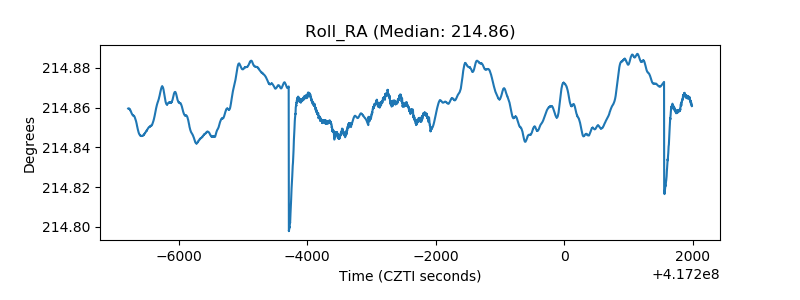 |
| Veto Counter | 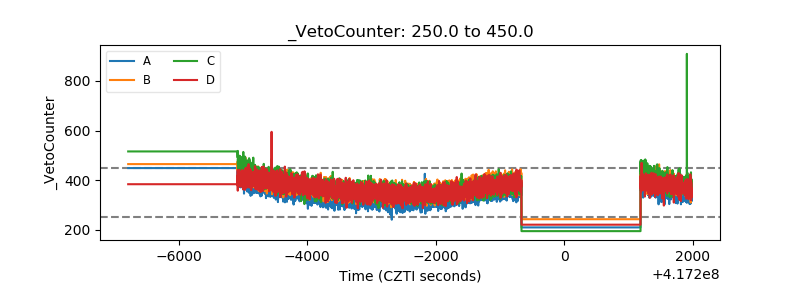 |