| Param | Original file | Final file |
|---|---|---|
| Filename | modeM0/AS1A12_022T01_9000005540_40450cztM0_level2.fits | modeM0/AS1A12_022T01_9000005540_40450cztM0_level2_quad_clean.evt |
| Size (bytes) | 415,828,800 | 87,920,640 |
| Size | 396.6 MB | 83.8 MB |
| Events in quadrant A | 2,904,158 | 629,266 |
| Events in quadrant B | 2,601,106 | 643,430 |
| Events in quadrant C | 2,733,129 | 618,442 |
| Events in quadrant D | 6,710,635 | 373,310 |
| Mode M0 | |||
|---|---|---|---|
| Quadrant | BADHDUFLAG | Total packets | Discarded packets |
| A | 0 | 12271 | 3 |
| B | 0 | 11609 | 2 |
| C | 0 | 11853 | 2 |
| D | 0 | 23835 | 2 |
| Mode M9 | |||
|---|---|---|---|
| Quadrant | BADHDUFLAG | Total packets | Discarded packets |
| A | 0 | 29 | 0 |
| B | 0 | 29 | 0 |
| C | 0 | 29 | 0 |
| D | 0 | 30 | 0 |
| Mode SS | |||
|---|---|---|---|
| Quadrant | BADHDUFLAG | Total packets | Discarded packets |
| A | 0 | 116 | 0 |
| B | 0 | 116 | 0 |
| C | 0 | 116 | 0 |
| D | 0 | 116 | 0 |
| Quadrant | Total seconds | Saturated seconds | Saturation percentage |
|---|---|---|---|
| A | 5683 | 12 | 0.211156% |
| B | 5683 | 4 | 0.070385% |
| C | 5683 | 23 | 0.404716% |
| D | 5683 | 2234 | 39.310223% |
Noise dominated data is calculated using 1-second bins in cleaned event files. If a bin has >2000 counts, and if more than 50% of those come from <1% of pixels, then it is considered to be noise-dominated and hence unusable.
| Quadrant | # 1 sec bins | Bins with >0 counts | Bins with >2000 counts | High rate bins dominated by noise | Noise dominated (total time) | Noise dominated (detector-on time) | Marked lightcurve |
|---|---|---|---|---|---|---|---|
| A | 7176 | 5684 | 5 | 5 | 0.07% | 0.09% | 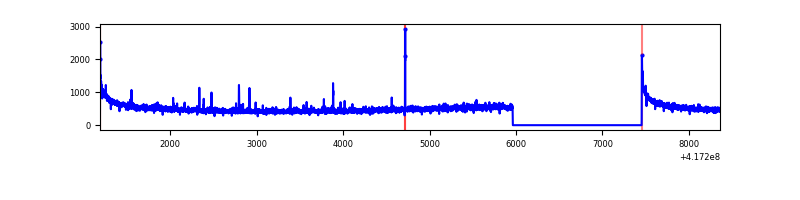 |
| B | 7176 | 5684 | 1 | 1 | 0.01% | 0.02% | 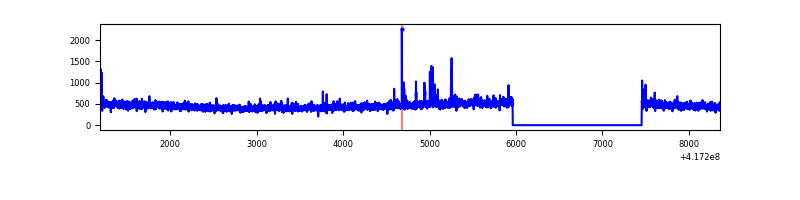 |
| C | 7176 | 5684 | 14 | 14 | 0.20% | 0.25% | 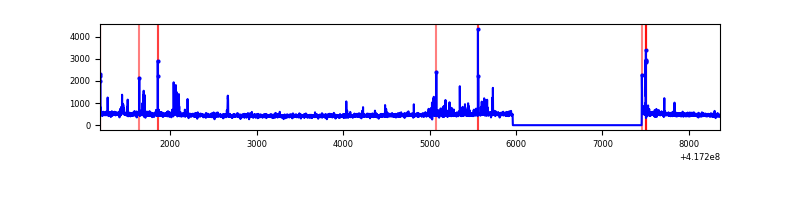 |
| D | 7176 | 5684 | 1264 | 1264 | 17.61% | 22.24% | 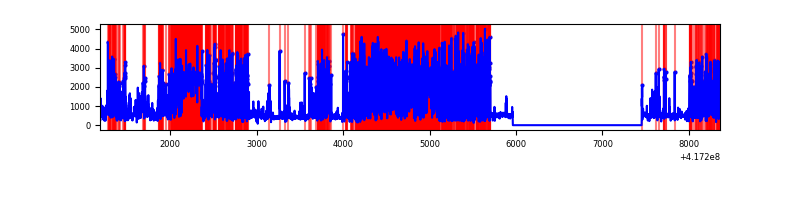 |
Top three noisy pixels from each quadrant. If the there are fewer than three noisy pixels in the level2.evt file, extra rows are filled as -1
| Pixel properties | Quadrant properties | ||||||
|---|---|---|---|---|---|---|---|
| Quadrant | DetID | PixID | Counts | Sigma | Mean | Median | Sigma |
| A | 10 | 83 | 505223 | 4069.61 | 606 | 594 | 124.0 |
| A | 2 | 79 | 33788 | 267.69 | 606 | 594 | 124.0 |
| A | 3 | 1 | 7844 | 58.47 | 606 | 594 | 124.0 |
| B | 3 | 112 | 183545 | 1549.39 | 605 | 588 | 118.1 |
| B | 4 | 171 | 26636 | 220.59 | 605 | 588 | 118.1 |
| B | 12 | 111 | 14766 | 120.07 | 605 | 588 | 118.1 |
| C | 15 | 214 | 246835 | 1768.47 | 597 | 600 | 139.2 |
| C | 14 | 254 | 133707 | 955.98 | 597 | 600 | 139.2 |
| C | 0 | 10 | 13249 | 90.85 | 597 | 600 | 139.2 |
| D | 2 | 250 | 2509256 | 21259.75 | 475 | 460 | 118.0 |
| D | 12 | 227 | 2150849 | 18222.58 | 475 | 460 | 118.0 |
| D | 12 | 191 | 153499 | 1296.87 | 475 | 460 | 118.0 |
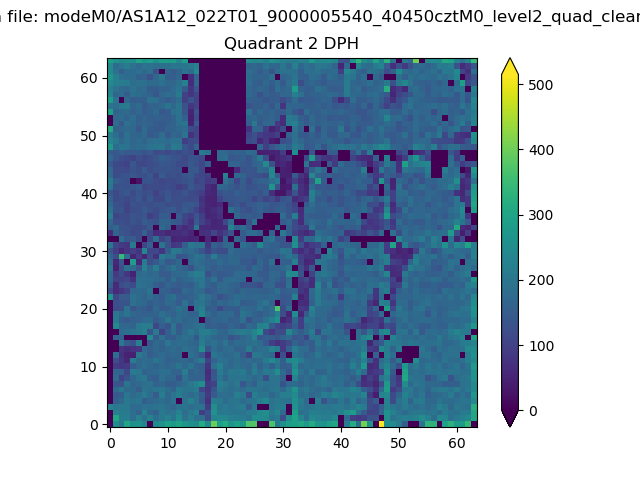
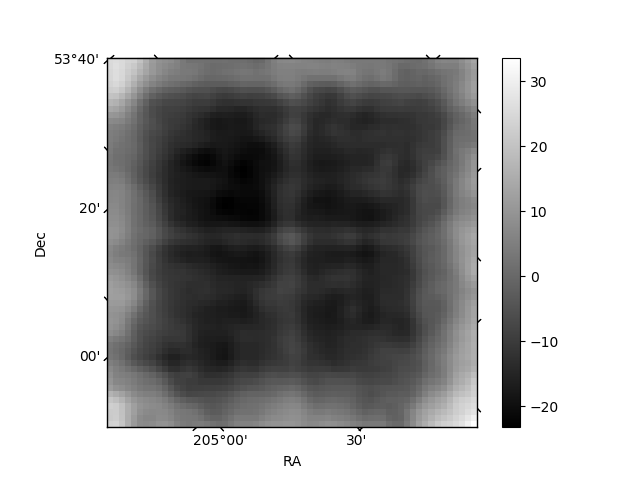
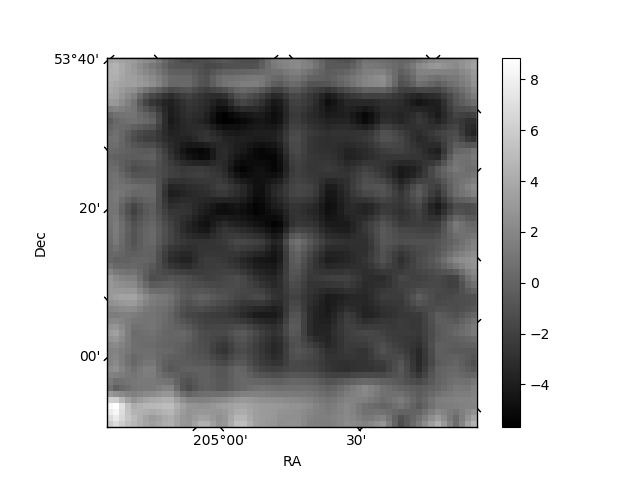
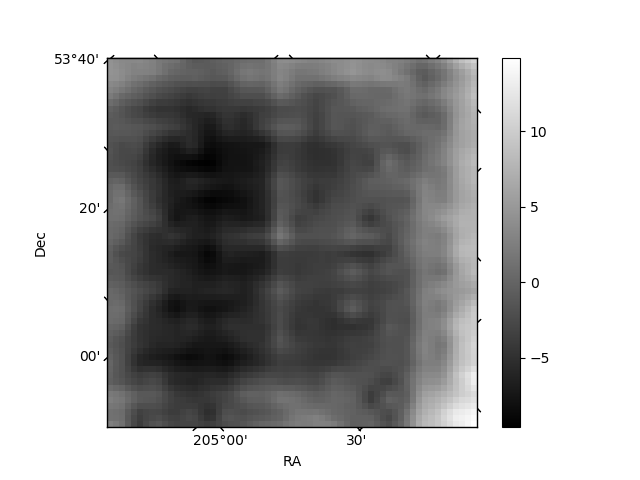
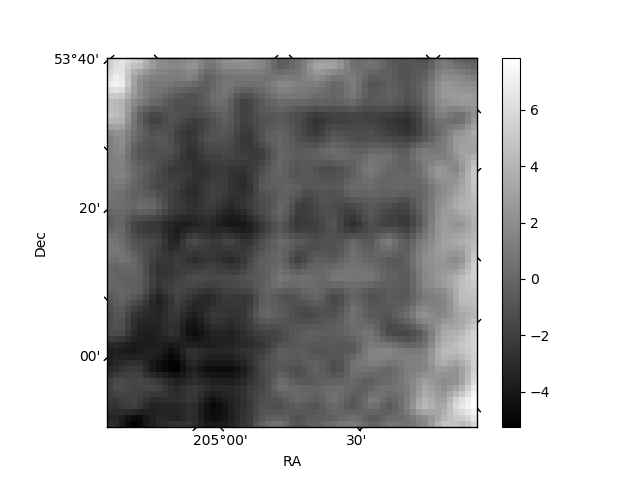
Histogram calculated using DETX and DETY for each event in the final _common_clean file
| Quadrant A | 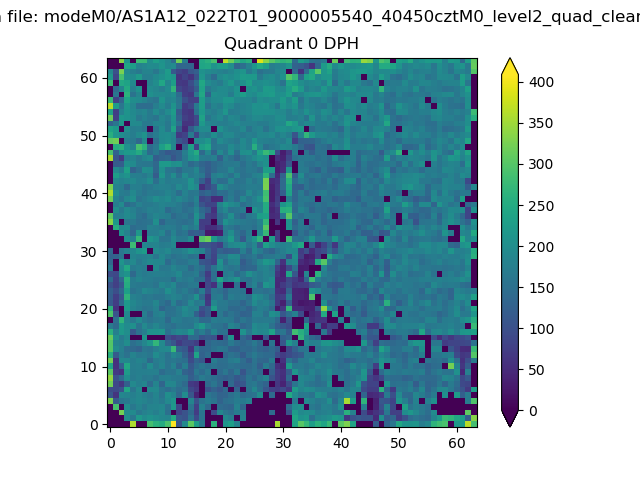 |
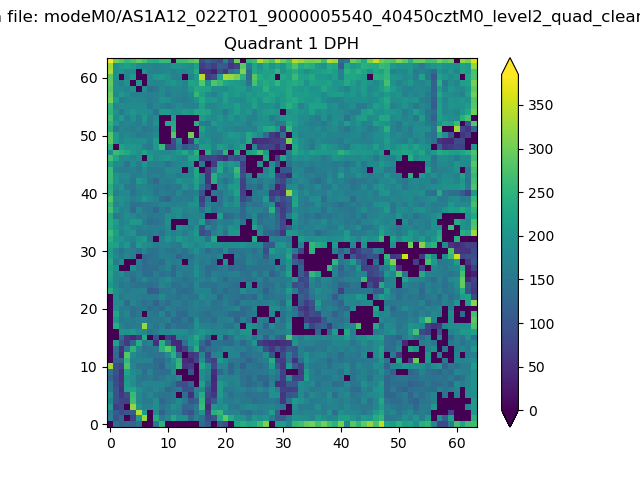 |
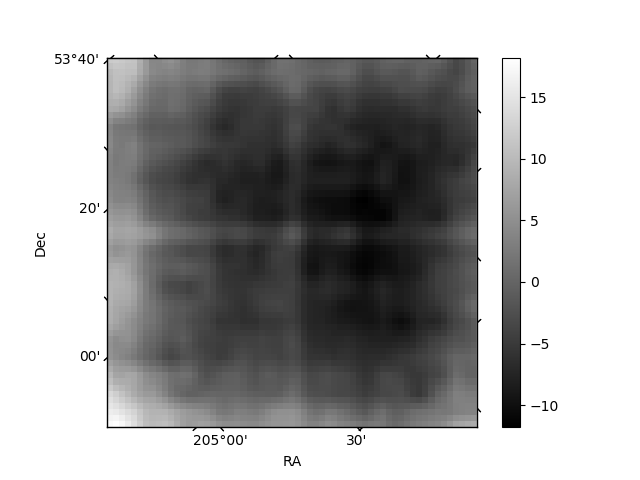
Quadrant B |
|---|---|---|---|
| Quadrant D | 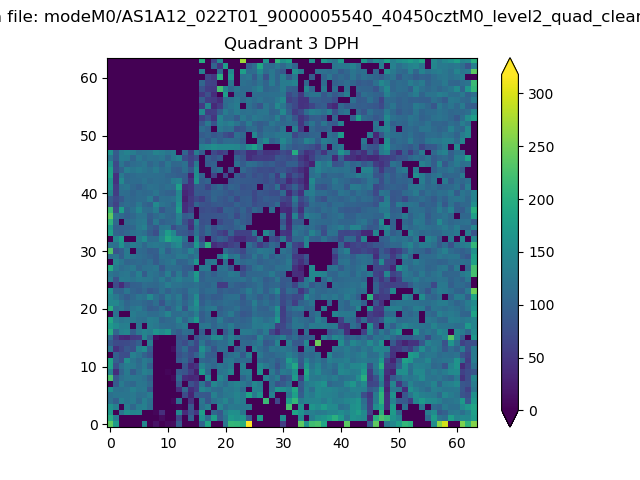 |
 |
Quadrant C |
| Plot type | Count rate plots | Images |
|---|---|---|
| Comparison with Poisson distribution Blue bars denote a histogram of data divided into 1 sec bins. Red curve is a Poisson curve with rate = median count rate of data. |
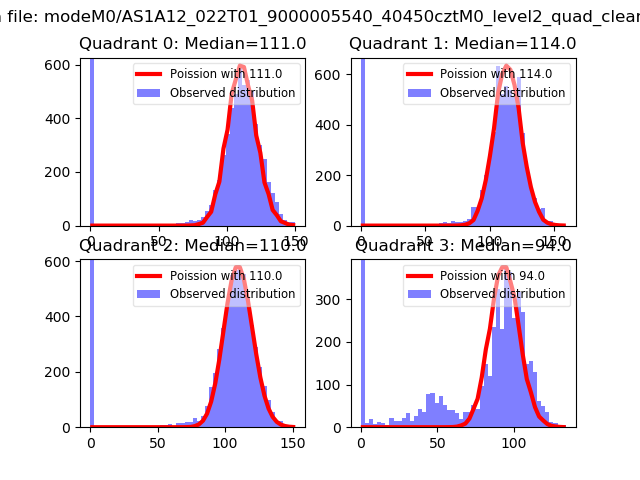 |
 |
| Quadrant-wise count rates Data is divided into 100 sec bins |
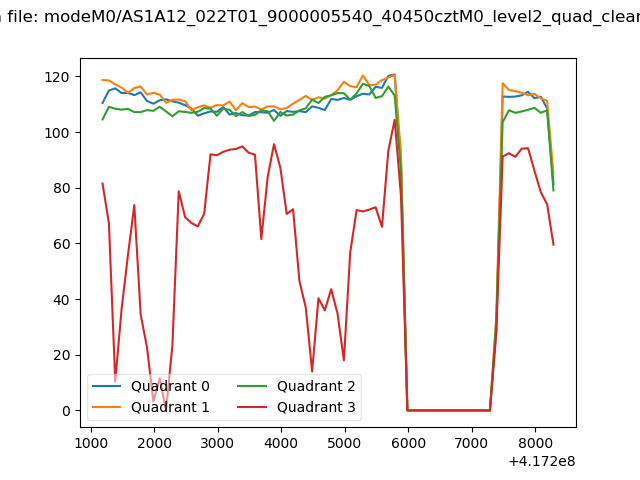 |
|
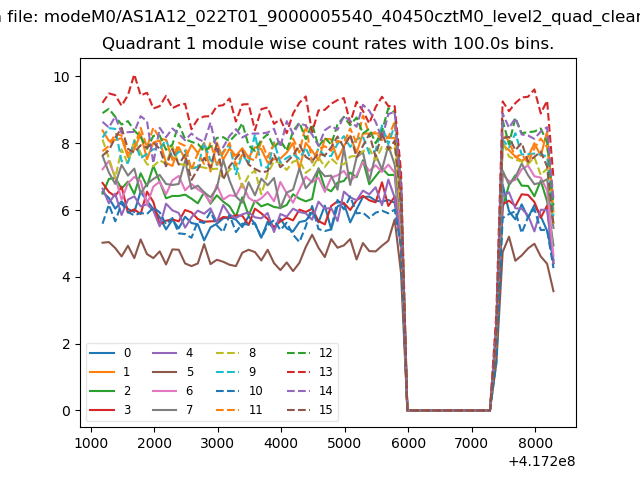
| Module-wise count rates for Quadrant A Data is divided into 100 sec bins |
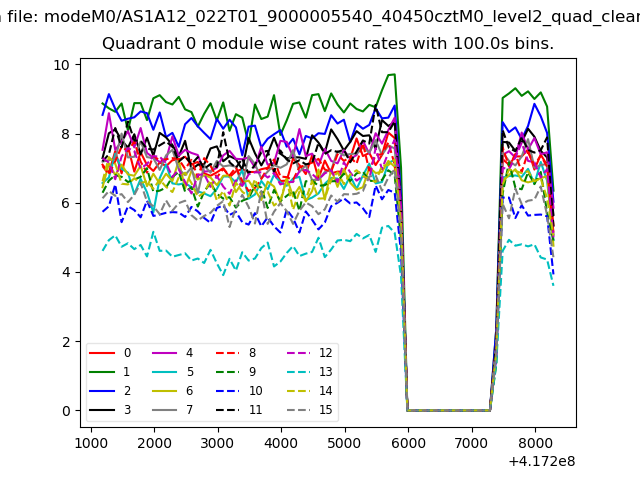 |
 |
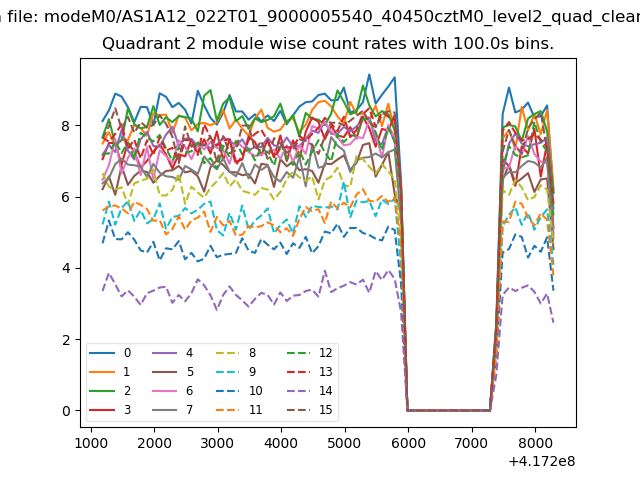
| Module-wise count rates for Quadrant B Data is divided into 100 sec bins |
 |
 |
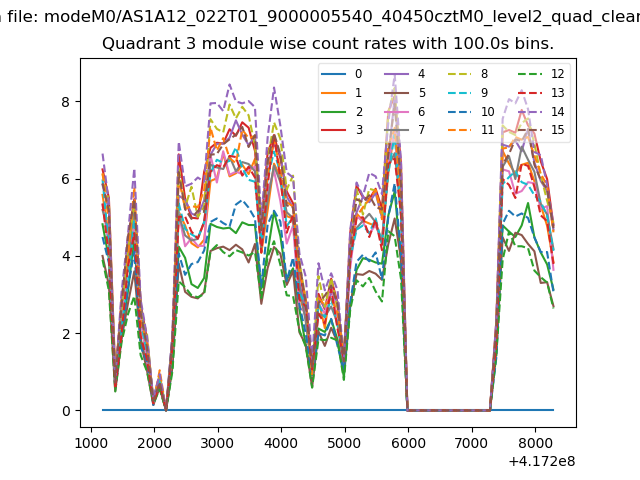
| Module-wise count rates for Quadrant C Data is divided into 100 sec bins |
 |
 |
| Module-wise count rates for Quadrant D Data is divided into 100 sec bins |
 |
 |
| Parameter | Plot |
|---|---|
| CZT HV Monitor | 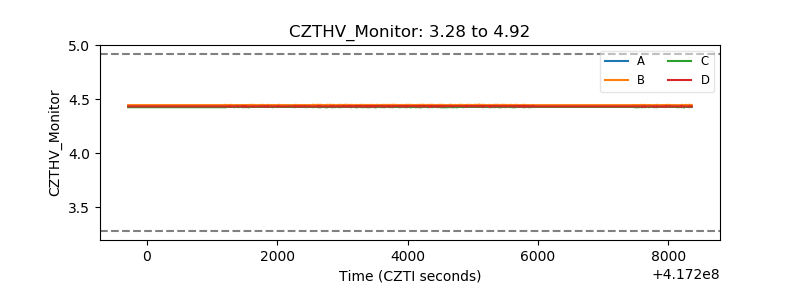 |
| D_VDD | 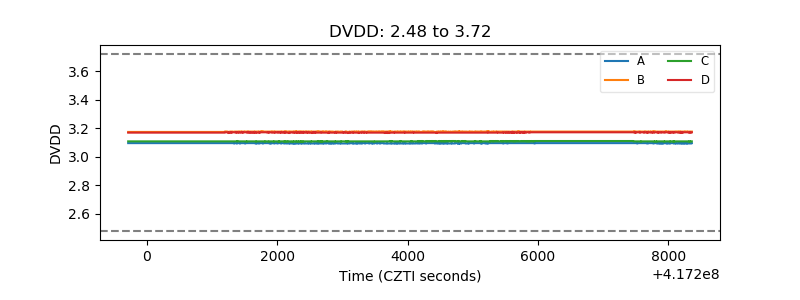 |
| Temperature 1 | 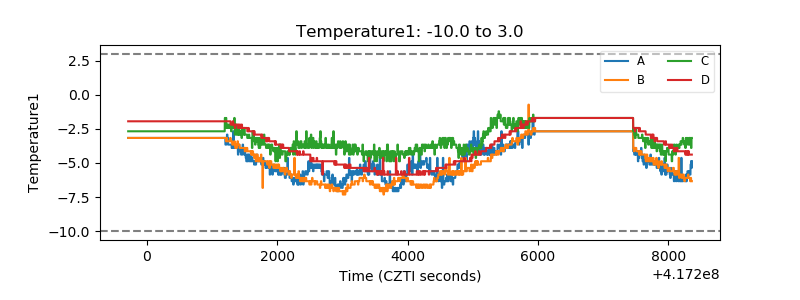 |
| Veto HV Monitor | 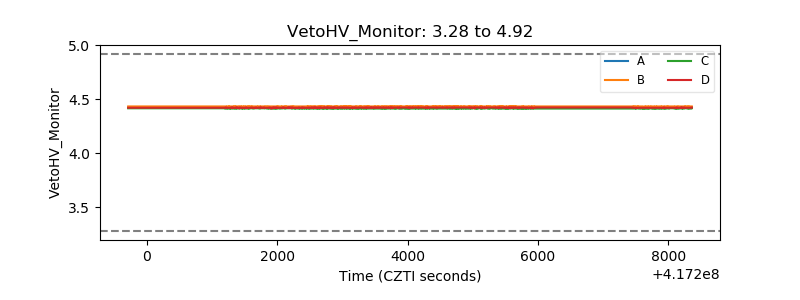 |
| Veto LLD | 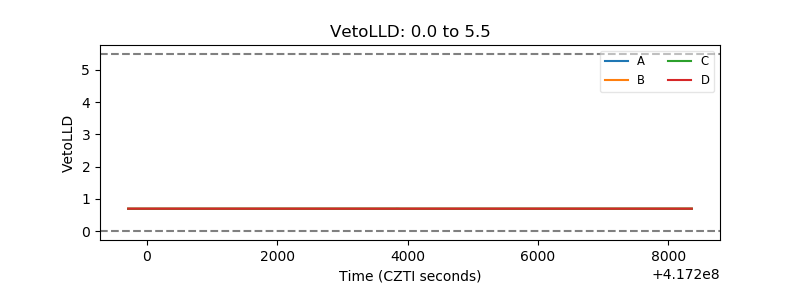 |
| Alpha Counter | 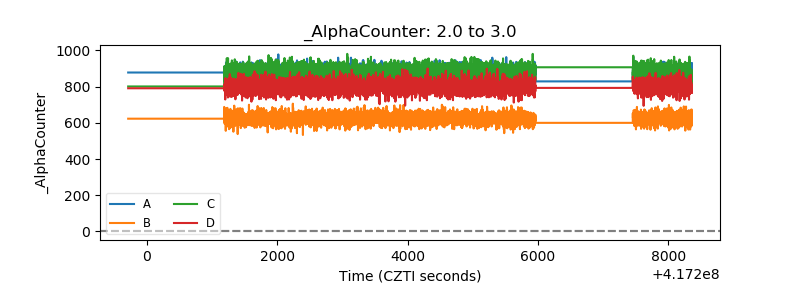 |
| _CPM_Rate | 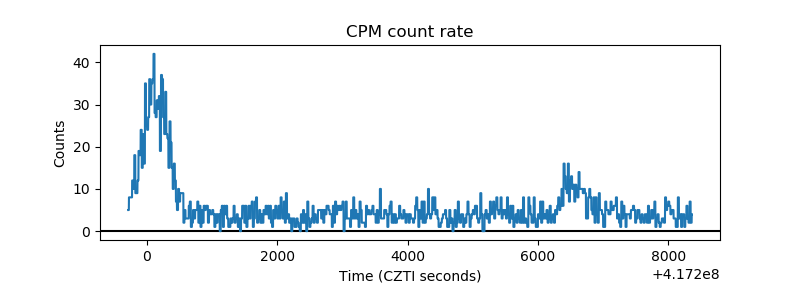 |
| CZT Counter | 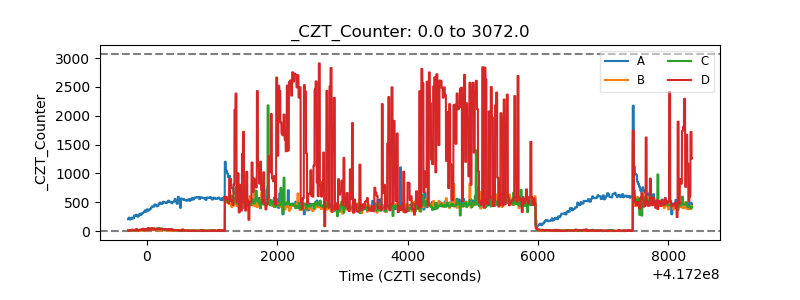 |
| +2.5 Volts monitor | 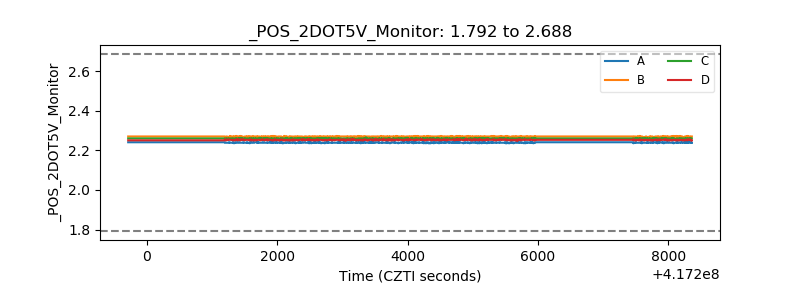 |
| +5 Volts monitor | 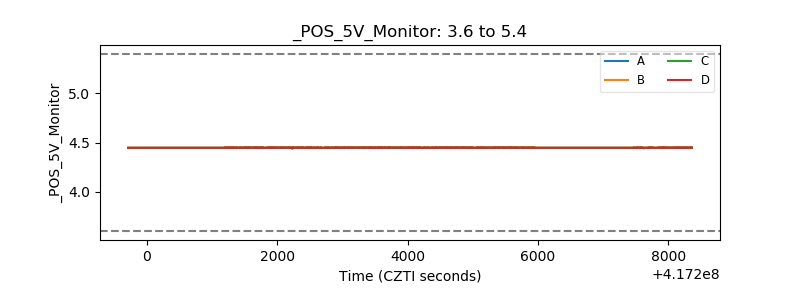 |
| _ROLL_ROT | 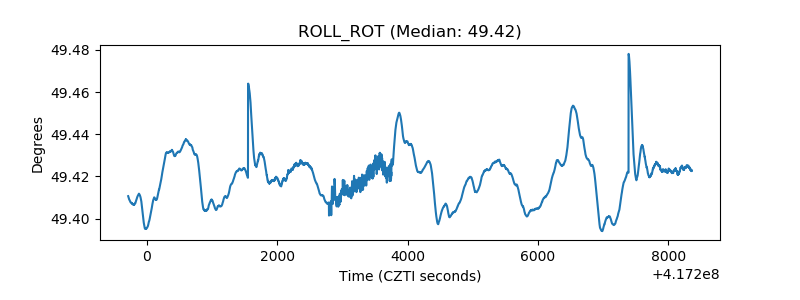 |
| _Roll_DEC | 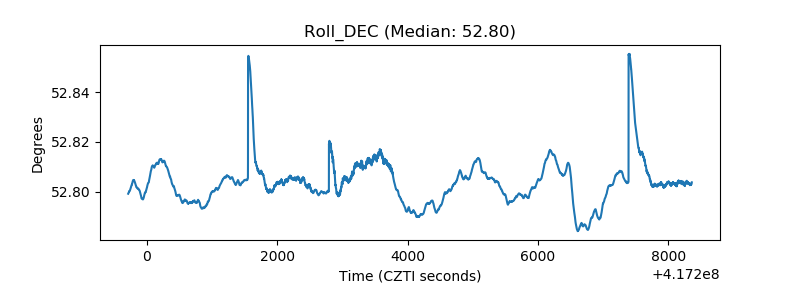 |
| _Roll_RA | 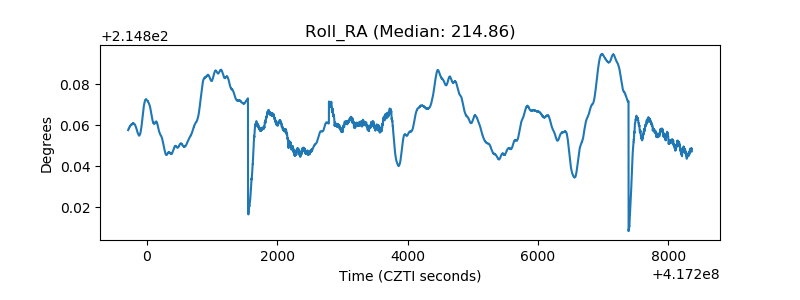 |
| Veto Counter | 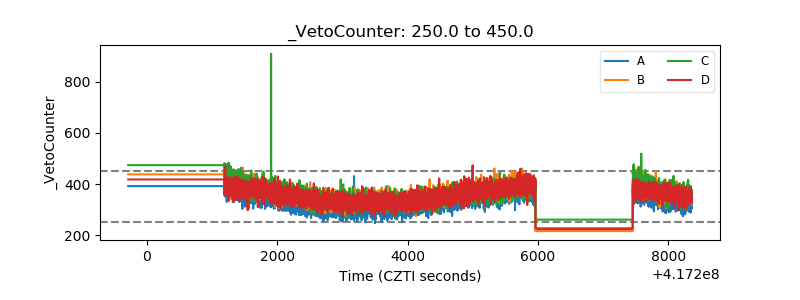 |