| Param | Original file | Final file |
|---|---|---|
| Filename | modeM0/AS1A12_022T01_9000005540_40451cztM0_level2.fits | modeM0/AS1A12_022T01_9000005540_40451cztM0_level2_quad_clean.evt |
| Size (bytes) | 328,101,120 | 91,609,920 |
| Size | 312.9 MB | 87.4 MB |
| Events in quadrant A | 2,913,965 | 624,309 |
| Events in quadrant B | 2,647,661 | 638,727 |
| Events in quadrant C | 2,733,686 | 616,018 |
| Events in quadrant D | 3,401,030 | 493,036 |
| Mode M0 | |||
|---|---|---|---|
| Quadrant | BADHDUFLAG | Total packets | Discarded packets |
| A | 0 | 12387 | 3 |
| B | 0 | 11820 | 2 |
| C | 0 | 11940 | 2 |
| D | 0 | 14147 | 2 |
| Mode M9 | |||
|---|---|---|---|
| Quadrant | BADHDUFLAG | Total packets | Discarded packets |
| A | 0 | 24 | 0 |
| B | 0 | 24 | 0 |
| C | 0 | 24 | 0 |
| D | 0 | 25 | 0 |
| Mode SS | |||
|---|---|---|---|
| Quadrant | BADHDUFLAG | Total packets | Discarded packets |
| A | 0 | 116 | 0 |
| B | 0 | 116 | 0 |
| C | 0 | 116 | 0 |
| D | 0 | 116 | 0 |
| Quadrant | Total seconds | Saturated seconds | Saturation percentage |
|---|---|---|---|
| A | 5748 | 15 | 0.260960% |
| B | 5748 | 18 | 0.313152% |
| C | 5748 | 17 | 0.295755% |
| D | 5748 | 896 | 15.588031% |
Noise dominated data is calculated using 1-second bins in cleaned event files. If a bin has >2000 counts, and if more than 50% of those come from <1% of pixels, then it is considered to be noise-dominated and hence unusable.
| Quadrant | # 1 sec bins | Bins with >0 counts | Bins with >2000 counts | High rate bins dominated by noise | Noise dominated (total time) | Noise dominated (detector-on time) | Marked lightcurve |
|---|---|---|---|---|---|---|---|
| A | 7091 | 5749 | 6 | 6 | 0.08% | 0.10% | 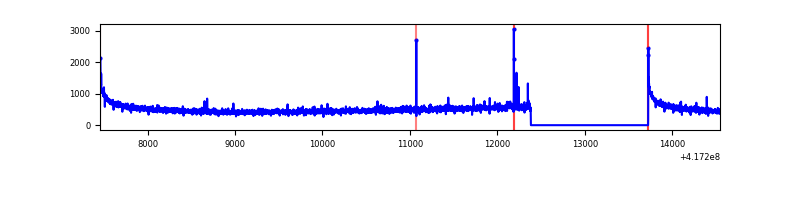 |
| B | 7091 | 5749 | 5 | 5 | 0.07% | 0.09% | 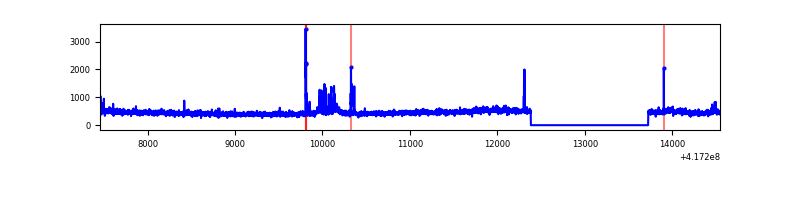 |
| C | 7091 | 5749 | 11 | 11 | 0.16% | 0.19% | 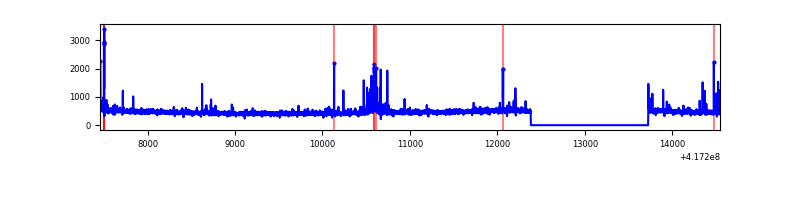 |
| D | 7091 | 5749 | 152 | 152 | 2.14% | 2.64% | 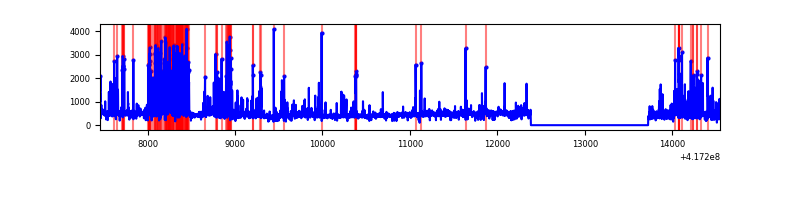 |
Top three noisy pixels from each quadrant. If the there are fewer than three noisy pixels in the level2.evt file, extra rows are filled as -1
| Pixel properties | Quadrant properties | ||||||
|---|---|---|---|---|---|---|---|
| Quadrant | DetID | PixID | Counts | Sigma | Mean | Median | Sigma |
| A | 10 | 83 | 503061 | 4040.2 | 610 | 597 | 124.4 |
| A | 7 | 3 | 20091 | 156.75 | 610 | 597 | 124.4 |
| A | 12 | 189 | 15018 | 115.96 | 610 | 597 | 124.4 |
| B | 3 | 112 | 124452 | 1051.36 | 607 | 591 | 117.8 |
| B | 4 | 171 | 93673 | 790.1 | 607 | 591 | 117.8 |
| B | 0 | 230 | 34474 | 287.61 | 607 | 591 | 117.8 |
| C | 15 | 214 | 246829 | 1760.41 | 599 | 604 | 139.9 |
| C | 14 | 254 | 93258 | 662.44 | 599 | 604 | 139.9 |
| C | 10 | 20 | 44304 | 312.44 | 599 | 604 | 139.9 |
| D | 12 | 227 | 838661 | 6273.47 | 546 | 532 | 133.6 |
| D | 12 | 191 | 195005 | 1455.65 | 546 | 532 | 133.6 |
| D | 2 | 250 | 71708 | 532.76 | 546 | 532 | 133.6 |
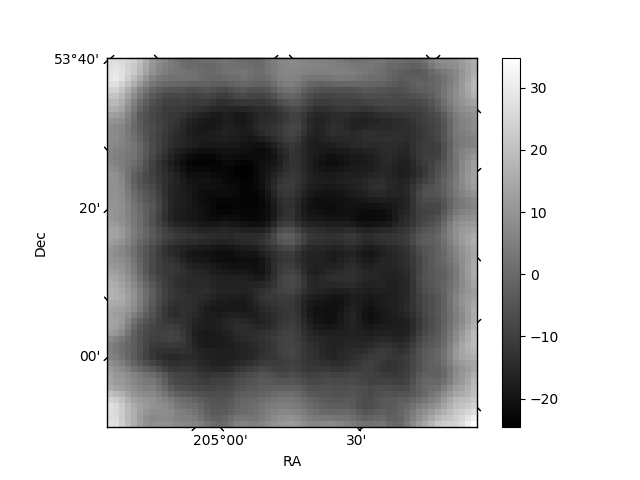
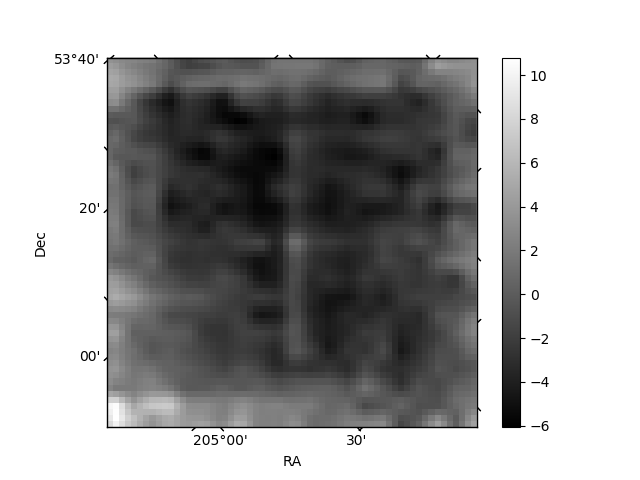
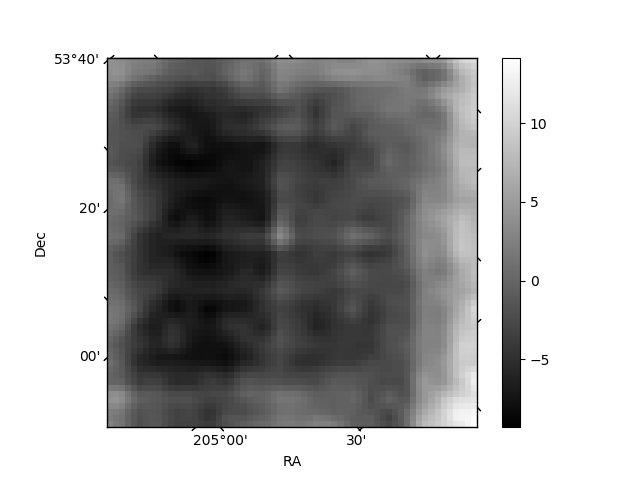
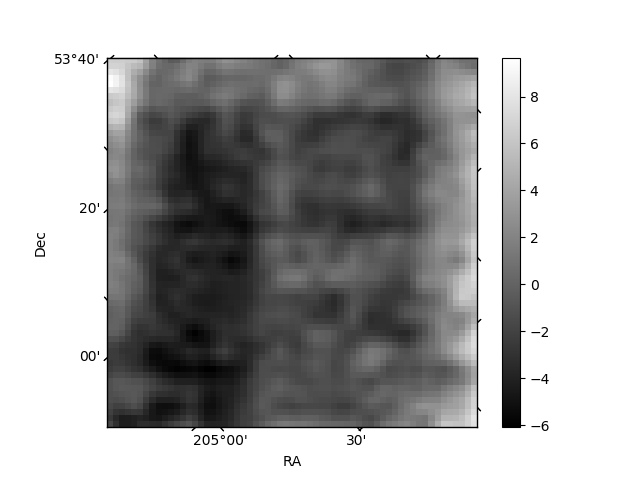
Histogram calculated using DETX and DETY for each event in the final _common_clean file
| Quadrant A | 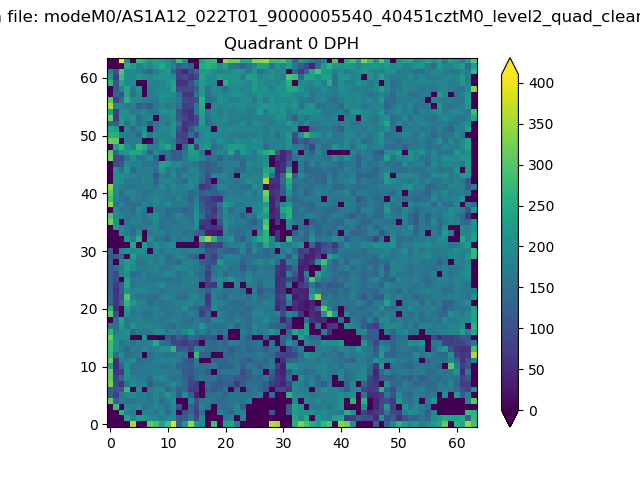 |
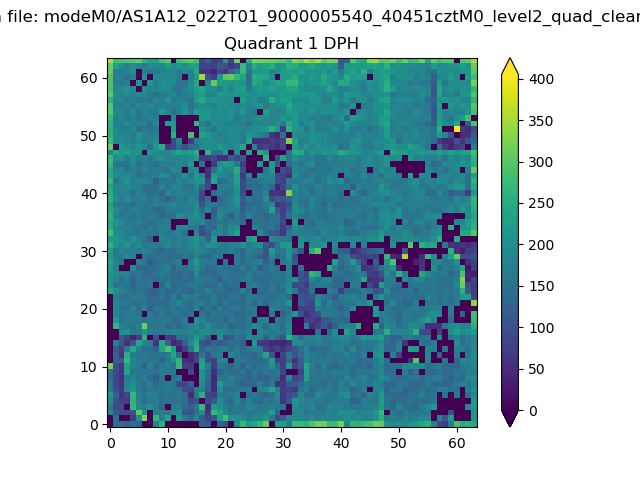 |
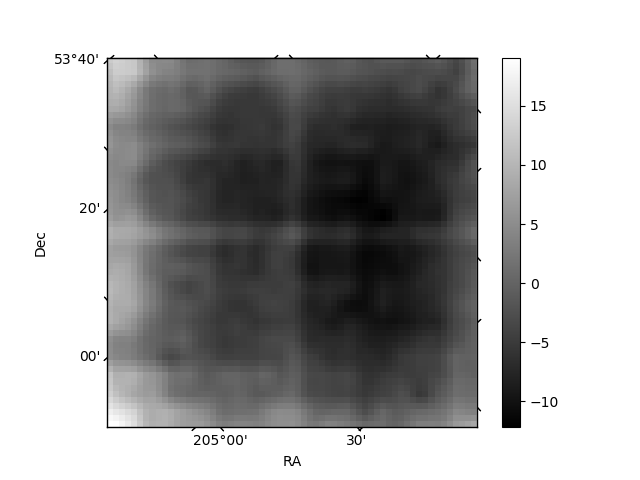
Quadrant B |
|---|---|---|---|
| Quadrant D | 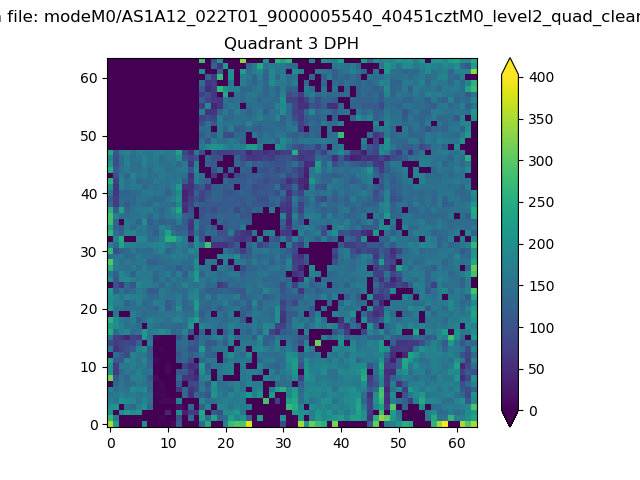 |
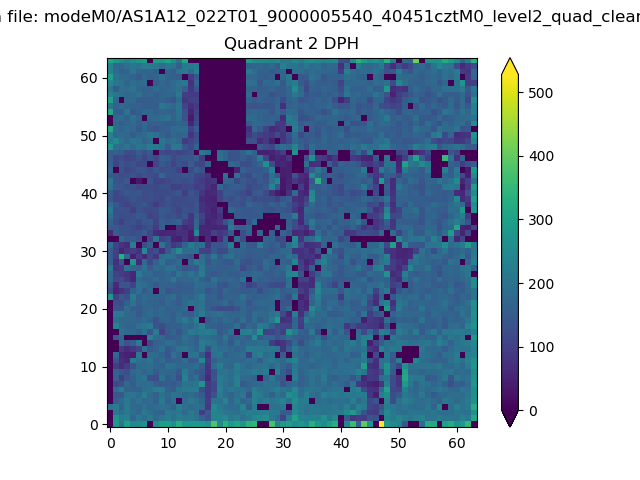 |
Quadrant C |
| Plot type | Count rate plots | Images |
|---|---|---|
| Comparison with Poisson distribution Blue bars denote a histogram of data divided into 1 sec bins. Red curve is a Poisson curve with rate = median count rate of data. |
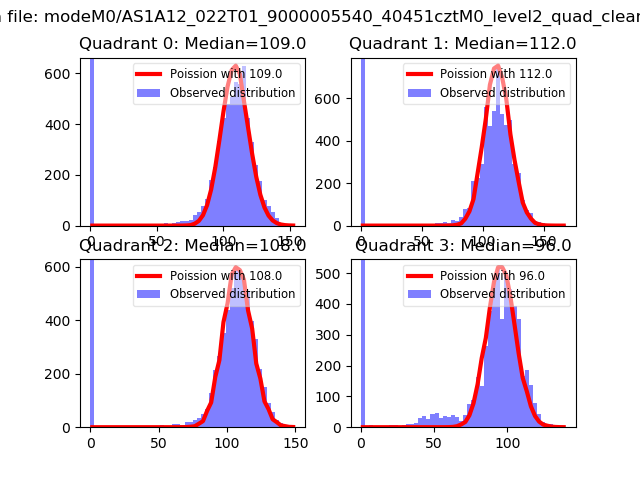 |
 |
| Quadrant-wise count rates Data is divided into 100 sec bins |
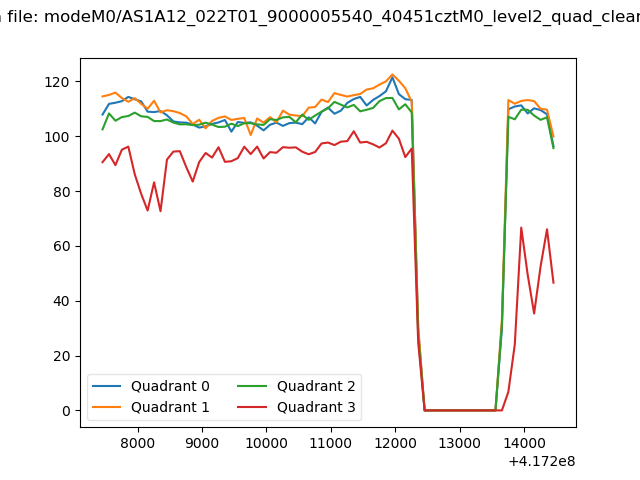 |
|
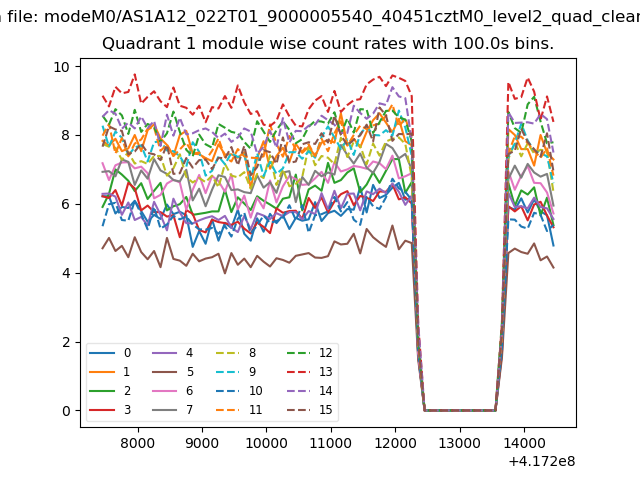
| Module-wise count rates for Quadrant A Data is divided into 100 sec bins |
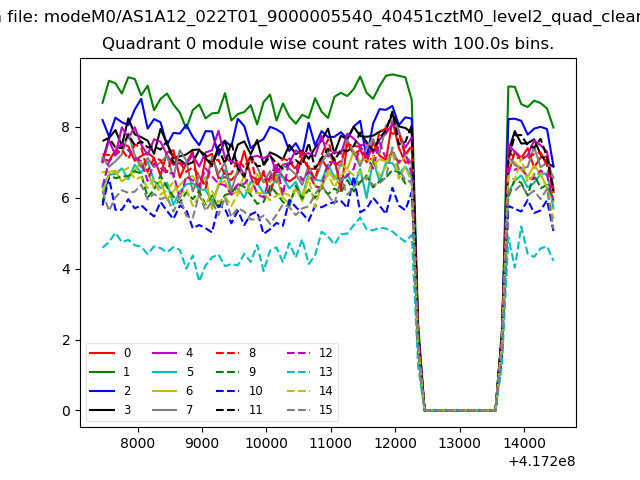 |
 |
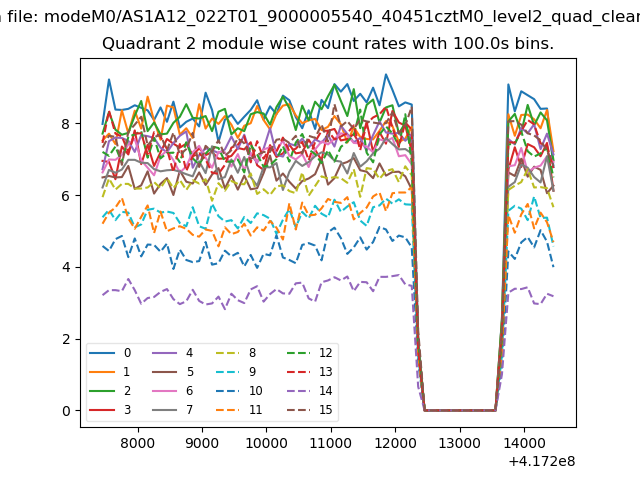
| Module-wise count rates for Quadrant B Data is divided into 100 sec bins |
 |
 |
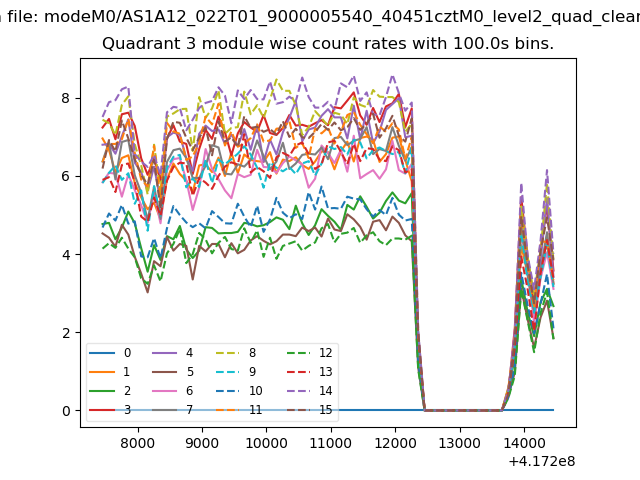
| Module-wise count rates for Quadrant C Data is divided into 100 sec bins |
 |
 |
| Module-wise count rates for Quadrant D Data is divided into 100 sec bins |
 |
 |
| Parameter | Plot |
|---|---|
| CZT HV Monitor | 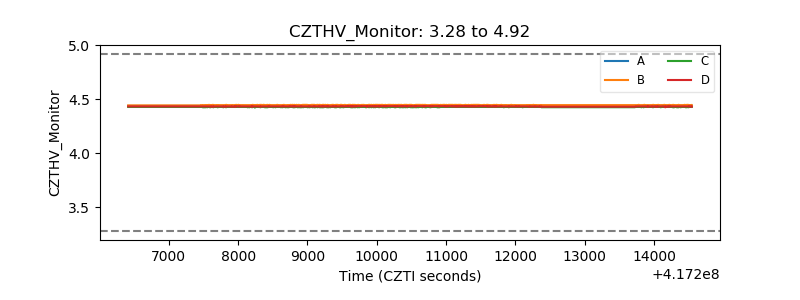 |
| D_VDD | 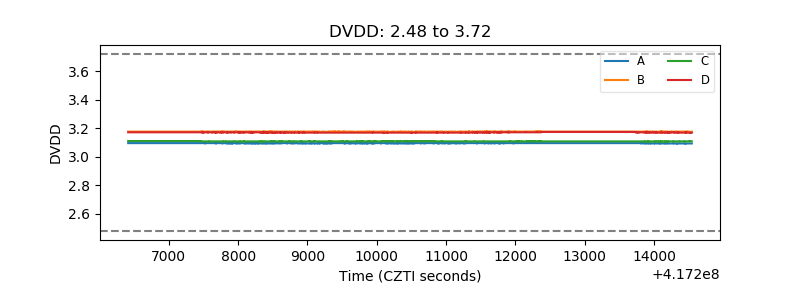 |
| Temperature 1 | 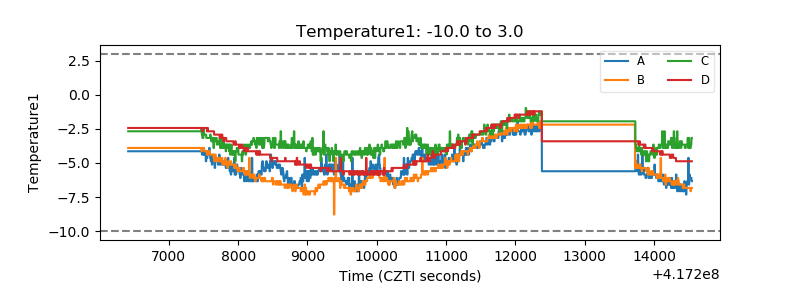 |
| Veto HV Monitor | 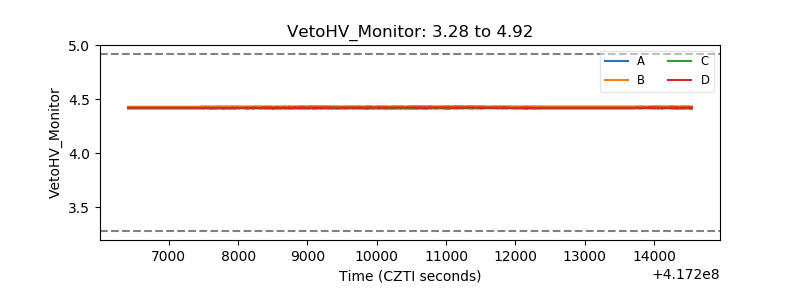 |
| Veto LLD | 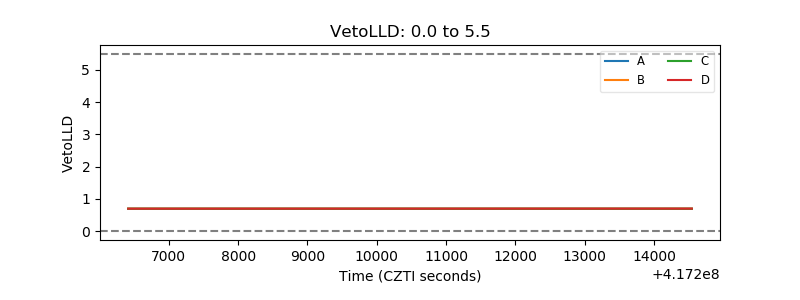 |
| Alpha Counter |  |
| _CPM_Rate | 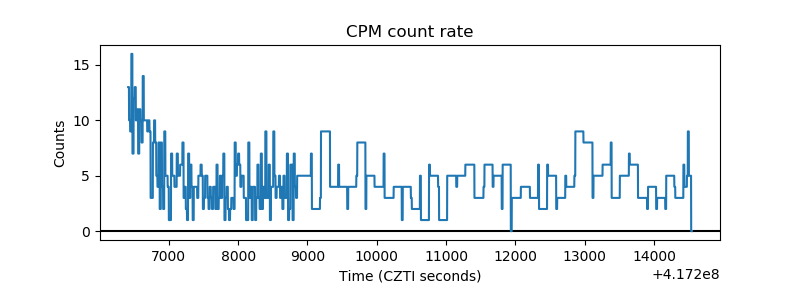 |
| CZT Counter | 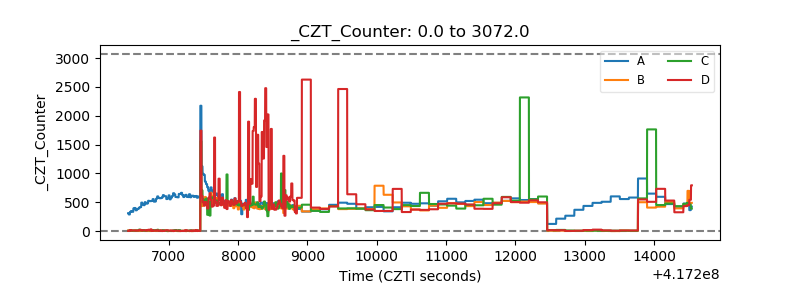 |
| +2.5 Volts monitor | 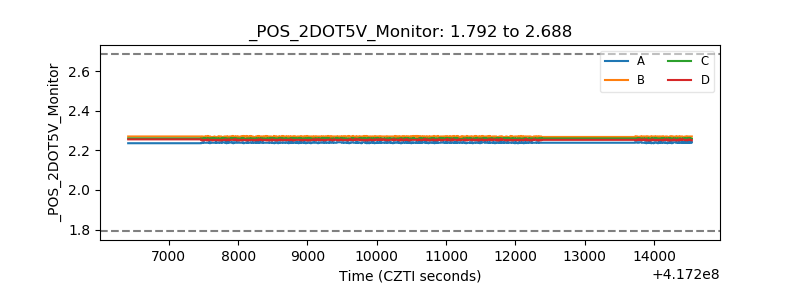 |
| +5 Volts monitor | 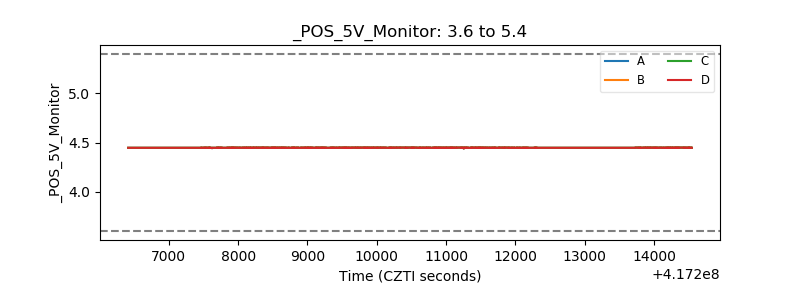 |
| _ROLL_ROT | 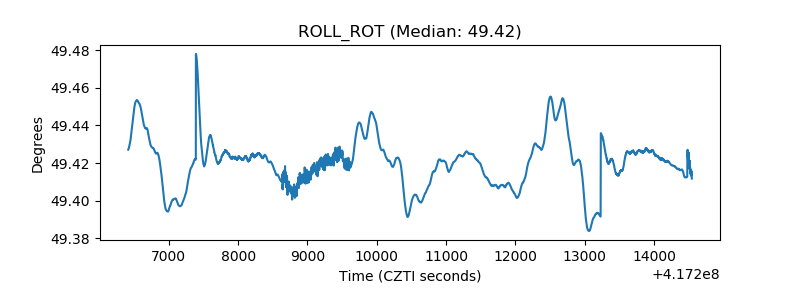 |
| _Roll_DEC | 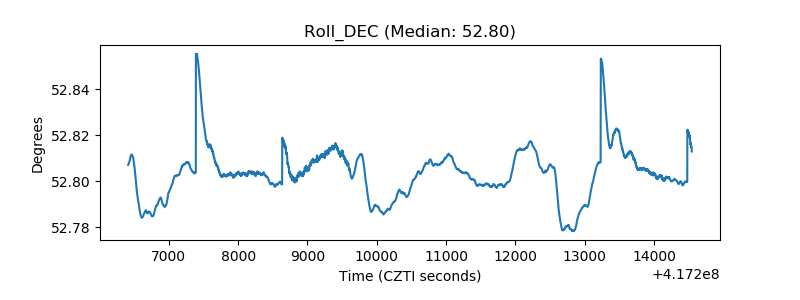 |
| _Roll_RA | 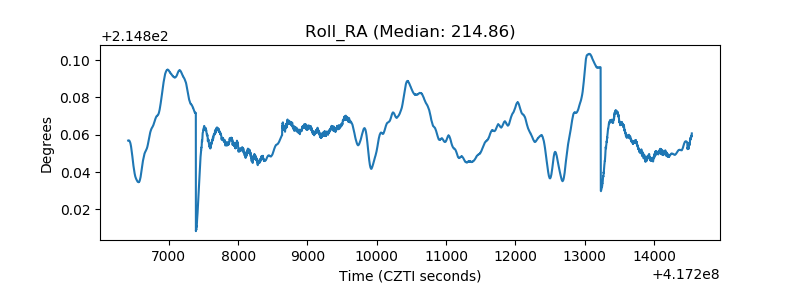 |
| Veto Counter | 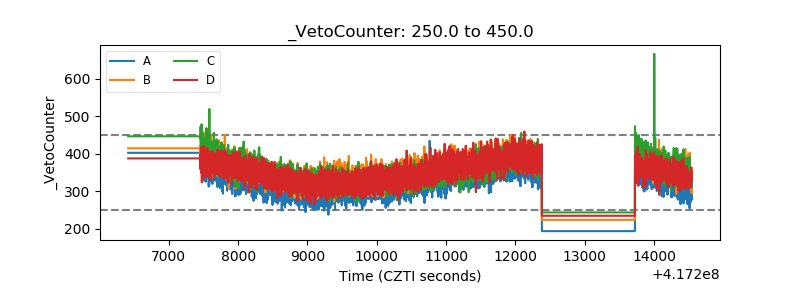 |