| Param | Original file | Final file |
|---|---|---|
| Filename | modeM0/AS1A12_022T01_9000005540_40452cztM0_level2.fits | modeM0/AS1A12_022T01_9000005540_40452cztM0_level2_quad_clean.evt |
| Size (bytes) | 407,848,320 | 112,593,600 |
| Size | 389.0 MB | 107.4 MB |
| Events in quadrant A | 3,576,433 | 771,072 |
| Events in quadrant B | 3,359,919 | 789,813 |
| Events in quadrant C | 3,482,308 | 761,904 |
| Events in quadrant D | 4,126,480 | 593,642 |
| Mode M0 | |||
|---|---|---|---|
| Quadrant | BADHDUFLAG | Total packets | Discarded packets |
| A | 0 | 15112 | 3 |
| B | 0 | 14858 | 2 |
| C | 0 | 14989 | 2 |
| D | 0 | 17200 | 2 |
| Mode M9 | |||
|---|---|---|---|
| Quadrant | BADHDUFLAG | Total packets | Discarded packets |
| A | 0 | 27 | 0 |
| B | 0 | 27 | 0 |
| C | 0 | 27 | 0 |
| D | 0 | 27 | 0 |
| Mode SS | |||
|---|---|---|---|
| Quadrant | BADHDUFLAG | Total packets | Discarded packets |
| A | 0 | 144 | 0 |
| B | 0 | 144 | 0 |
| C | 0 | 144 | 0 |
| D | 0 | 144 | 0 |
| Quadrant | Total seconds | Saturated seconds | Saturation percentage |
|---|---|---|---|
| A | 7080 | 18 | 0.254237% |
| B | 7080 | 28 | 0.395480% |
| C | 7080 | 29 | 0.409605% |
| D | 7080 | 1255 | 17.725989% |
Noise dominated data is calculated using 1-second bins in cleaned event files. If a bin has >2000 counts, and if more than 50% of those come from <1% of pixels, then it is considered to be noise-dominated and hence unusable.
| Quadrant | # 1 sec bins | Bins with >0 counts | Bins with >2000 counts | High rate bins dominated by noise | Noise dominated (total time) | Noise dominated (detector-on time) | Marked lightcurve |
|---|---|---|---|---|---|---|---|
| A | 9707 | 7082 | 5 | 5 | 0.05% | 0.07% | 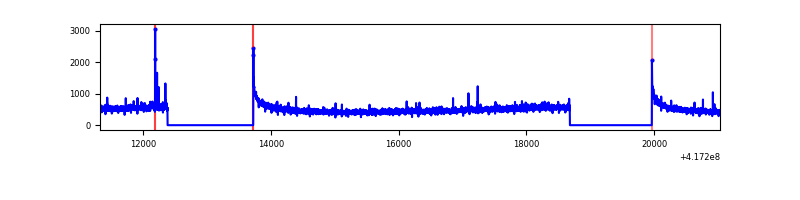 |
| B | 9707 | 7082 | 8 | 8 | 0.08% | 0.11% | 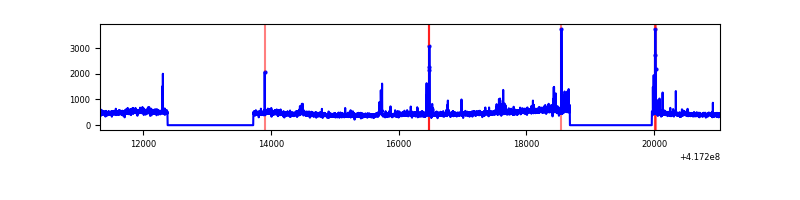 |
| C | 9707 | 7082 | 25 | 25 | 0.26% | 0.35% | 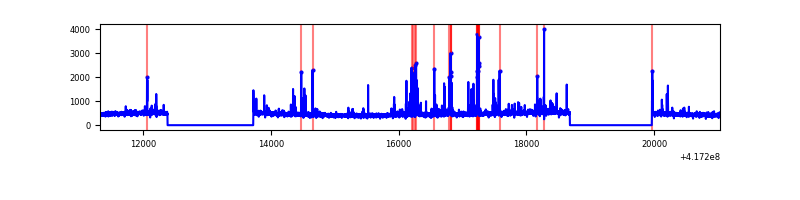 |
| D | 9707 | 7082 | 125 | 125 | 1.29% | 1.77% | 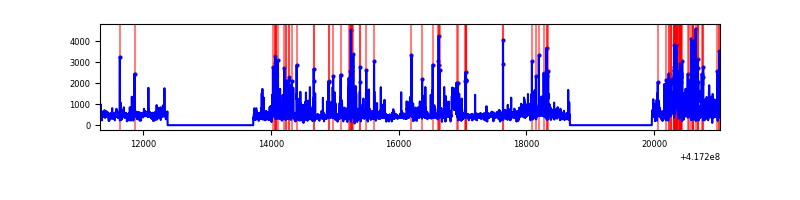 |
Top three noisy pixels from each quadrant. If the there are fewer than three noisy pixels in the level2.evt file, extra rows are filled as -1
| Pixel properties | Quadrant properties | ||||||
|---|---|---|---|---|---|---|---|
| Quadrant | DetID | PixID | Counts | Sigma | Mean | Median | Sigma |
| A | 10 | 83 | 568747 | 3646.81 | 765 | 751 | 155.8 |
| A | 7 | 3 | 19592 | 120.97 | 765 | 751 | 155.8 |
| A | 12 | 189 | 13070 | 79.09 | 765 | 751 | 155.8 |
| B | 3 | 112 | 144934 | 987.21 | 756 | 734 | 146.1 |
| B | 4 | 171 | 119069 | 810.14 | 756 | 734 | 146.1 |
| B | 0 | 230 | 93031 | 631.88 | 756 | 734 | 146.1 |
| C | 15 | 214 | 299579 | 1719.79 | 745 | 750 | 173.8 |
| C | 14 | 254 | 267804 | 1536.92 | 745 | 750 | 173.8 |
| C | 13 | 61 | 4931 | 24.06 | 745 | 750 | 173.8 |
| D | 12 | 227 | 486608 | 2941.98 | 674 | 654 | 165.2 |
| D | 12 | 128 | 295793 | 1786.78 | 674 | 654 | 165.2 |
| D | 12 | 191 | 277683 | 1677.14 | 674 | 654 | 165.2 |
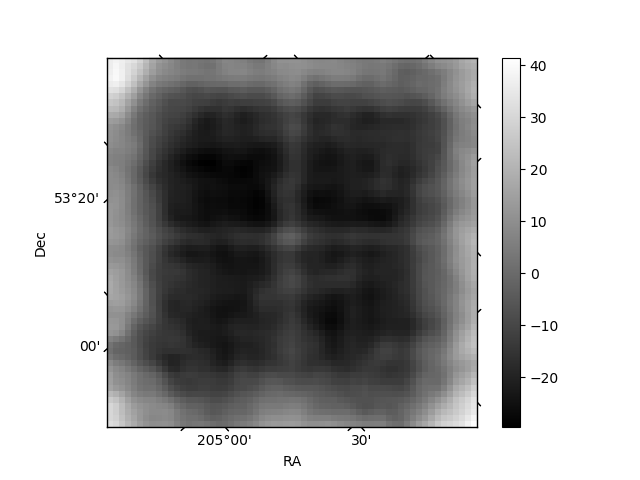
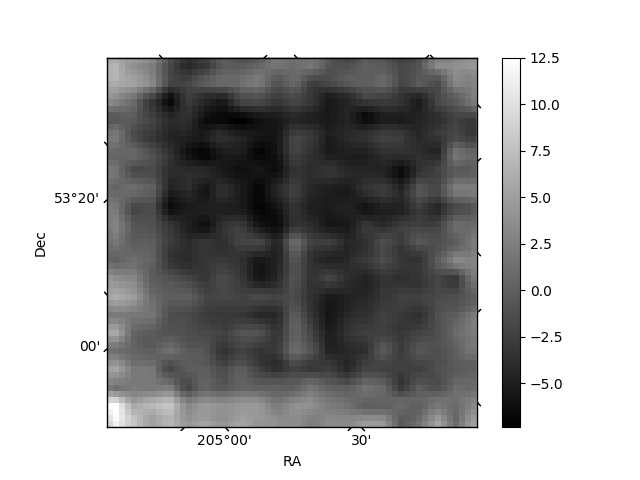
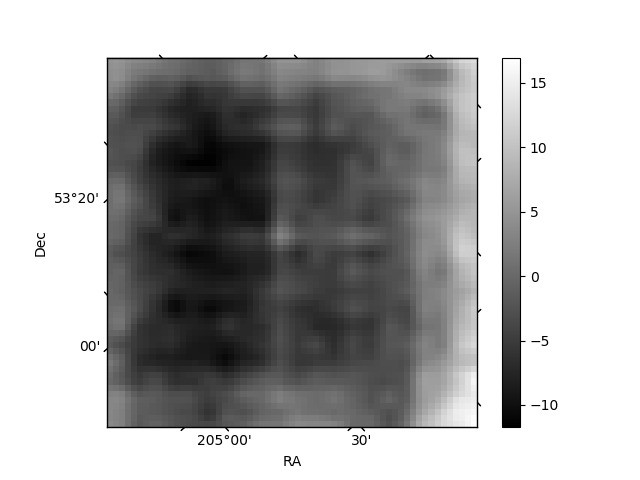
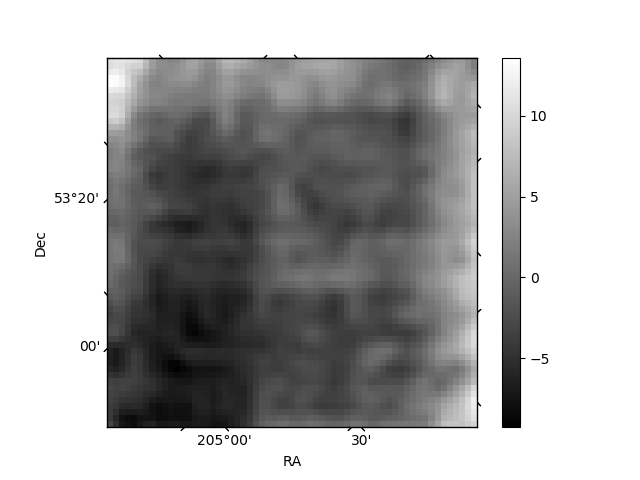
Histogram calculated using DETX and DETY for each event in the final _common_clean file
| Quadrant A | 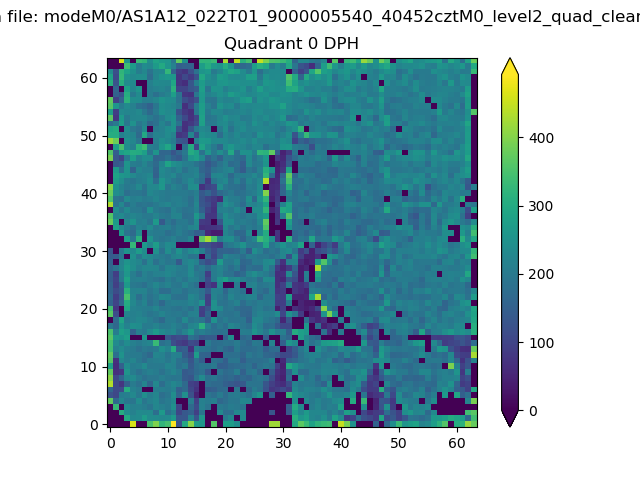 |
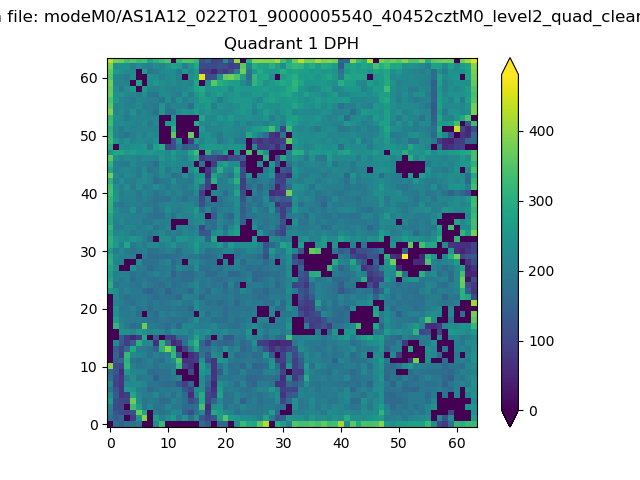 |
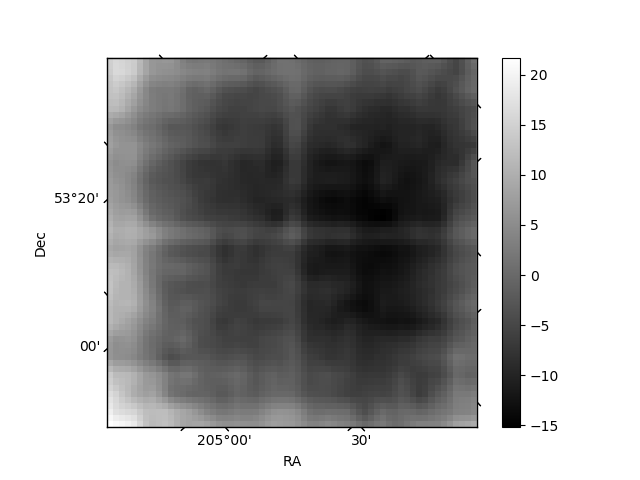
Quadrant B |
|---|---|---|---|
| Quadrant D | 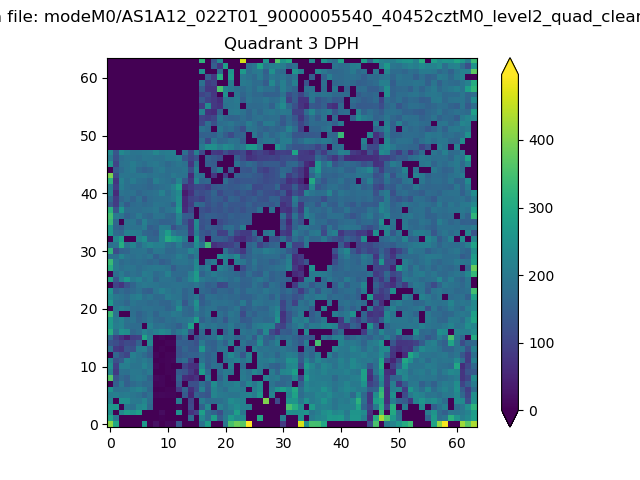 |
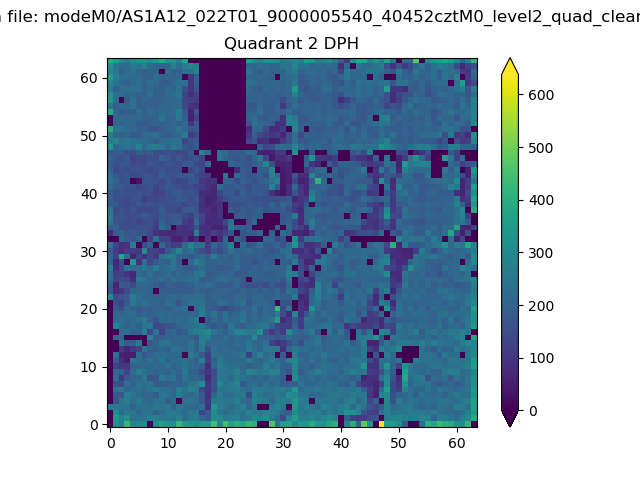 |
Quadrant C |
| Plot type | Count rate plots | Images |
|---|---|---|
| Comparison with Poisson distribution Blue bars denote a histogram of data divided into 1 sec bins. Red curve is a Poisson curve with rate = median count rate of data. |
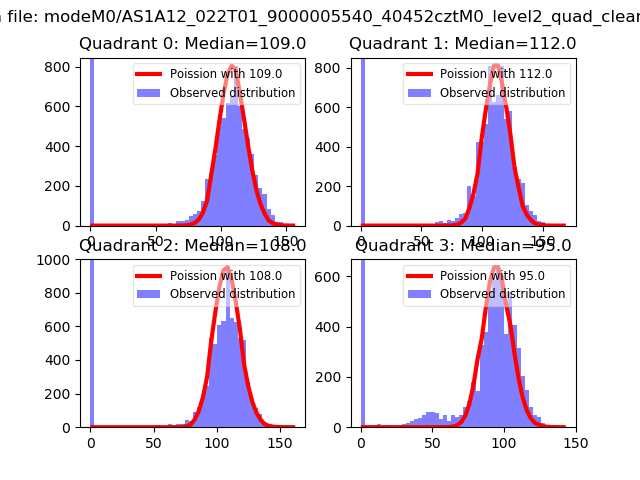 |
 |
| Quadrant-wise count rates Data is divided into 100 sec bins |
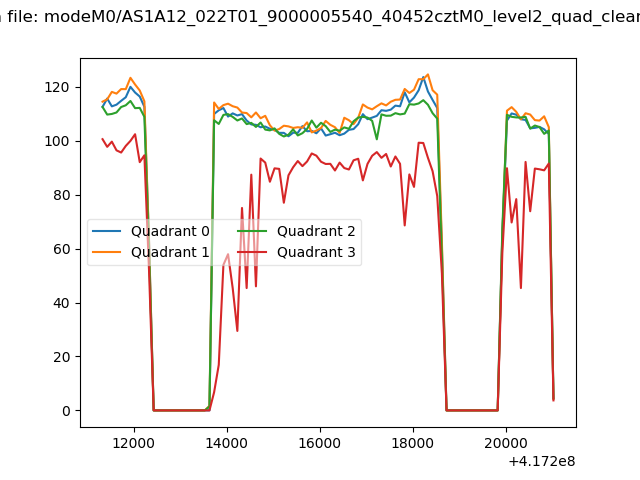 |
|
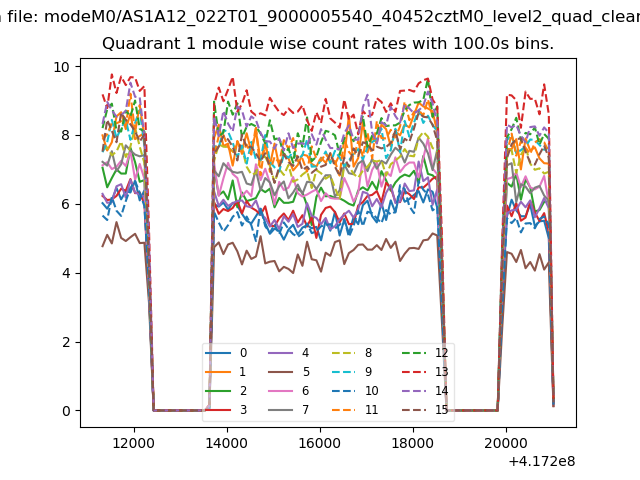
| Module-wise count rates for Quadrant A Data is divided into 100 sec bins |
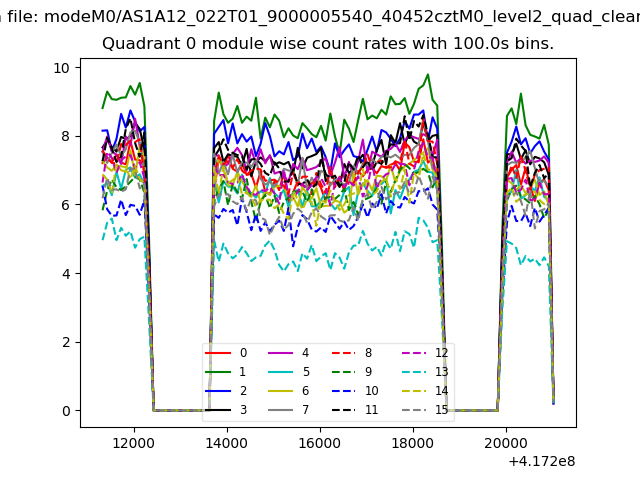 |
 |
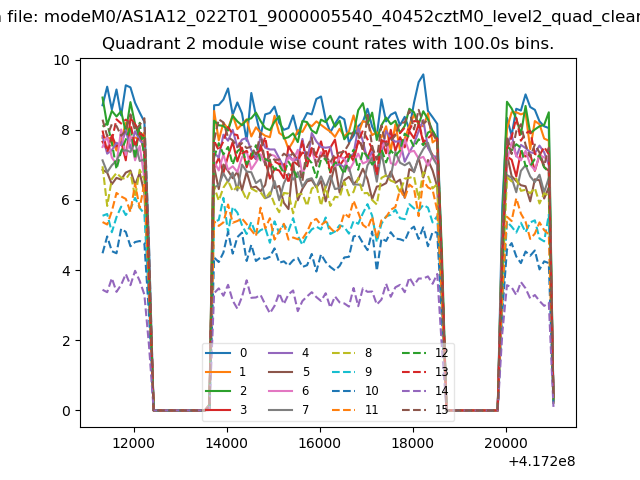
| Module-wise count rates for Quadrant B Data is divided into 100 sec bins |
 |
 |
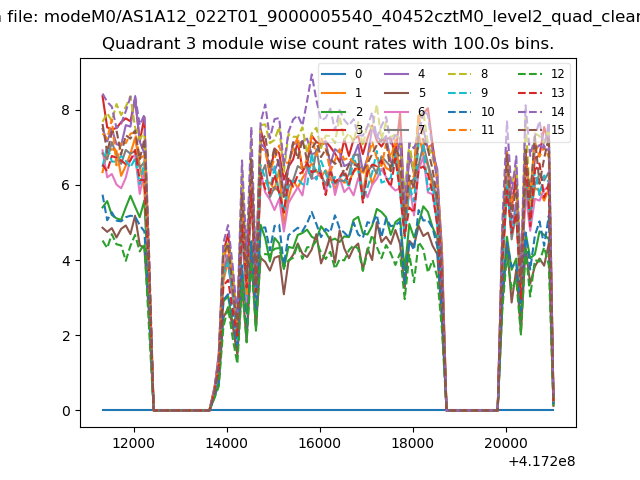
| Module-wise count rates for Quadrant C Data is divided into 100 sec bins |
 |
 |
| Module-wise count rates for Quadrant D Data is divided into 100 sec bins |
 |
 |
| Parameter | Plot |
|---|---|
| CZT HV Monitor |  |
| D_VDD | 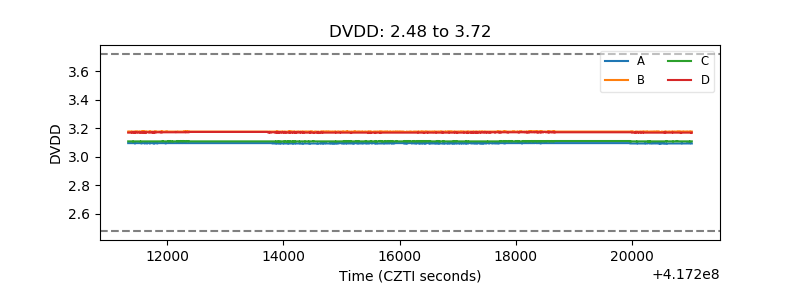 |
| Temperature 1 | 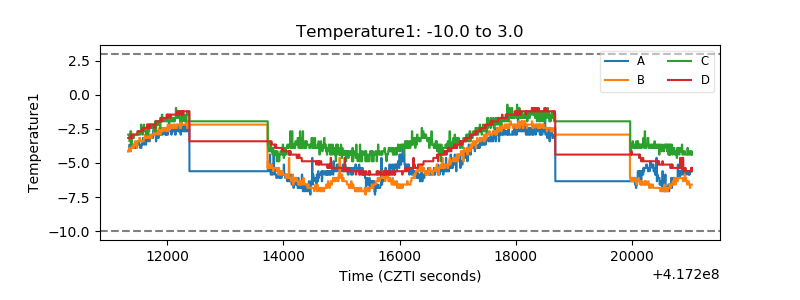 |
| Veto HV Monitor | 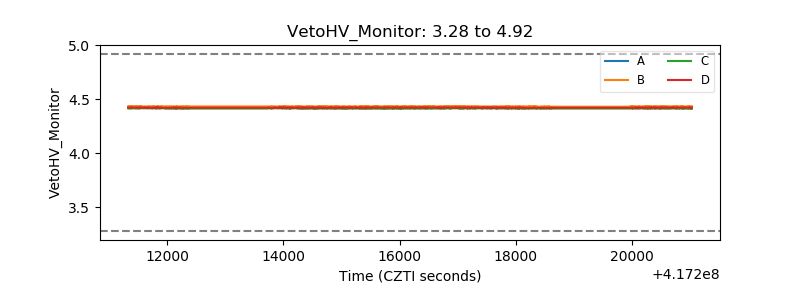 |
| Veto LLD | 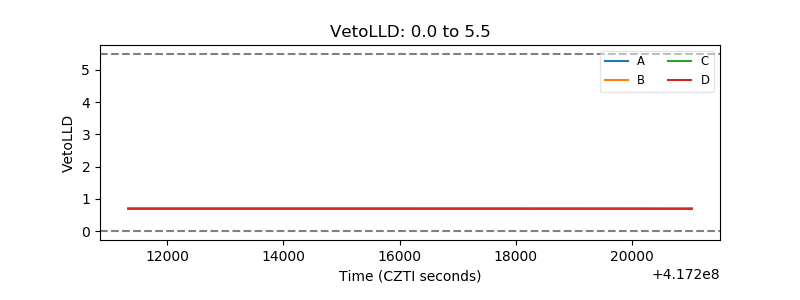 |
| Alpha Counter | 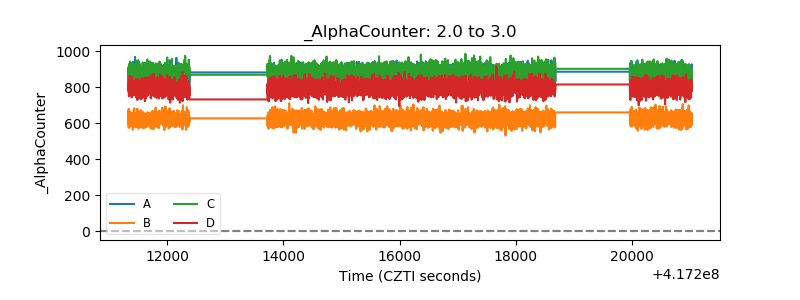 |
| _CPM_Rate | 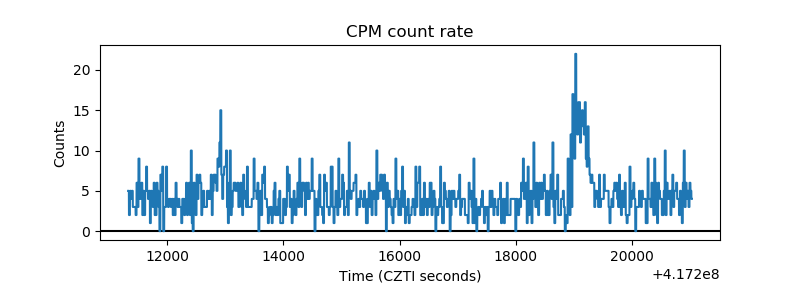 |
| CZT Counter | 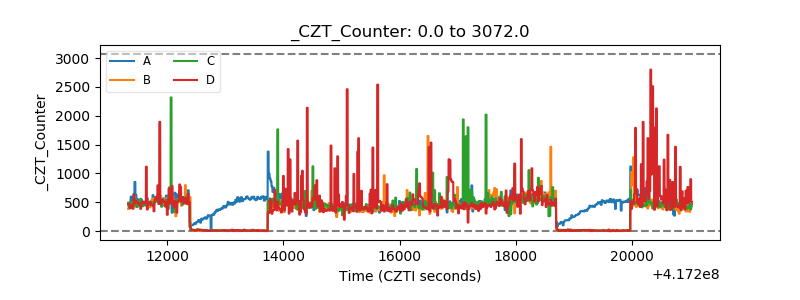 |
| +2.5 Volts monitor | 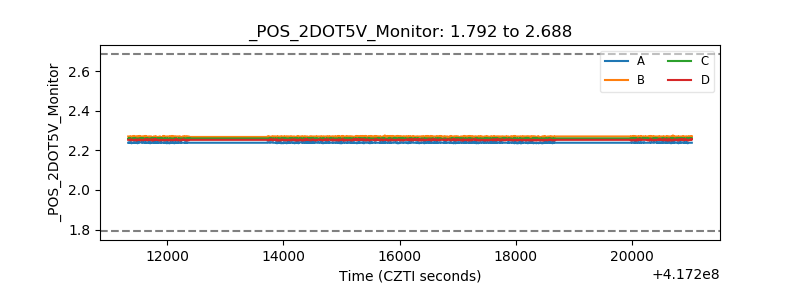 |
| +5 Volts monitor |  |
| _ROLL_ROT | 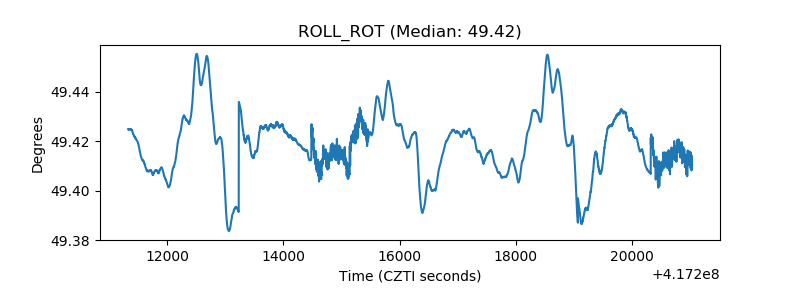 |
| _Roll_DEC | 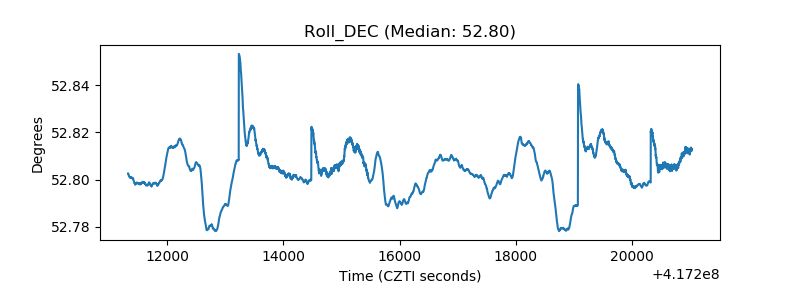 |
| _Roll_RA | 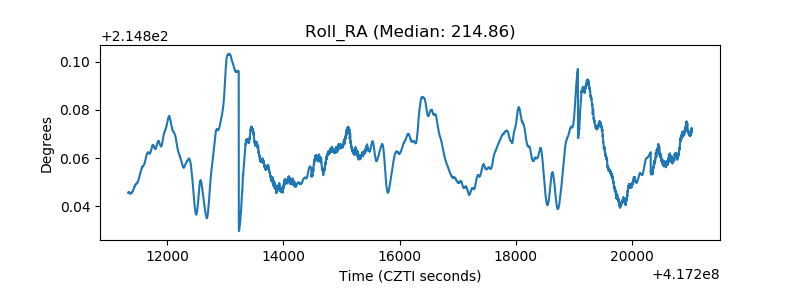 |
| Veto Counter | 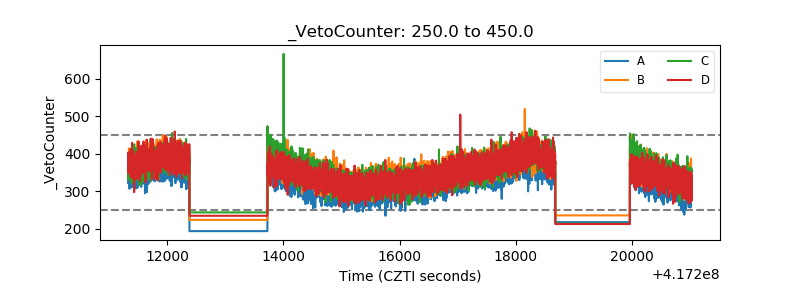 |