| Param | Original file | Final file |
|---|---|---|
| Filename | modeM0/AS1A12_022T01_9000005540_40454cztM0_level2.fits | modeM0/AS1A12_022T01_9000005540_40454cztM0_level2_quad_clean.evt |
| Size (bytes) | 644,627,520 | 176,869,440 |
| Size | 614.8 MB | 168.7 MB |
| Events in quadrant A | 5,654,654 | 1,193,339 |
| Events in quadrant B | 5,100,038 | 1,226,674 |
| Events in quadrant C | 5,478,739 | 1,173,937 |
| Events in quadrant D | 6,753,486 | 982,166 |
| Mode M0 | |||
|---|---|---|---|
| Quadrant | BADHDUFLAG | Total packets | Discarded packets |
| A | 0 | 23900 | 4 |
| B | 0 | 23272 | 3 |
| C | 0 | 23891 | 3 |
| D | 0 | 28074 | 3 |
| Mode M9 | |||
|---|---|---|---|
| Quadrant | BADHDUFLAG | Total packets | Discarded packets |
| A | 0 | 41 | 0 |
| B | 0 | 41 | 0 |
| C | 0 | 41 | 0 |
| D | 0 | 41 | 0 |
| Mode SS | |||
|---|---|---|---|
| Quadrant | BADHDUFLAG | Total packets | Discarded packets |
| A | 0 | 230 | 0 |
| B | 0 | 230 | 0 |
| C | 0 | 230 | 0 |
| D | 0 | 230 | 0 |
| Quadrant | Total seconds | Saturated seconds | Saturation percentage |
|---|---|---|---|
| A | 11258 | 14 | 0.124356% |
| B | 11258 | 33 | 0.293125% |
| C | 11258 | 109 | 0.968200% |
| D | 11258 | 1459 | 12.959673% |
Noise dominated data is calculated using 1-second bins in cleaned event files. If a bin has >2000 counts, and if more than 50% of those come from <1% of pixels, then it is considered to be noise-dominated and hence unusable.
| Quadrant | # 1 sec bins | Bins with >0 counts | Bins with >2000 counts | High rate bins dominated by noise | Noise dominated (total time) | Noise dominated (detector-on time) | Marked lightcurve |
|---|---|---|---|---|---|---|---|
| A | 15318 | 11261 | 4 | 4 | 0.03% | 0.04% | 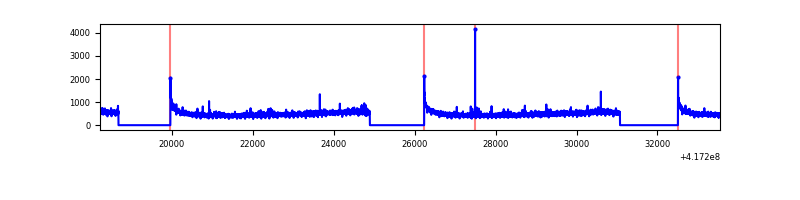 |
| B | 15318 | 11261 | 5 | 5 | 0.03% | 0.04% | 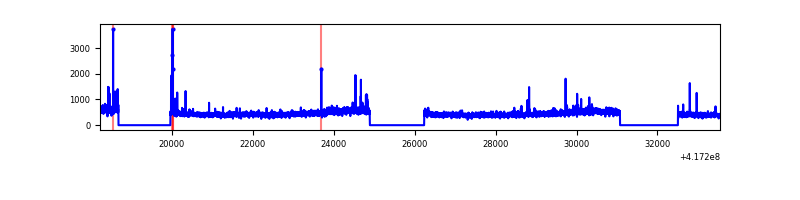 |
| C | 15318 | 11261 | 74 | 74 | 0.48% | 0.66% | 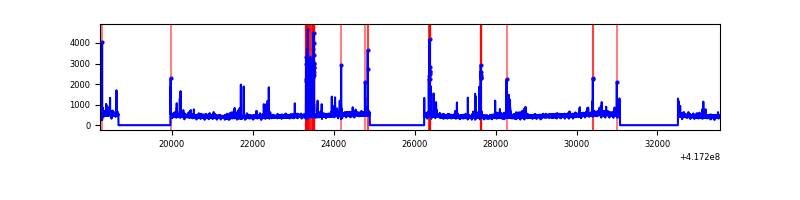 |
| D | 15318 | 11261 | 285 | 285 | 1.86% | 2.53% | 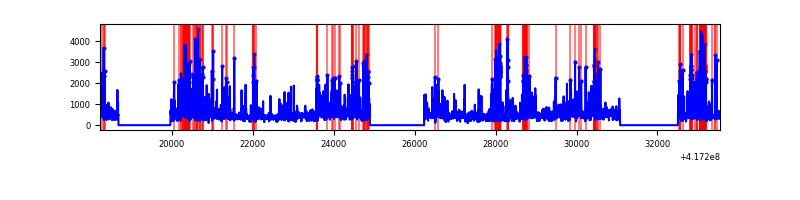 |
Top three noisy pixels from each quadrant. If the there are fewer than three noisy pixels in the level2.evt file, extra rows are filled as -1
| Pixel properties | Quadrant properties | ||||||
|---|---|---|---|---|---|---|---|
| Quadrant | DetID | PixID | Counts | Sigma | Mean | Median | Sigma |
| A | 10 | 83 | 911423 | 3755.64 | 1201 | 1178 | 242.4 |
| A | 3 | 1 | 42654 | 171.13 | 1201 | 1178 | 242.4 |
| A | 12 | 189 | 22656 | 88.62 | 1201 | 1178 | 242.4 |
| B | 3 | 112 | 185033 | 802.62 | 1191 | 1157 | 229.1 |
| B | 4 | 171 | 104377 | 450.56 | 1191 | 1157 | 229.1 |
| B | 0 | 230 | 87665 | 377.61 | 1191 | 1157 | 229.1 |
| C | 15 | 214 | 478366 | 1761.27 | 1168 | 1174 | 270.9 |
| C | 14 | 254 | 424296 | 1561.7 | 1168 | 1174 | 270.9 |
| C | 3 | 233 | 11587 | 38.43 | 1168 | 1174 | 270.9 |
| D | 12 | 227 | 817645 | 2997.42 | 1100 | 1066 | 272.4 |
| D | 12 | 128 | 628796 | 2304.21 | 1100 | 1066 | 272.4 |
| D | 12 | 191 | 360921 | 1320.92 | 1100 | 1066 | 272.4 |
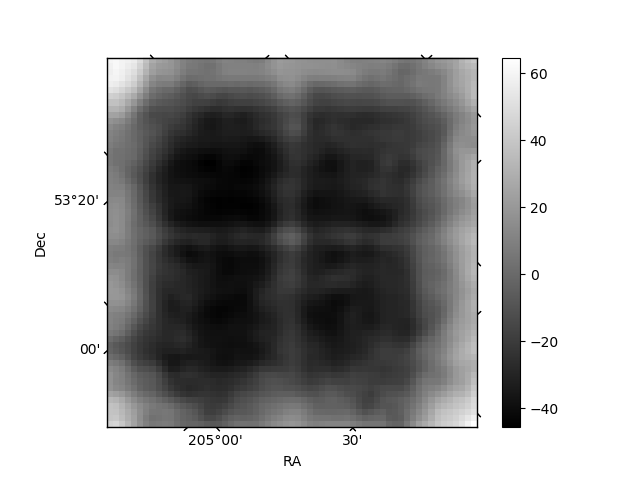
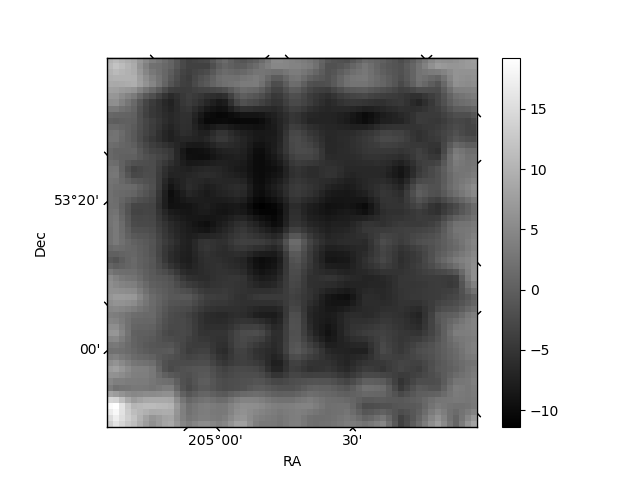
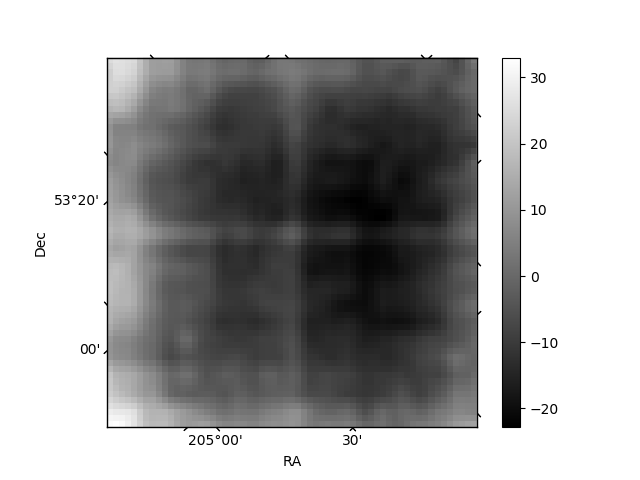
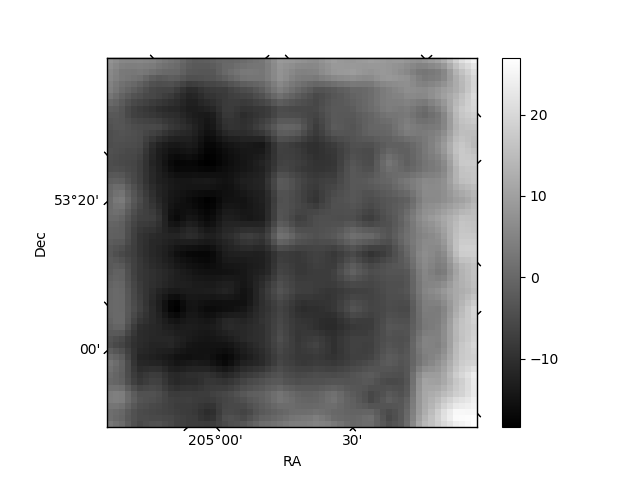
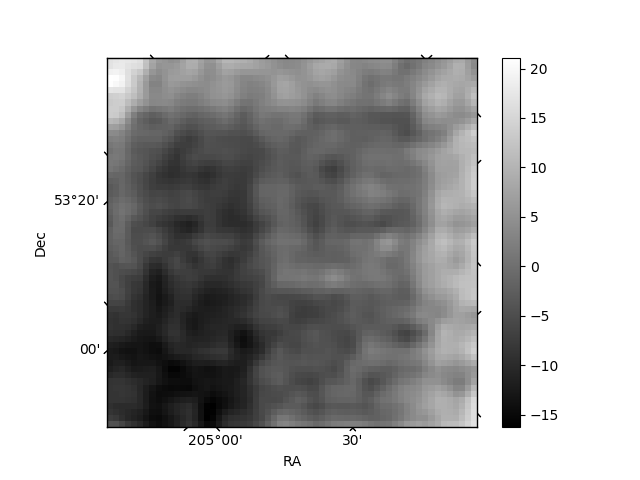
Histogram calculated using DETX and DETY for each event in the final _common_clean file
| Quadrant A | 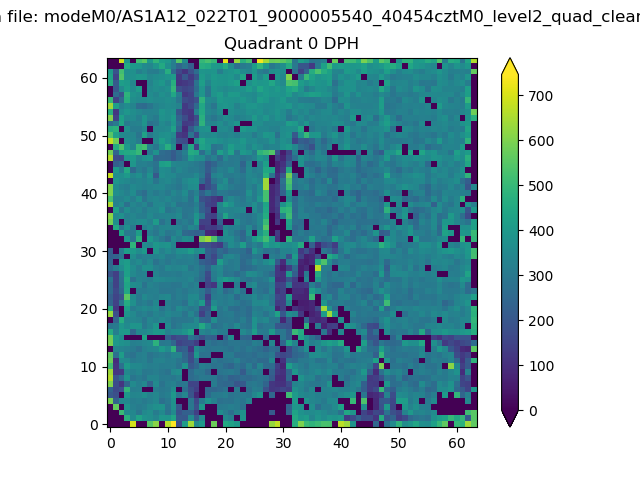 |
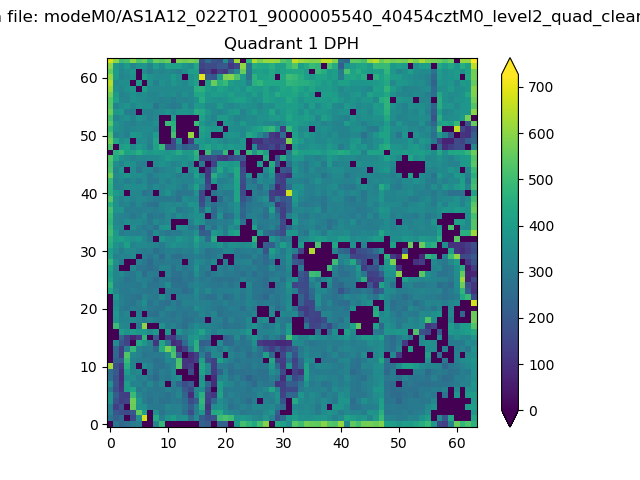 |
Quadrant B |
|---|---|---|---|
| Quadrant D | 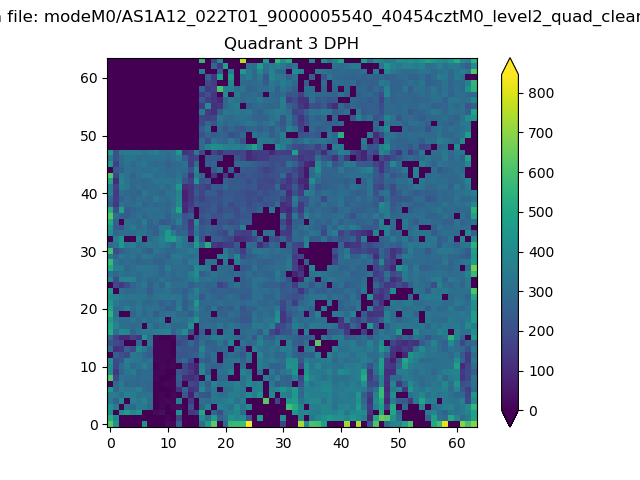 |
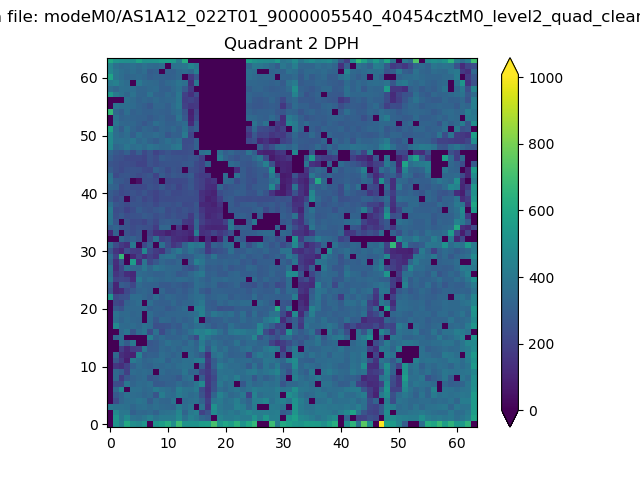 |
Quadrant C |
| Plot type | Count rate plots | Images |
|---|---|---|
| Comparison with Poisson distribution Blue bars denote a histogram of data divided into 1 sec bins. Red curve is a Poisson curve with rate = median count rate of data. |
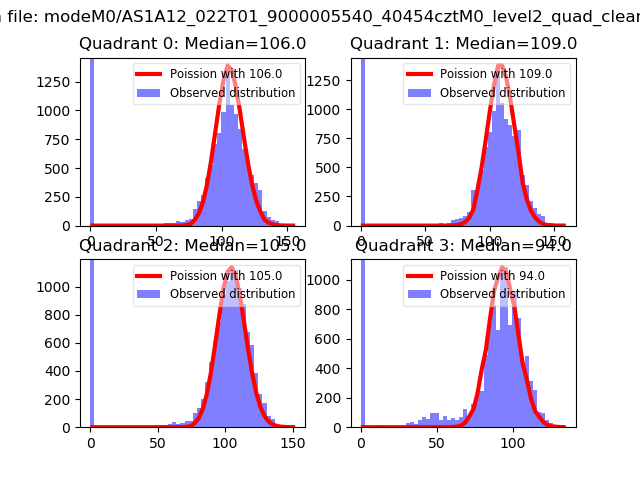 |
 |
| Quadrant-wise count rates Data is divided into 100 sec bins |
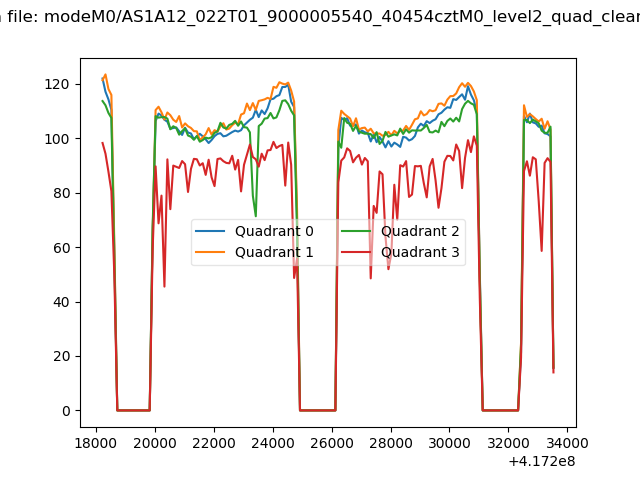 |
|
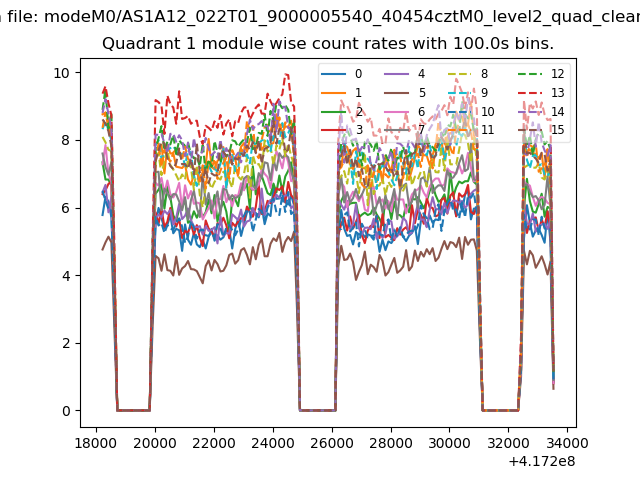
| Module-wise count rates for Quadrant A Data is divided into 100 sec bins |
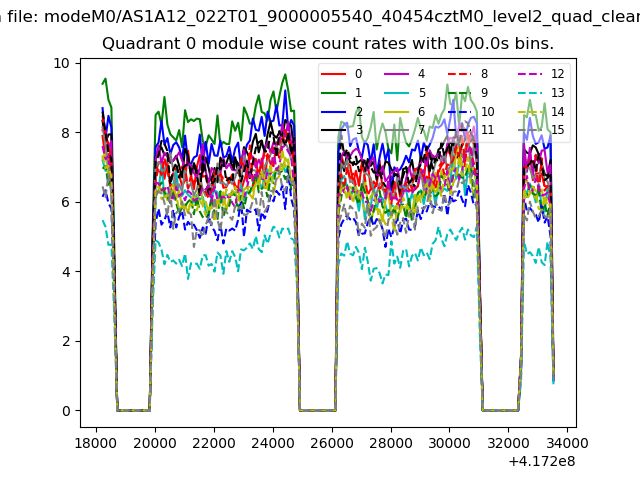 |
 |
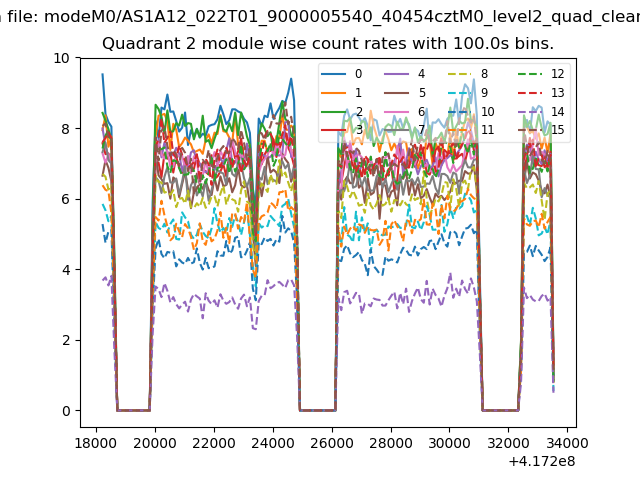
| Module-wise count rates for Quadrant B Data is divided into 100 sec bins |
 |
 |
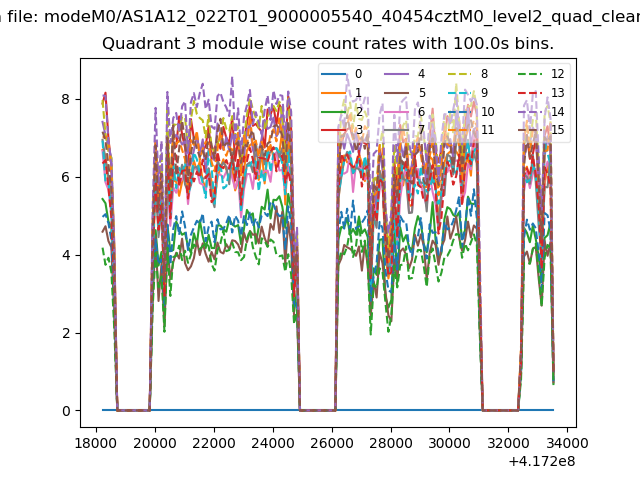
| Module-wise count rates for Quadrant C Data is divided into 100 sec bins |
 |
 |
| Module-wise count rates for Quadrant D Data is divided into 100 sec bins |
 |
 |
| Parameter | Plot |
|---|---|
| CZT HV Monitor | 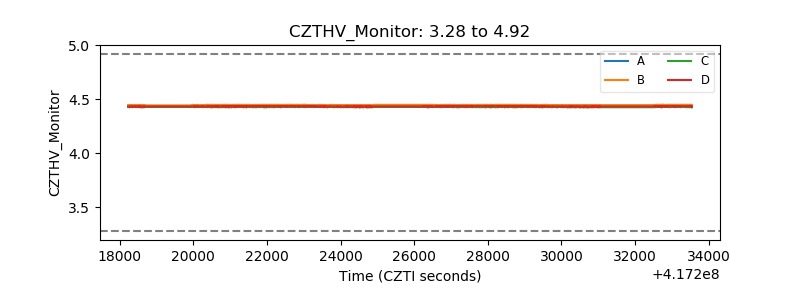 |
| D_VDD | 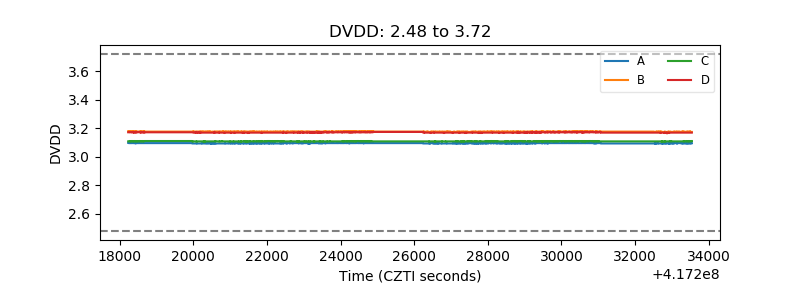 |
| Temperature 1 | 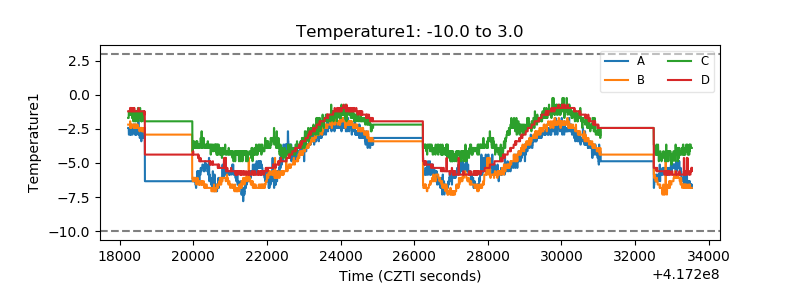 |
| Veto HV Monitor | 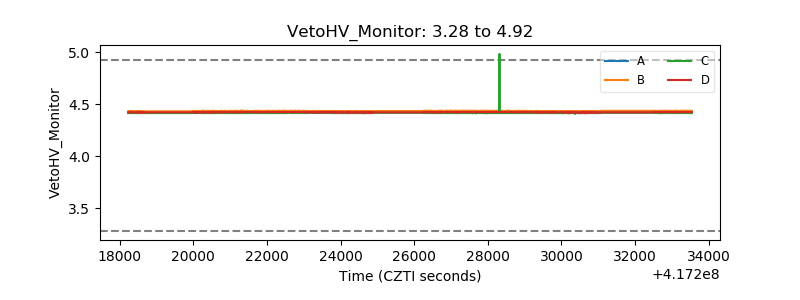 |
| Veto LLD | 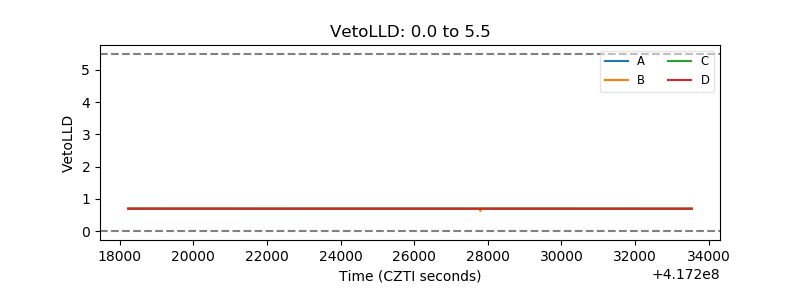 |
| Alpha Counter | 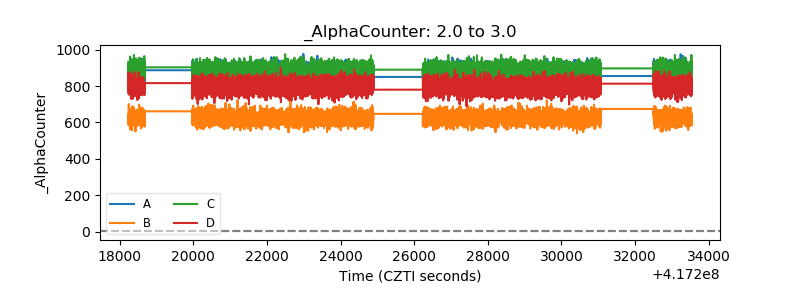 |
| _CPM_Rate | 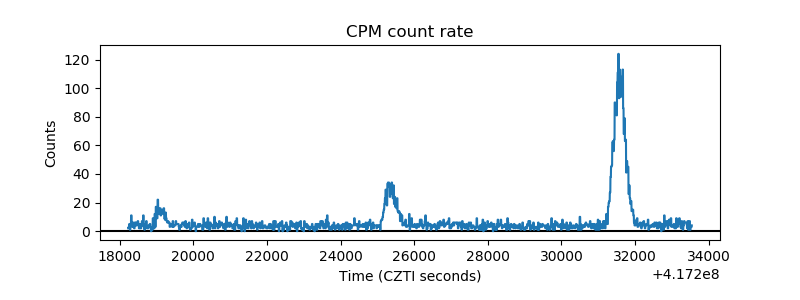 |
| CZT Counter | 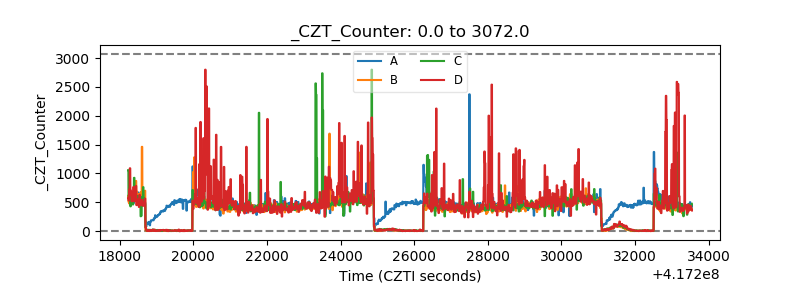 |
| +2.5 Volts monitor |  |
| +5 Volts monitor | 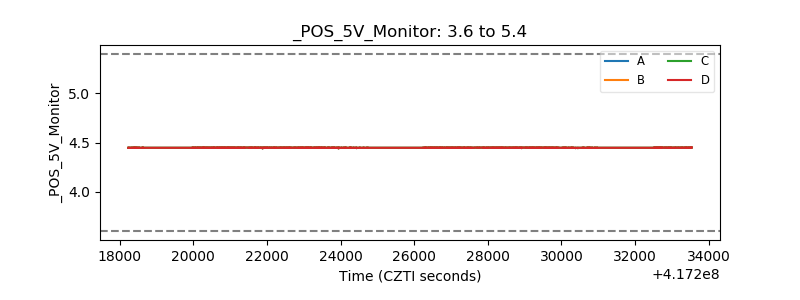 |
| _ROLL_ROT | 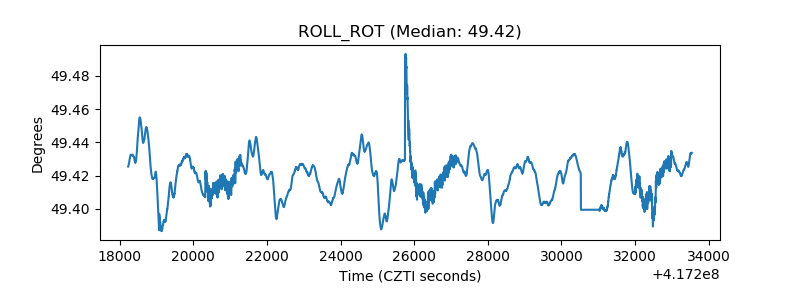 |
| _Roll_DEC | 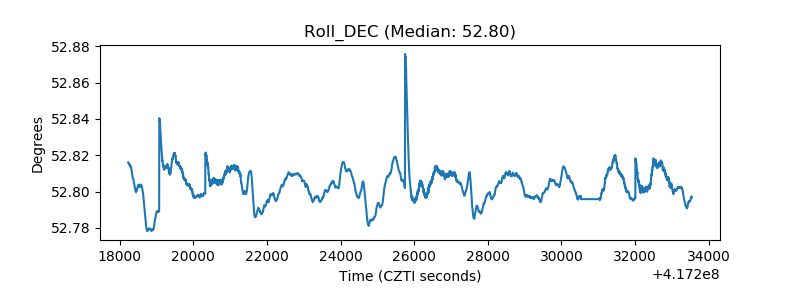 |
| _Roll_RA | 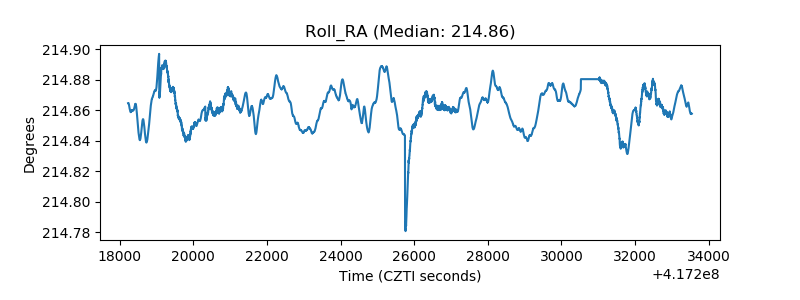 |
| Veto Counter | 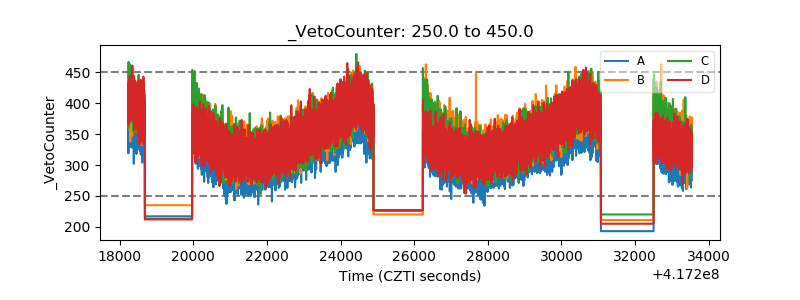 |