| Param | Original file | Final file |
|---|---|---|
| Filename | modeM0/AS1A12_022T01_9000005540_40455cztM0_level2.fits | modeM0/AS1A12_022T01_9000005540_40455cztM0_level2_quad_clean.evt |
| Size (bytes) | 335,401,920 | 89,619,840 |
| Size | 319.9 MB | 85.5 MB |
| Events in quadrant A | 2,854,310 | 606,635 |
| Events in quadrant B | 2,475,823 | 623,655 |
| Events in quadrant C | 2,629,871 | 598,519 |
| Events in quadrant D | 4,012,733 | 487,650 |
| Mode M0 | |||
|---|---|---|---|
| Quadrant | BADHDUFLAG | Total packets | Discarded packets |
| A | 0 | 12011 | 3 |
| B | 0 | 11476 | 2 |
| C | 0 | 11599 | 2 |
| D | 0 | 15853 | 2 |
| Mode M9 | |||
|---|---|---|---|
| Quadrant | BADHDUFLAG | Total packets | Discarded packets |
| A | 0 | 26 | 0 |
| B | 0 | 26 | 0 |
| C | 0 | 26 | 0 |
| D | 0 | 27 | 0 |
| Mode SS | |||
|---|---|---|---|
| Quadrant | BADHDUFLAG | Total packets | Discarded packets |
| A | 0 | 116 | 0 |
| B | 0 | 116 | 0 |
| C | 0 | 116 | 0 |
| D | 0 | 116 | 0 |
| Quadrant | Total seconds | Saturated seconds | Saturation percentage |
|---|---|---|---|
| A | 5673 | 6 | 0.105764% |
| B | 5673 | 5 | 0.088137% |
| C | 5673 | 9 | 0.158646% |
| D | 5673 | 746 | 13.150009% |
Noise dominated data is calculated using 1-second bins in cleaned event files. If a bin has >2000 counts, and if more than 50% of those come from <1% of pixels, then it is considered to be noise-dominated and hence unusable.
| Quadrant | # 1 sec bins | Bins with >0 counts | Bins with >2000 counts | High rate bins dominated by noise | Noise dominated (total time) | Noise dominated (detector-on time) | Marked lightcurve |
|---|---|---|---|---|---|---|---|
| A | 7256 | 5674 | 4 | 4 | 0.06% | 0.07% | 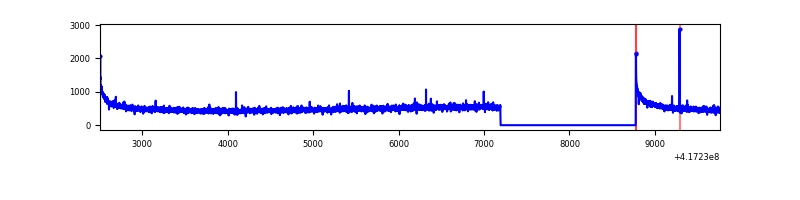 |
| B | 7256 | 5674 | 0 | 0 | 0.00% | 0.00% | 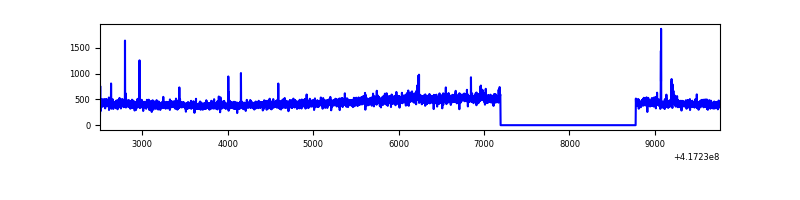 |
| C | 7256 | 5674 | 3 | 3 | 0.04% | 0.05% | 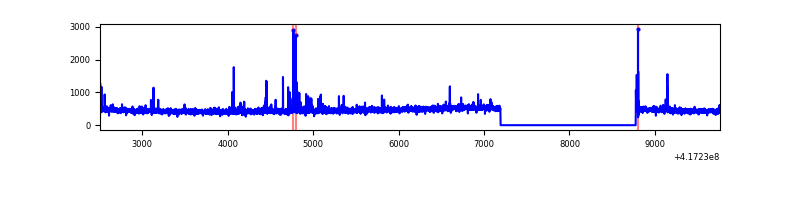 |
| D | 7256 | 5674 | 324 | 324 | 4.47% | 5.71% | 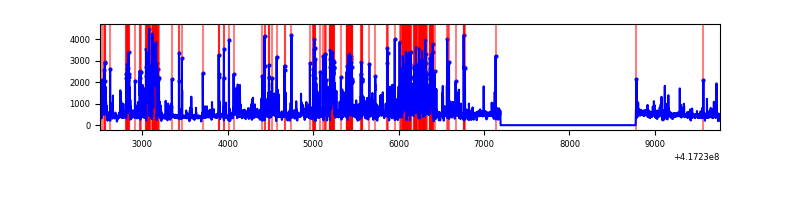 |
Top three noisy pixels from each quadrant. If the there are fewer than three noisy pixels in the level2.evt file, extra rows are filled as -1
| Pixel properties | Quadrant properties | ||||||
|---|---|---|---|---|---|---|---|
| Quadrant | DetID | PixID | Counts | Sigma | Mean | Median | Sigma |
| A | 10 | 83 | 501696 | 4022.88 | 601 | 588 | 124.6 |
| A | 2 | 79 | 9935 | 75.04 | 601 | 588 | 124.6 |
| A | 13 | 6 | 8620 | 64.48 | 601 | 588 | 124.6 |
| B | 3 | 112 | 47579 | 405.01 | 598 | 581 | 116.0 |
| B | 0 | 230 | 34789 | 294.79 | 598 | 581 | 116.0 |
| B | 4 | 171 | 16783 | 139.62 | 598 | 581 | 116.0 |
| C | 15 | 214 | 246085 | 1789.46 | 586 | 589 | 137.2 |
| C | 14 | 254 | 84977 | 615.12 | 586 | 589 | 137.2 |
| C | 3 | 233 | 6765 | 45.02 | 586 | 589 | 137.2 |
| D | 2 | 250 | 893586 | 6605.21 | 546 | 531 | 135.2 |
| D | 12 | 227 | 374531 | 2766.18 | 546 | 531 | 135.2 |
| D | 12 | 128 | 354258 | 2616.23 | 546 | 531 | 135.2 |
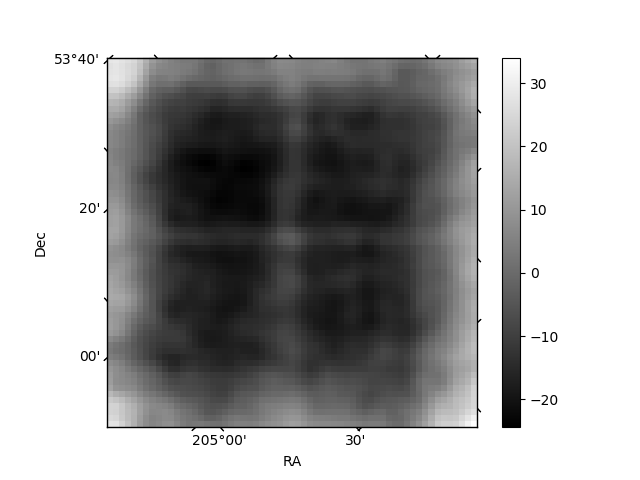
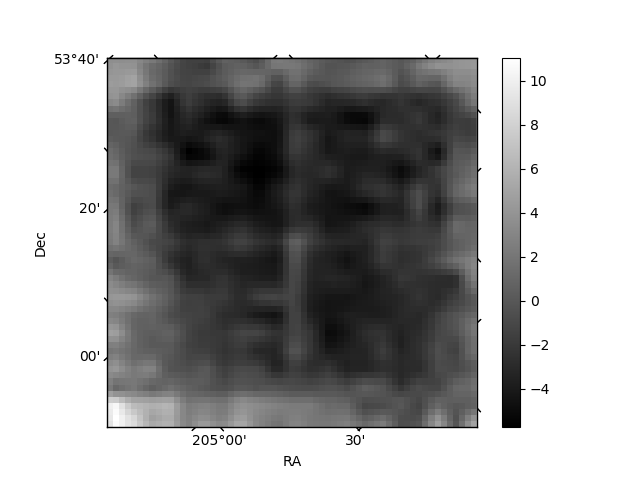
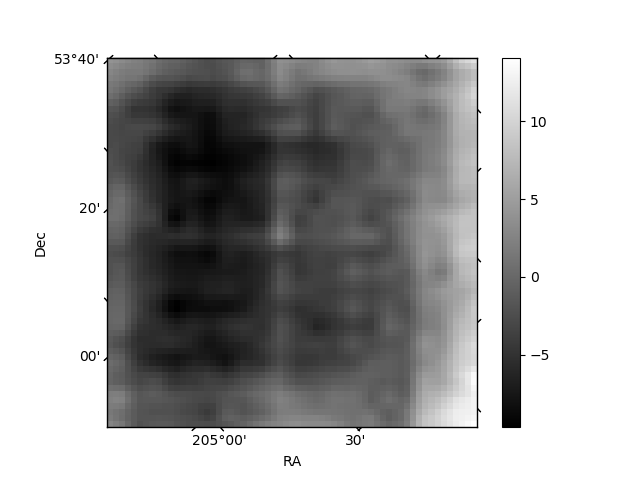
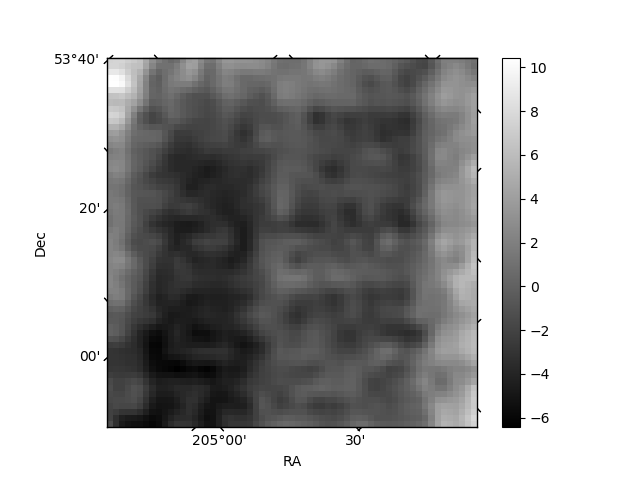
Histogram calculated using DETX and DETY for each event in the final _common_clean file
| Quadrant A | 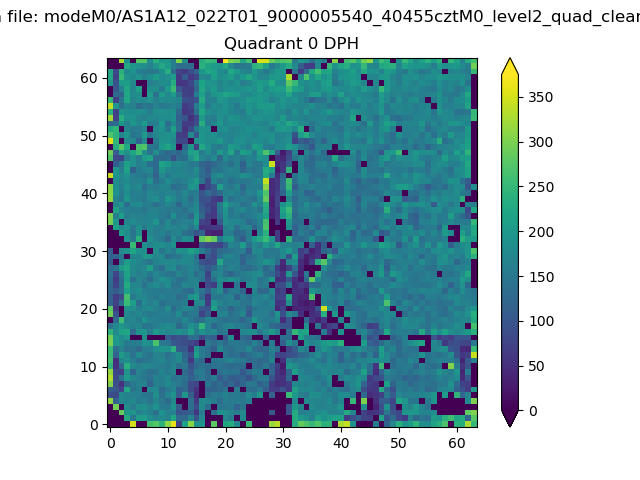 |
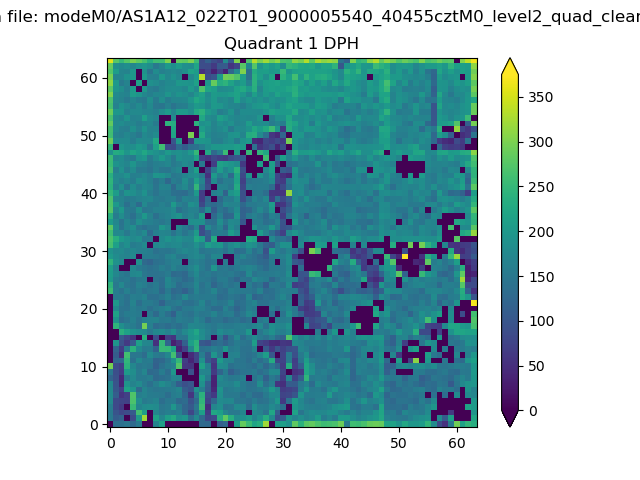 |
Quadrant B |
|---|---|---|---|
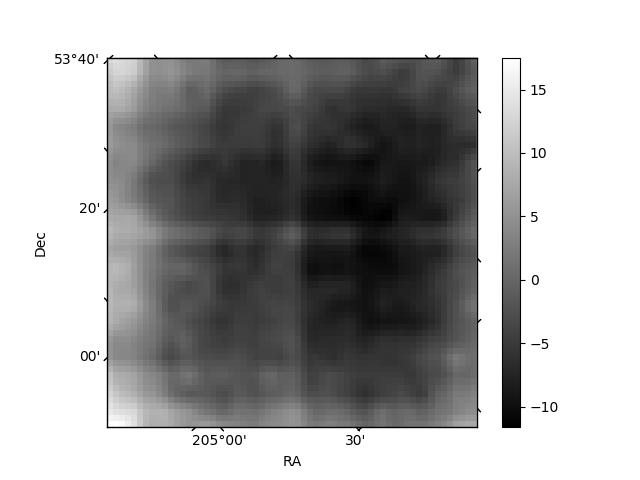
| Quadrant D | 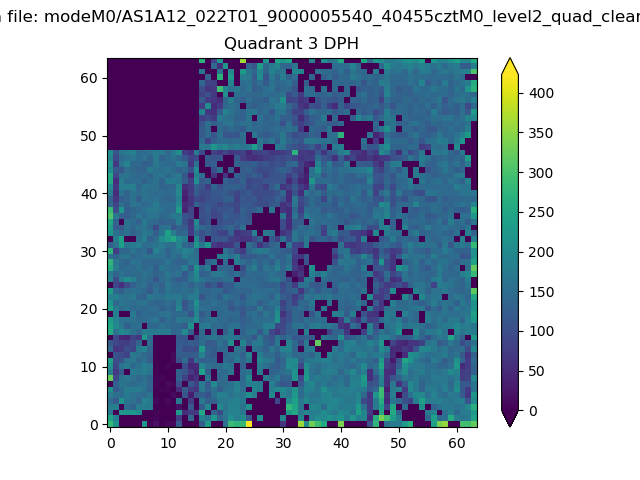 |
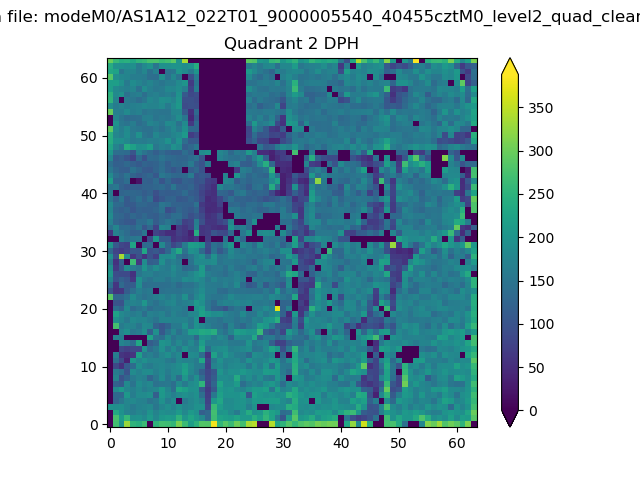 |
Quadrant C |
| Plot type | Count rate plots | Images |
|---|---|---|
| Comparison with Poisson distribution Blue bars denote a histogram of data divided into 1 sec bins. Red curve is a Poisson curve with rate = median count rate of data. |
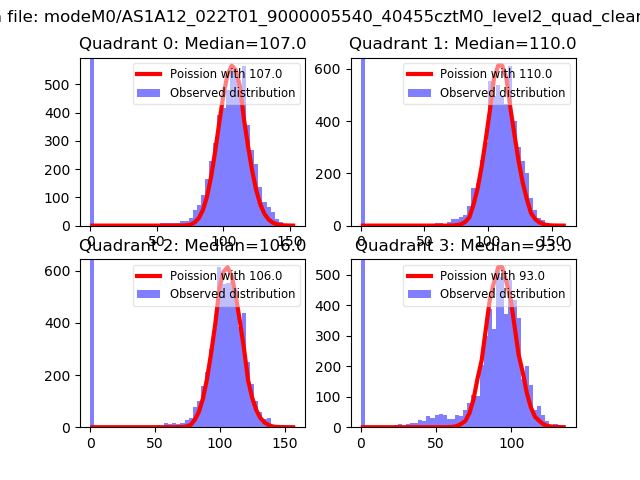 |
 |
| Quadrant-wise count rates Data is divided into 100 sec bins |
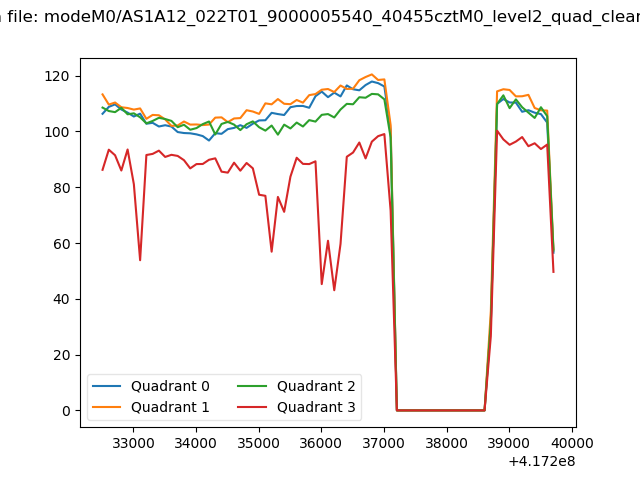 |
|
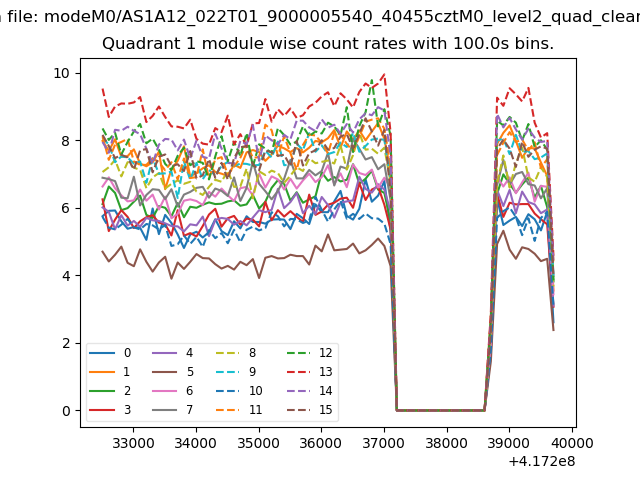
| Module-wise count rates for Quadrant A Data is divided into 100 sec bins |
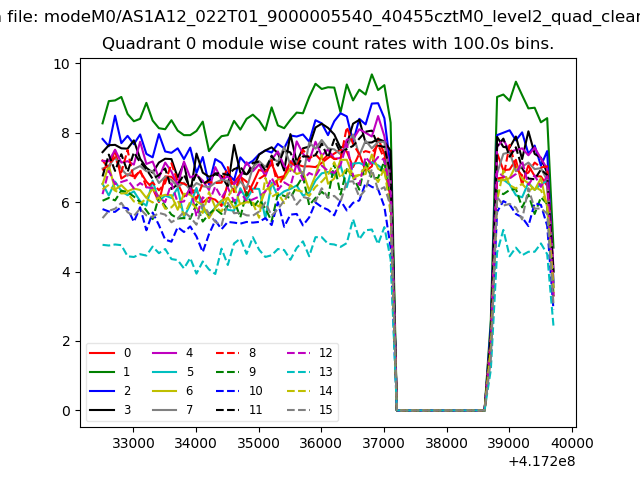 |
 |
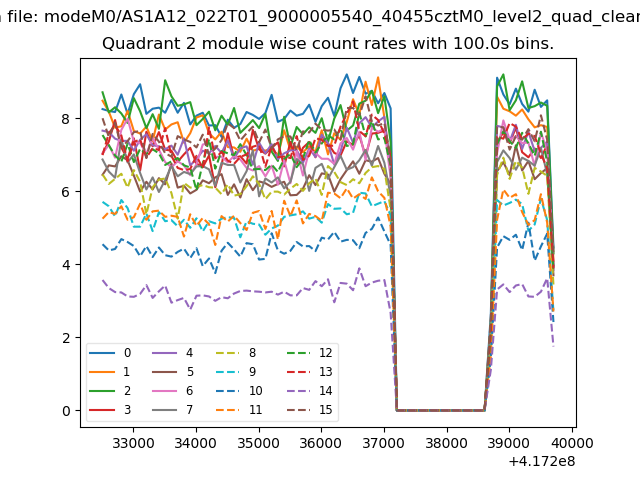
| Module-wise count rates for Quadrant B Data is divided into 100 sec bins |
 |
 |
| Module-wise count rates for Quadrant C Data is divided into 100 sec bins |
 |
 |
| Module-wise count rates for Quadrant D Data is divided into 100 sec bins |
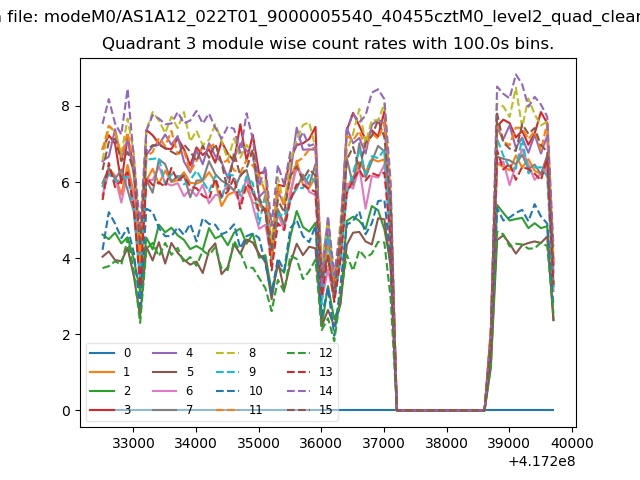 |
 |
| Parameter | Plot |
|---|---|
| CZT HV Monitor | 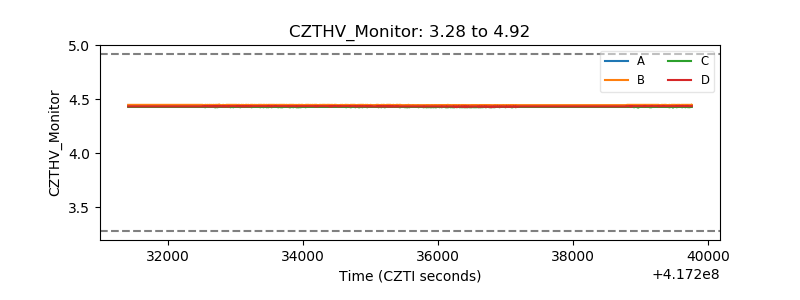 |
| D_VDD | 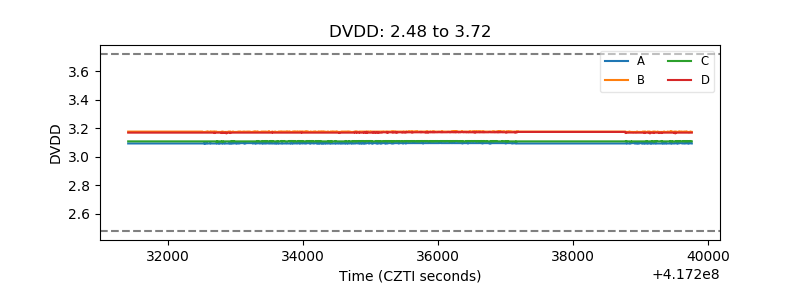 |
| Temperature 1 | 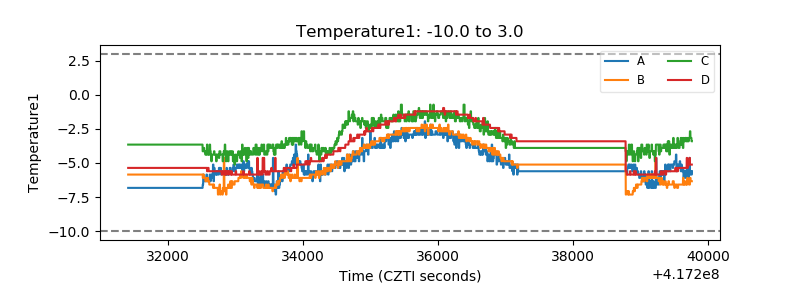 |
| Veto HV Monitor | 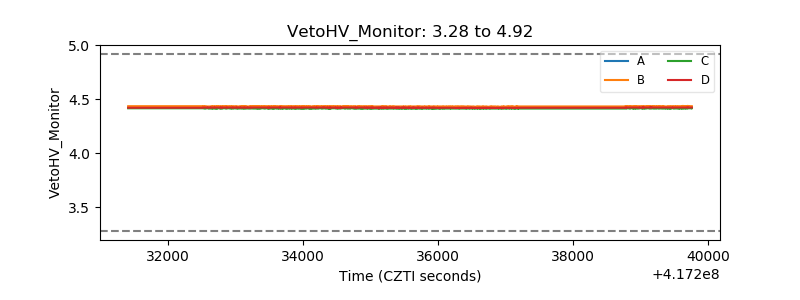 |
| Veto LLD | 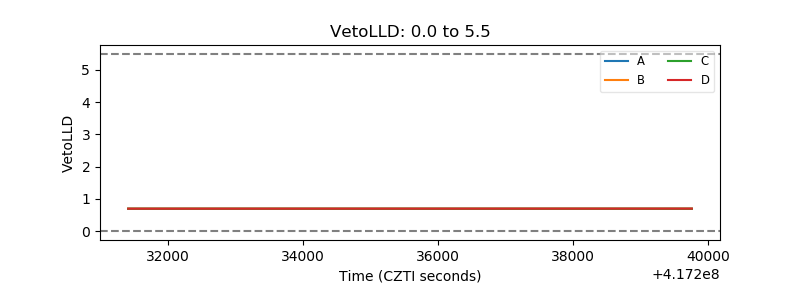 |
| Alpha Counter | 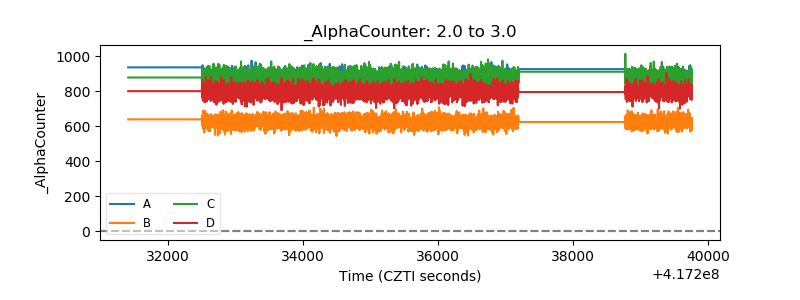 |
| _CPM_Rate | 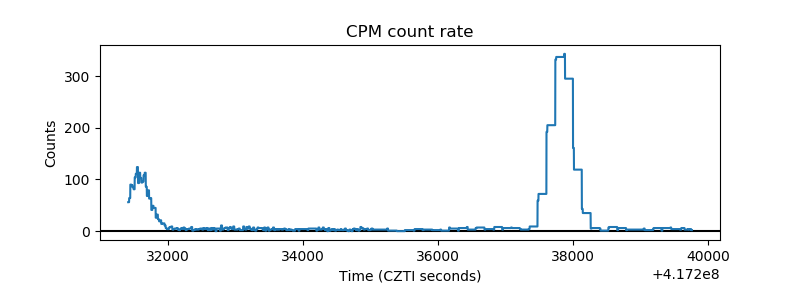 |
| CZT Counter | 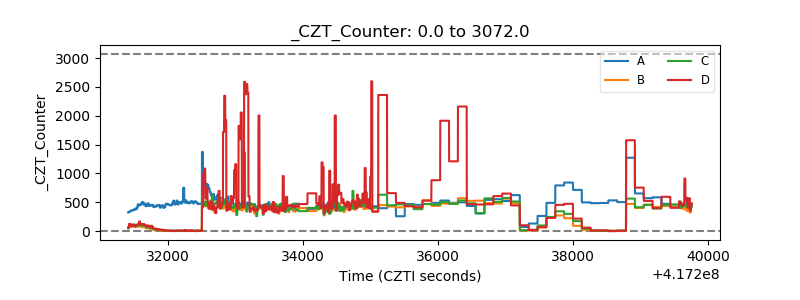 |
| +2.5 Volts monitor | 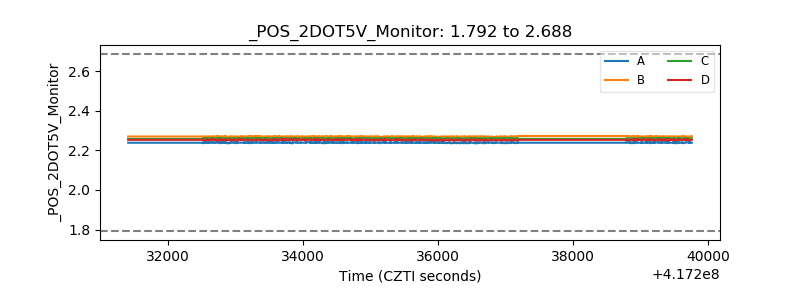 |
| +5 Volts monitor | 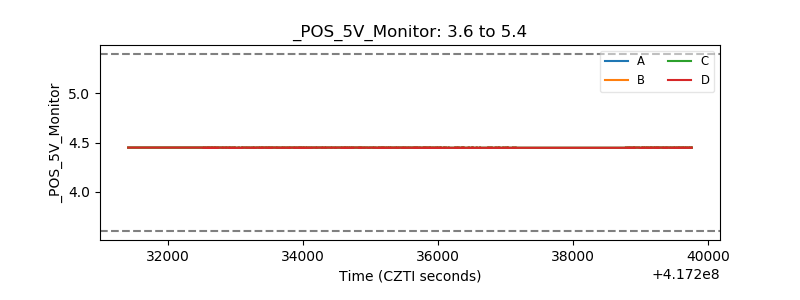 |
| _ROLL_ROT | 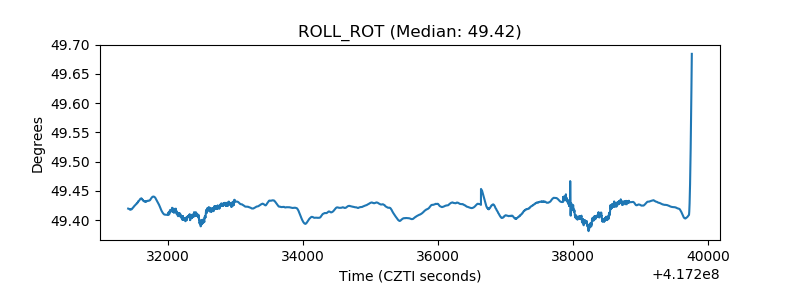 |
| _Roll_DEC | 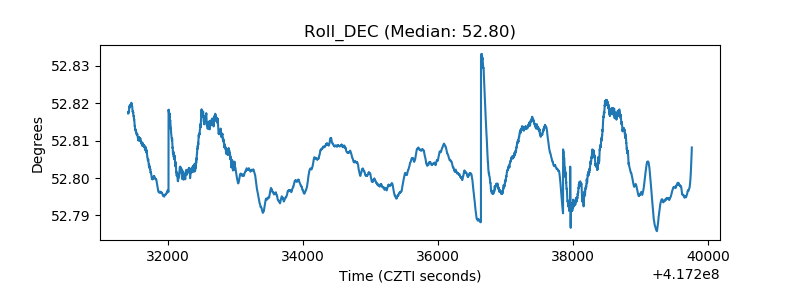 |
| _Roll_RA | 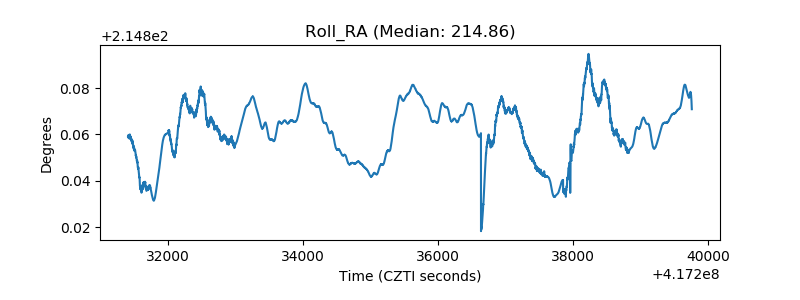 |
| Veto Counter | 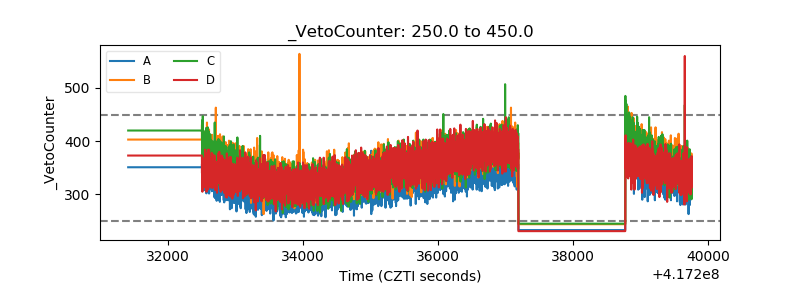 |