| Param | Original file | Final file |
|---|---|---|
| Filename | modeM0/AS1A12_022T01_9000005540_40456cztM0_level2.fits | modeM0/AS1A12_022T01_9000005540_40456cztM0_level2_quad_clean.evt |
| Size (bytes) | 354,041,280 | 91,650,240 |
| Size | 337.6 MB | 87.4 MB |
| Events in quadrant A | 2,925,010 | 621,866 |
| Events in quadrant B | 2,562,017 | 641,980 |
| Events in quadrant C | 2,700,006 | 613,456 |
| Events in quadrant D | 4,473,868 | 498,829 |
| Mode M0 | |||
|---|---|---|---|
| Quadrant | BADHDUFLAG | Total packets | Discarded packets |
| A | 0 | 12203 | 3 |
| B | 0 | 11589 | 2 |
| C | 0 | 11737 | 2 |
| D | 0 | 17268 | 2 |
| Mode M9 | |||
|---|---|---|---|
| Quadrant | BADHDUFLAG | Total packets | Discarded packets |
| A | 0 | 23 | 0 |
| B | 0 | 23 | 0 |
| C | 0 | 23 | 0 |
| D | 0 | 24 | 0 |
| Mode SS | |||
|---|---|---|---|
| Quadrant | BADHDUFLAG | Total packets | Discarded packets |
| A | 0 | 116 | 0 |
| B | 0 | 116 | 0 |
| C | 0 | 116 | 0 |
| D | 0 | 116 | 0 |
| Quadrant | Total seconds | Saturated seconds | Saturation percentage |
|---|---|---|---|
| A | 5704 | 10 | 0.175316% |
| B | 5704 | 4 | 0.070126% |
| C | 5704 | 14 | 0.245442% |
| D | 5704 | 774 | 13.569425% |
Noise dominated data is calculated using 1-second bins in cleaned event files. If a bin has >2000 counts, and if more than 50% of those come from <1% of pixels, then it is considered to be noise-dominated and hence unusable.
| Quadrant | # 1 sec bins | Bins with >0 counts | Bins with >2000 counts | High rate bins dominated by noise | Noise dominated (total time) | Noise dominated (detector-on time) | Marked lightcurve |
|---|---|---|---|---|---|---|---|
| A | 7407 | 5705 | 6 | 6 | 0.08% | 0.11% | 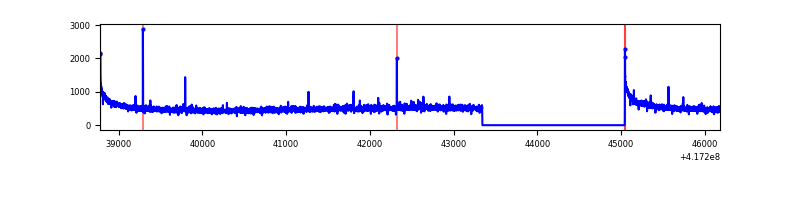 |
| B | 7407 | 5705 | 0 | 0 | 0.00% | 0.00% | 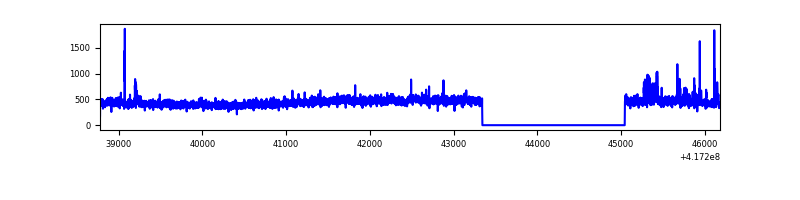 |
| C | 7407 | 5705 | 8 | 8 | 0.11% | 0.14% | 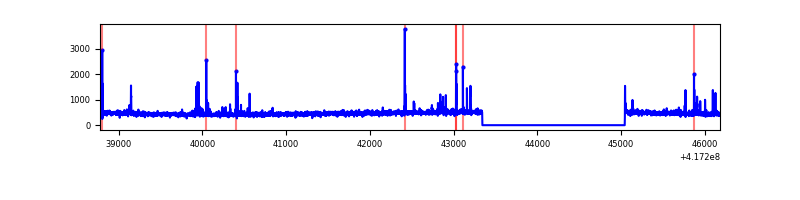 |
| D | 7407 | 5705 | 364 | 364 | 4.91% | 6.38% | 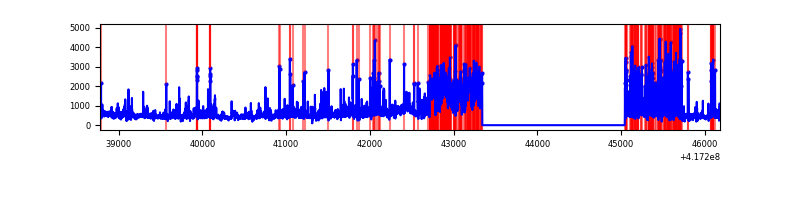 |
Top three noisy pixels from each quadrant. If the there are fewer than three noisy pixels in the level2.evt file, extra rows are filled as -1
| Pixel properties | Quadrant properties | ||||||
|---|---|---|---|---|---|---|---|
| Quadrant | DetID | PixID | Counts | Sigma | Mean | Median | Sigma |
| A | 10 | 83 | 505297 | 4029.55 | 615 | 603 | 125.2 |
| A | 3 | 1 | 17289 | 133.22 | 615 | 603 | 125.2 |
| A | 2 | 79 | 17263 | 133.02 | 615 | 603 | 125.2 |
| B | 0 | 230 | 54383 | 455.77 | 610 | 593 | 118.0 |
| B | 4 | 170 | 43785 | 365.97 | 610 | 593 | 118.0 |
| B | 3 | 112 | 31903 | 265.29 | 610 | 593 | 118.0 |
| C | 15 | 214 | 249293 | 1798.3 | 595 | 599 | 138.3 |
| C | 14 | 254 | 104447 | 750.92 | 595 | 599 | 138.3 |
| C | 3 | 233 | 14868 | 103.18 | 595 | 599 | 138.3 |
| D | 12 | 227 | 1685190 | 12220.25 | 562 | 546 | 137.9 |
| D | 13 | 249 | 209466 | 1515.49 | 562 | 546 | 137.9 |
| D | 12 | 128 | 176771 | 1278.32 | 562 | 546 | 137.9 |
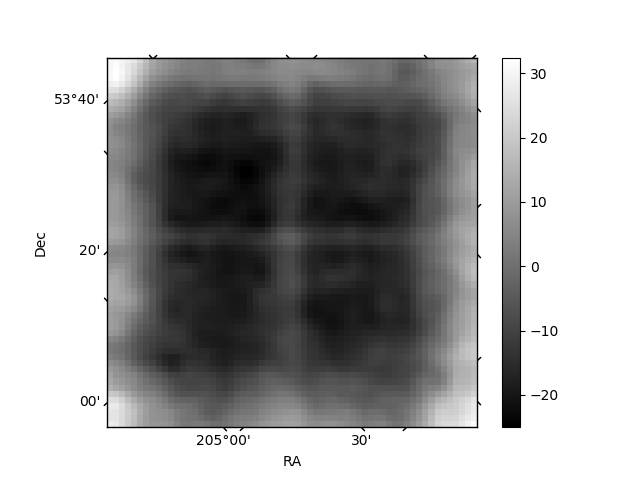
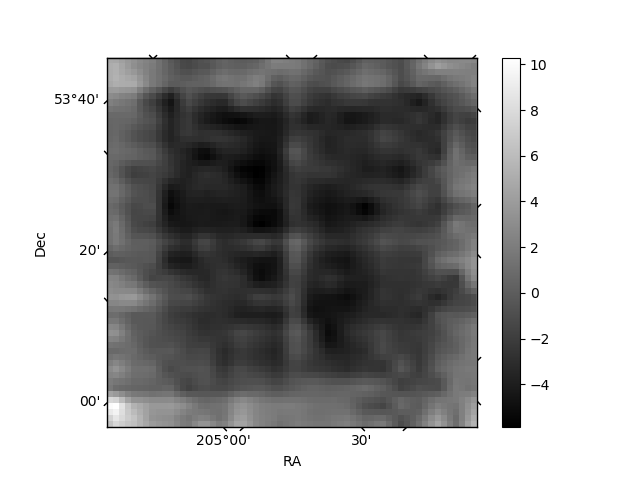
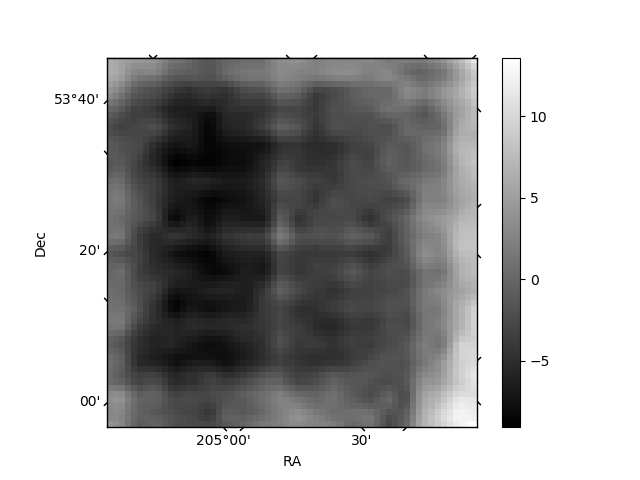
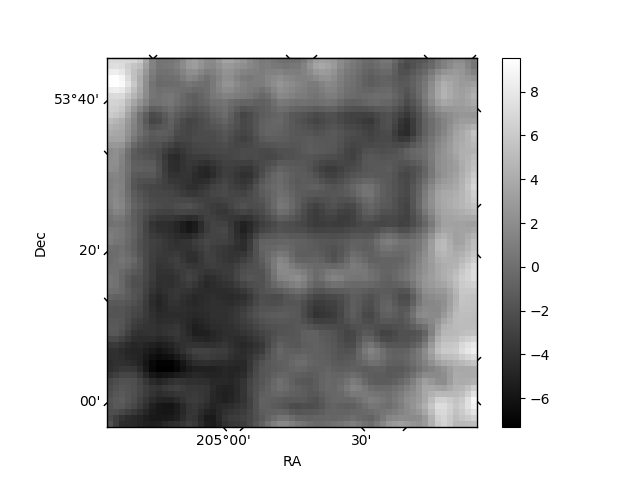
Histogram calculated using DETX and DETY for each event in the final _common_clean file
| Quadrant A | 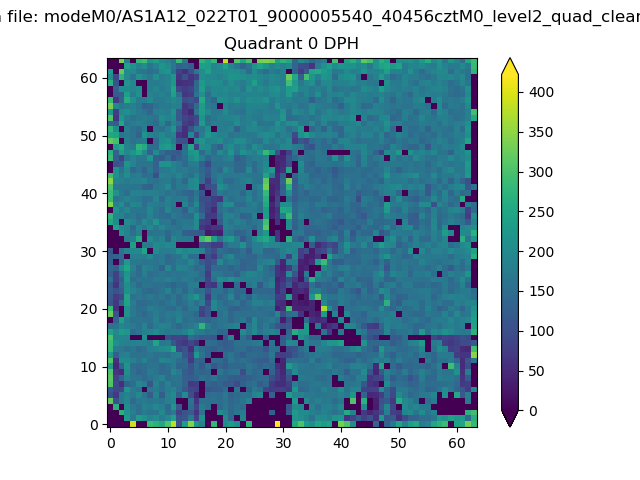 |
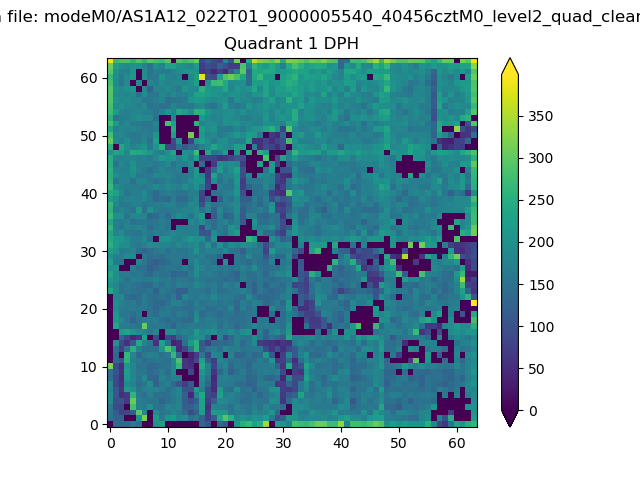 |
Quadrant B |
|---|---|---|---|
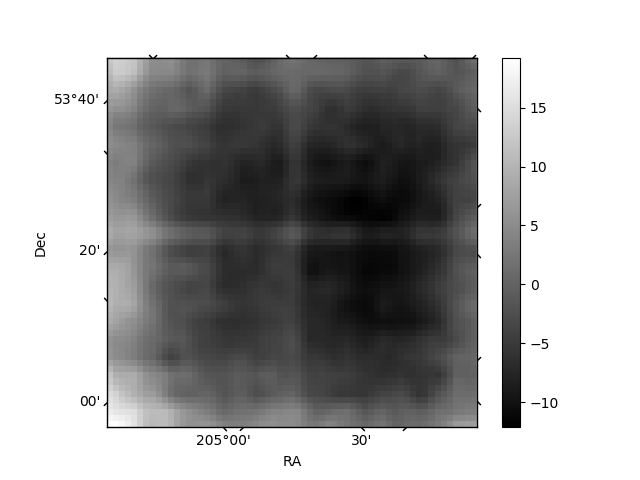
| Quadrant D | 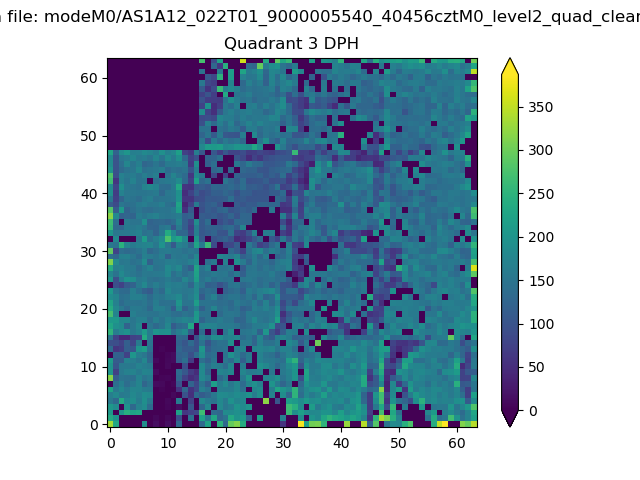 |
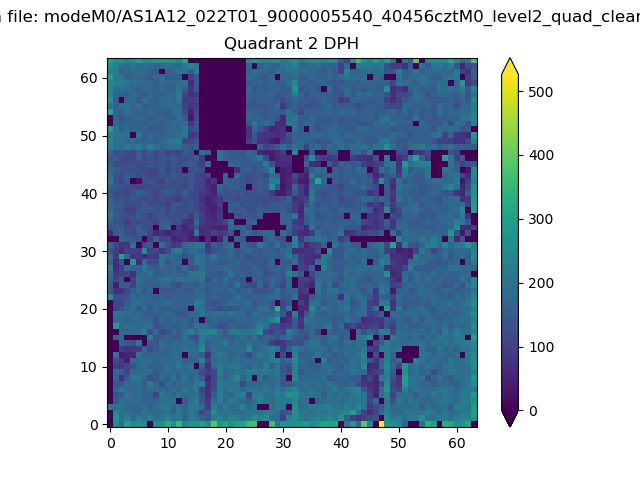 |
Quadrant C |
| Plot type | Count rate plots | Images |
|---|---|---|
| Comparison with Poisson distribution Blue bars denote a histogram of data divided into 1 sec bins. Red curve is a Poisson curve with rate = median count rate of data. |
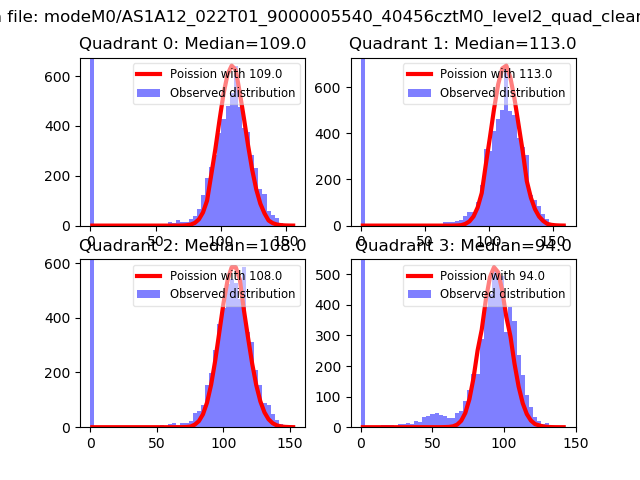 |
 |
| Quadrant-wise count rates Data is divided into 100 sec bins |
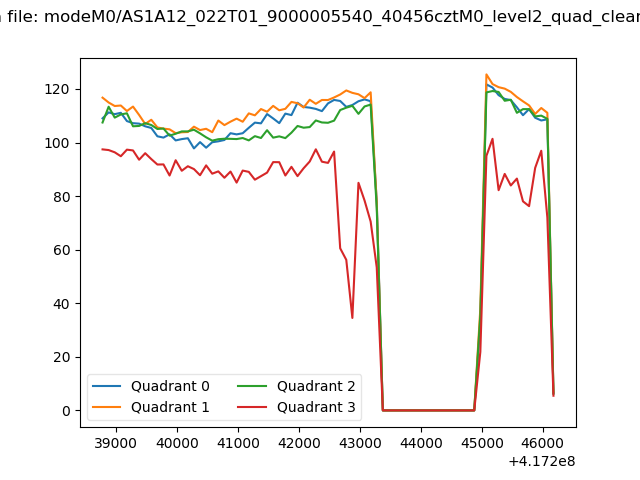 |
|
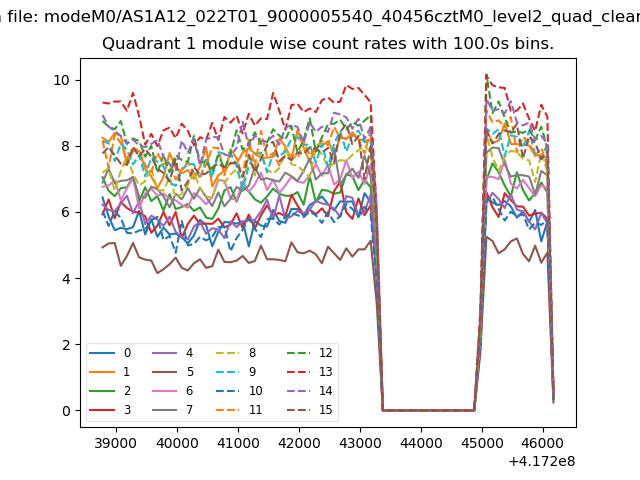
| Module-wise count rates for Quadrant A Data is divided into 100 sec bins |
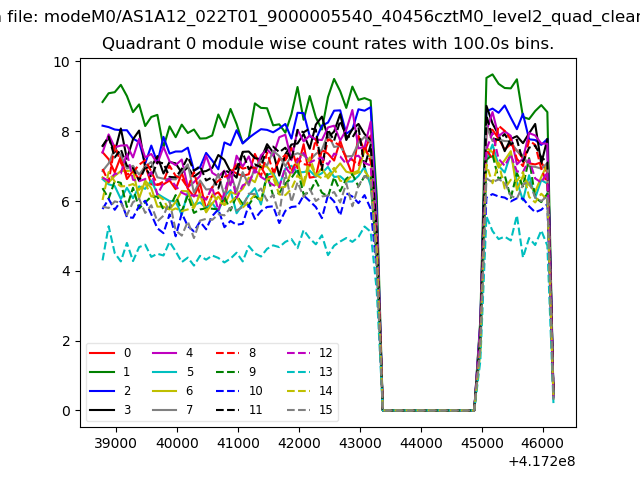 |
 |
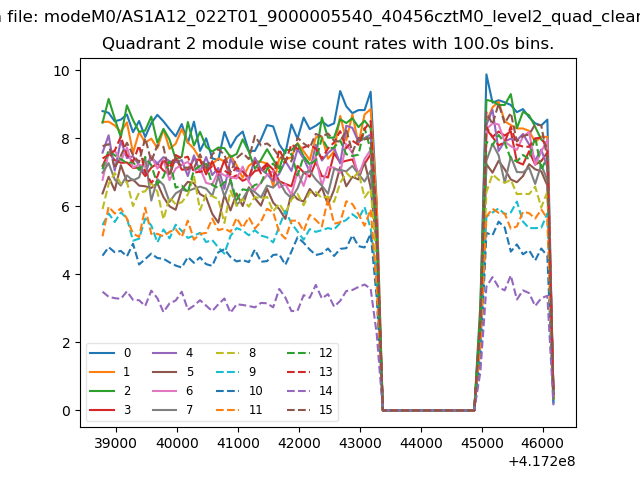
| Module-wise count rates for Quadrant B Data is divided into 100 sec bins |
 |
 |
| Module-wise count rates for Quadrant C Data is divided into 100 sec bins |
 |
 |
| Module-wise count rates for Quadrant D Data is divided into 100 sec bins |
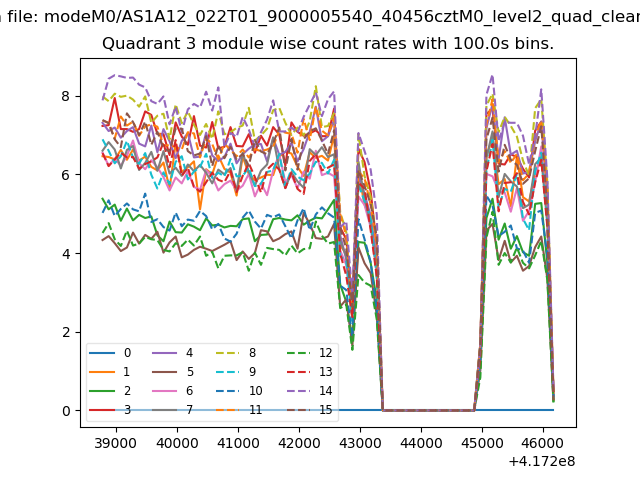 |
 |
| Parameter | Plot |
|---|---|
| CZT HV Monitor | 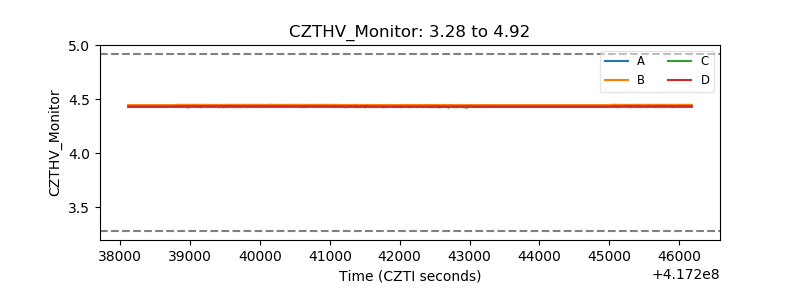 |
| D_VDD | 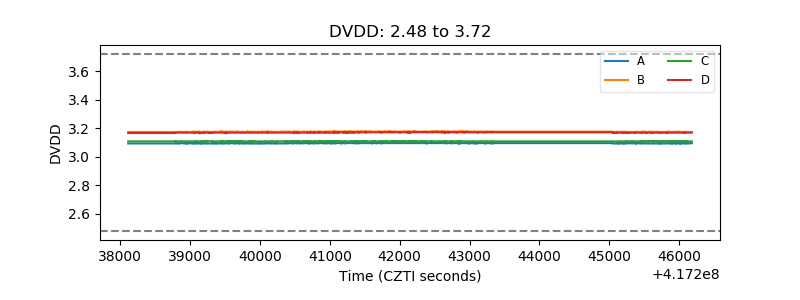 |
| Temperature 1 | 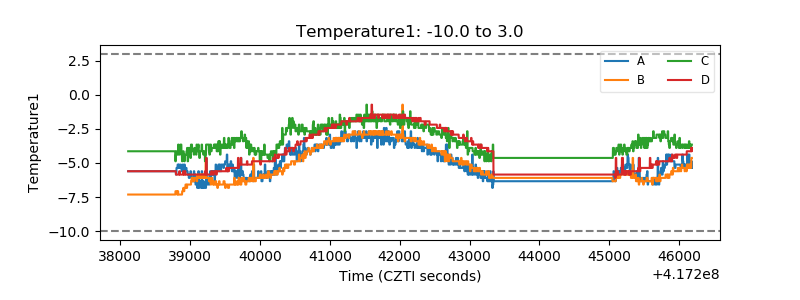 |
| Veto HV Monitor | 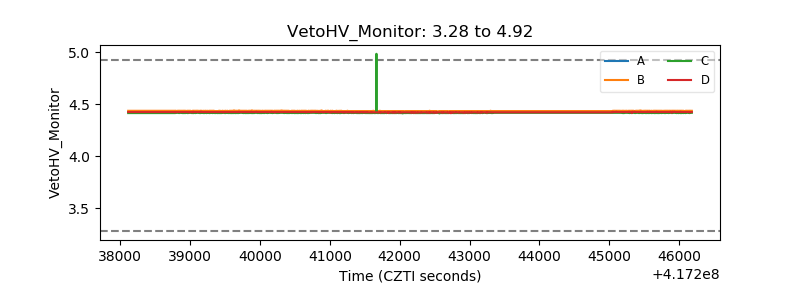 |
| Veto LLD | 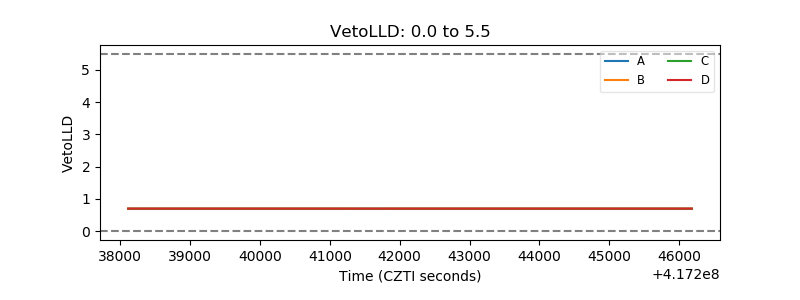 |
| Alpha Counter | 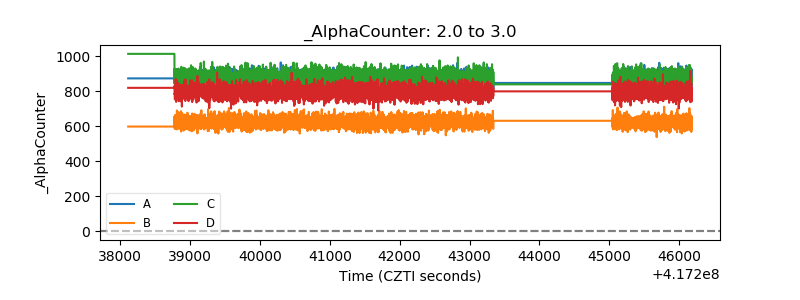 |
| _CPM_Rate | 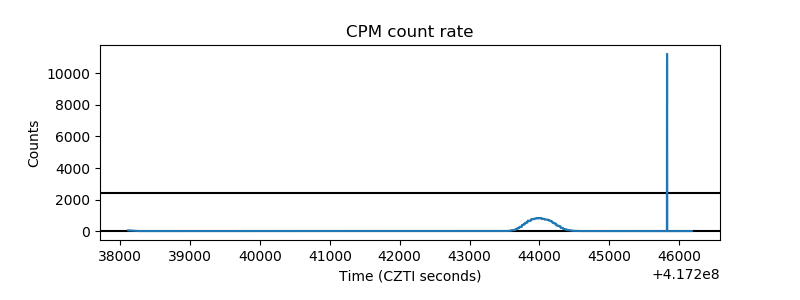 |
| CZT Counter | 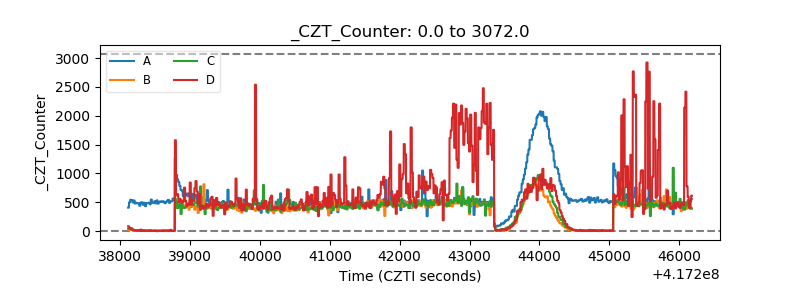 |
| +2.5 Volts monitor | 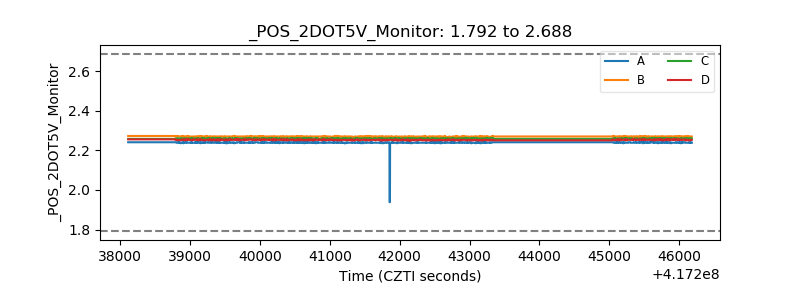 |
| +5 Volts monitor |  |
| _ROLL_ROT | 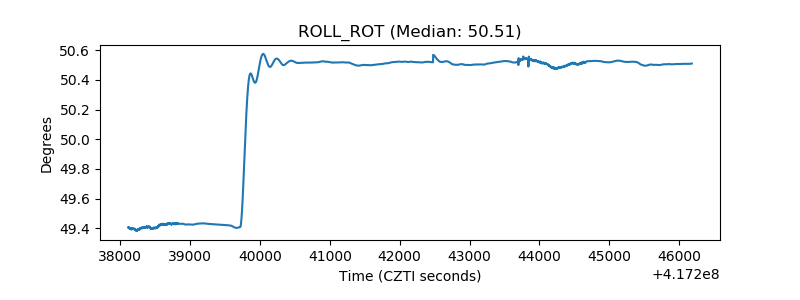 |
| _Roll_DEC | 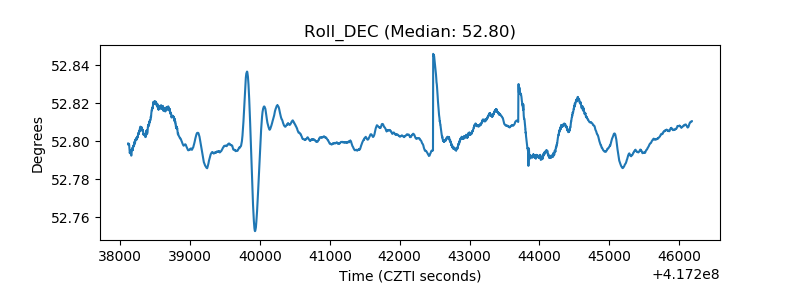 |
| _Roll_RA | 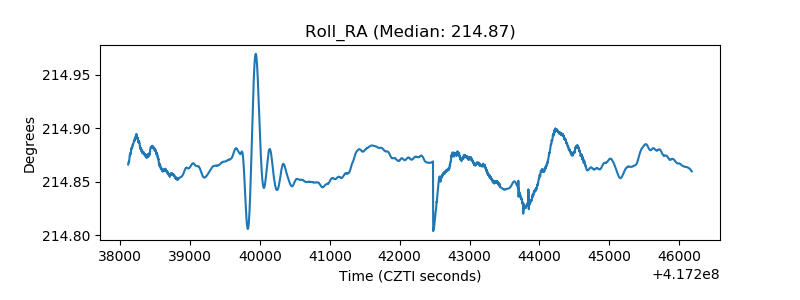 |
| Veto Counter | 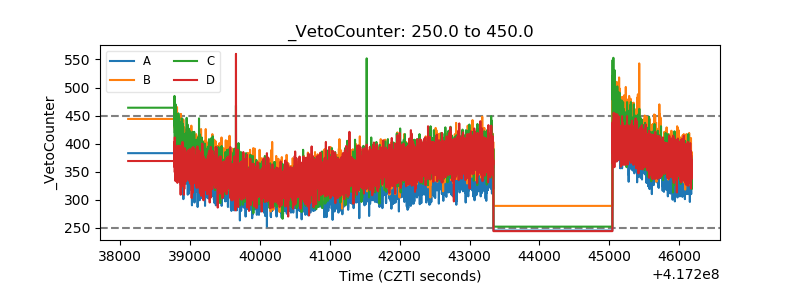 |