| Param | Original file | Final file |
|---|---|---|
| Filename | modeM0/AS1A12_022T01_9000005540_40460cztM0_level2.fits | modeM0/AS1A12_022T01_9000005540_40460cztM0_level2_quad_clean.evt |
| Size (bytes) | 343,192,320 | 94,939,200 |
| Size | 327.3 MB | 90.5 MB |
| Events in quadrant A | 2,909,967 | 671,904 |
| Events in quadrant B | 2,662,061 | 685,085 |
| Events in quadrant C | 2,698,524 | 635,241 |
| Events in quadrant D | 4,028,188 | 518,827 |
| Mode M0 | |||
|---|---|---|---|
| Quadrant | BADHDUFLAG | Total packets | Discarded packets |
| A | 0 | 11659 | 3 |
| B | 0 | 11109 | 2 |
| C | 0 | 10980 | 2 |
| D | 0 | 15368 | 2 |
| Mode M9 | |||
|---|---|---|---|
| Quadrant | BADHDUFLAG | Total packets | Discarded packets |
| A | 0 | 29 | 0 |
| B | 0 | 29 | 0 |
| C | 0 | 29 | 0 |
| D | 0 | 30 | 0 |
| Mode SS | |||
|---|---|---|---|
| Quadrant | BADHDUFLAG | Total packets | Discarded packets |
| A | 0 | 106 | 0 |
| B | 0 | 106 | 0 |
| C | 0 | 106 | 0 |
| D | 0 | 106 | 0 |
| Quadrant | Total seconds | Saturated seconds | Saturation percentage |
|---|---|---|---|
| A | 5197 | 11 | 0.211661% |
| B | 5197 | 19 | 0.365596% |
| C | 5197 | 20 | 0.384837% |
| D | 5197 | 734 | 14.123533% |
Noise dominated data is calculated using 1-second bins in cleaned event files. If a bin has >2000 counts, and if more than 50% of those come from <1% of pixels, then it is considered to be noise-dominated and hence unusable.
| Quadrant | # 1 sec bins | Bins with >0 counts | Bins with >2000 counts | High rate bins dominated by noise | Noise dominated (total time) | Noise dominated (detector-on time) | Marked lightcurve |
|---|---|---|---|---|---|---|---|
| A | 7259 | 5198 | 2 | 2 | 0.03% | 0.04% | 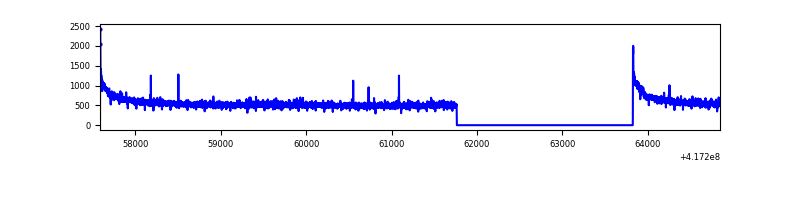 |
| B | 7259 | 5198 | 4 | 4 | 0.06% | 0.08% | 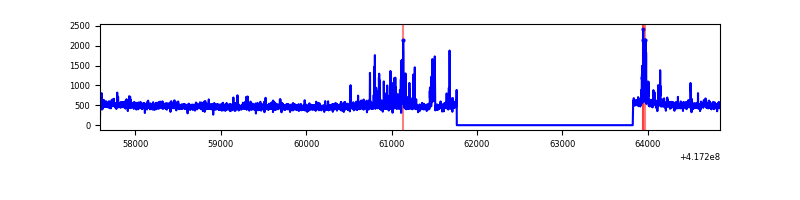 |
| C | 7259 | 5198 | 8 | 8 | 0.11% | 0.15% | 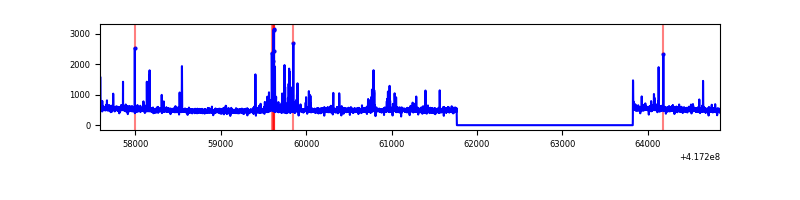 |
| D | 7259 | 5198 | 326 | 326 | 4.49% | 6.27% | 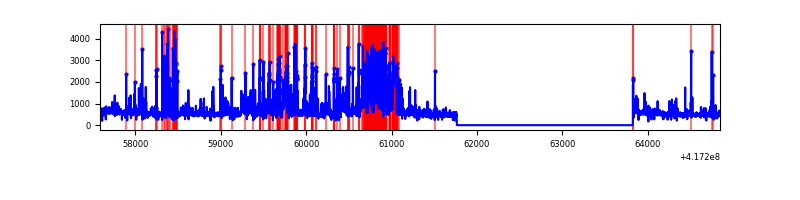 |
Top three noisy pixels from each quadrant. If the there are fewer than three noisy pixels in the level2.evt file, extra rows are filled as -1
| Pixel properties | Quadrant properties | ||||||
|---|---|---|---|---|---|---|---|
| Quadrant | DetID | PixID | Counts | Sigma | Mean | Median | Sigma |
| A | 10 | 83 | 471305 | 3709.38 | 624 | 614 | 126.9 |
| A | 12 | 189 | 17333 | 131.76 | 624 | 614 | 126.9 |
| A | 3 | 1 | 8762 | 64.21 | 624 | 614 | 126.9 |
| B | 4 | 170 | 186709 | 1605.16 | 613 | 597 | 115.9 |
| B | 0 | 230 | 42351 | 360.12 | 613 | 597 | 115.9 |
| B | 3 | 112 | 14660 | 121.29 | 613 | 597 | 115.9 |
| C | 15 | 214 | 226025 | 1650.09 | 595 | 598 | 136.6 |
| C | 14 | 254 | 141559 | 1031.81 | 595 | 598 | 136.6 |
| C | 0 | 10 | 7096 | 47.56 | 595 | 598 | 136.6 |
| D | 2 | 250 | 1103150 | 8057.64 | 560 | 547 | 136.8 |
| D | 12 | 227 | 424642 | 3099.22 | 560 | 547 | 136.8 |
| D | 12 | 191 | 130023 | 946.19 | 560 | 547 | 136.8 |
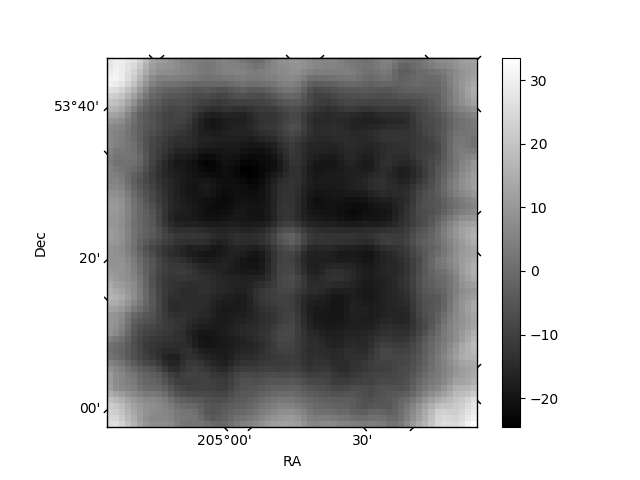
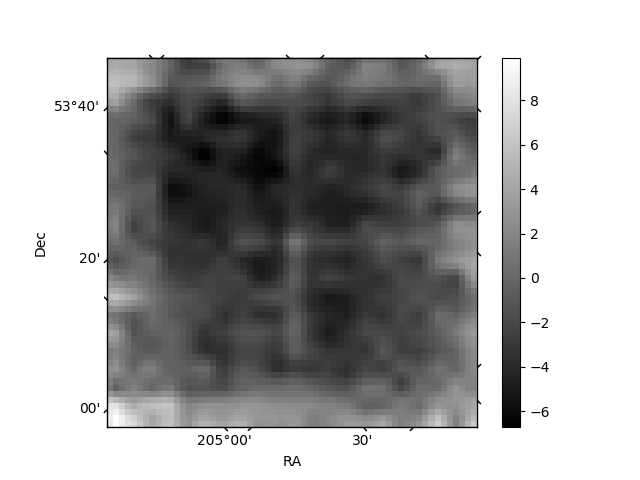
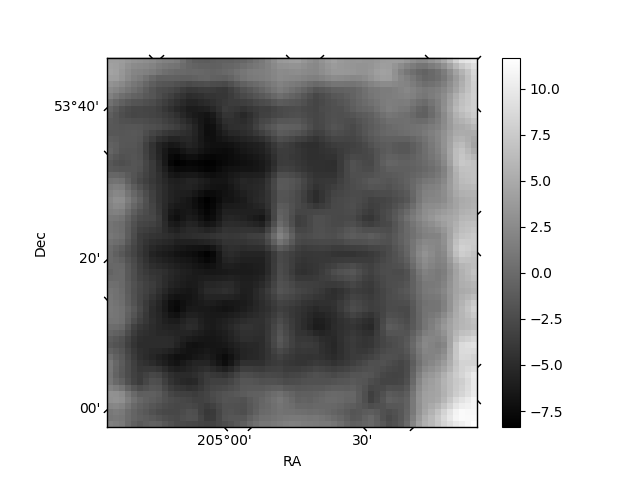
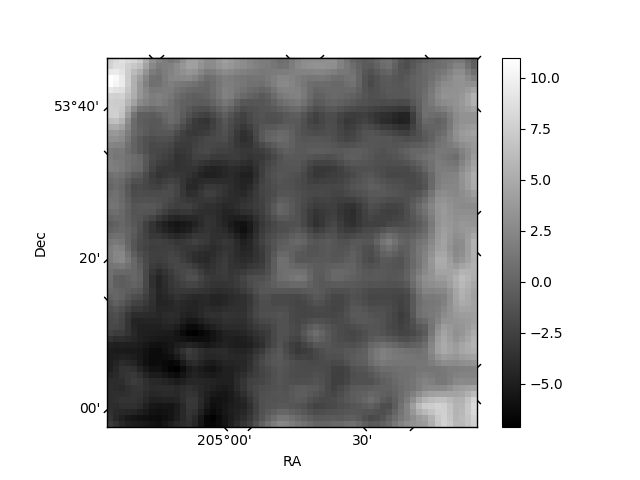
Histogram calculated using DETX and DETY for each event in the final _common_clean file
| Quadrant A | 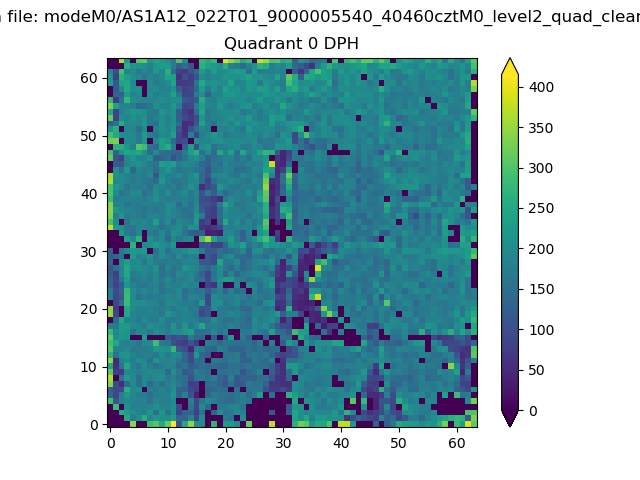 |
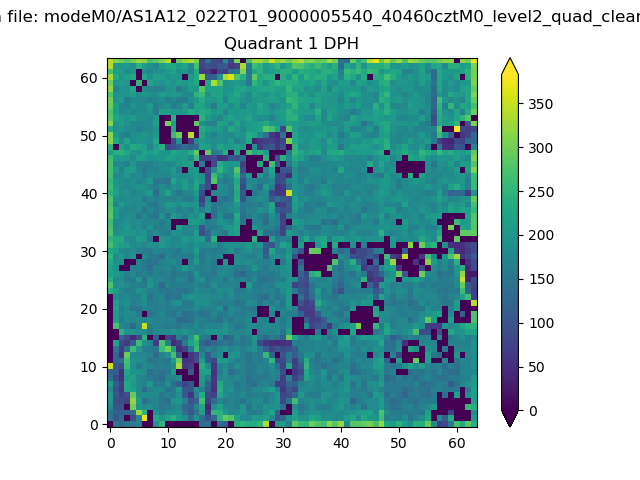 |
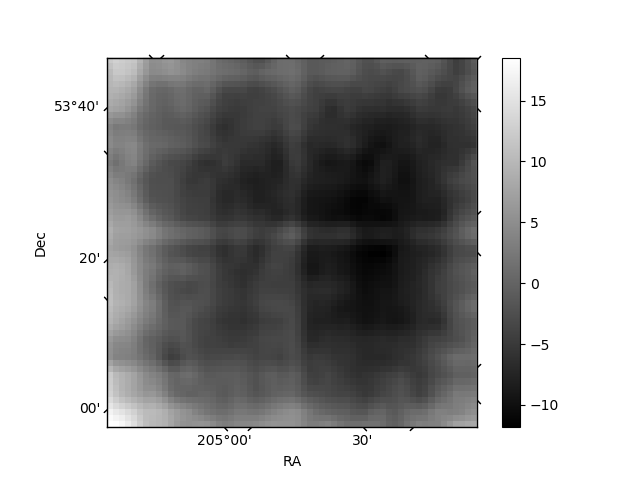
Quadrant B |
|---|---|---|---|
| Quadrant D | 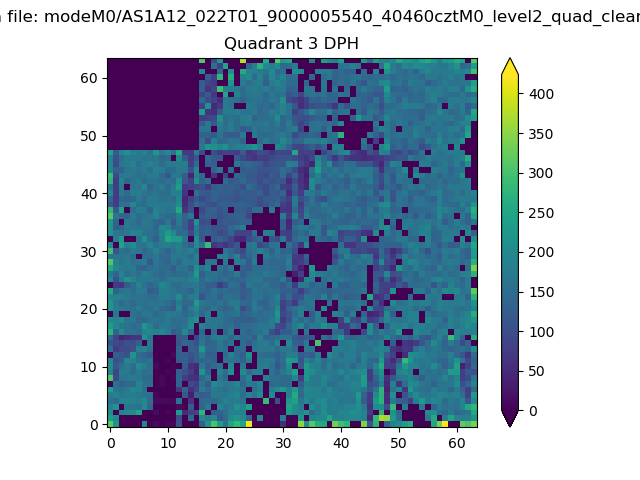 |
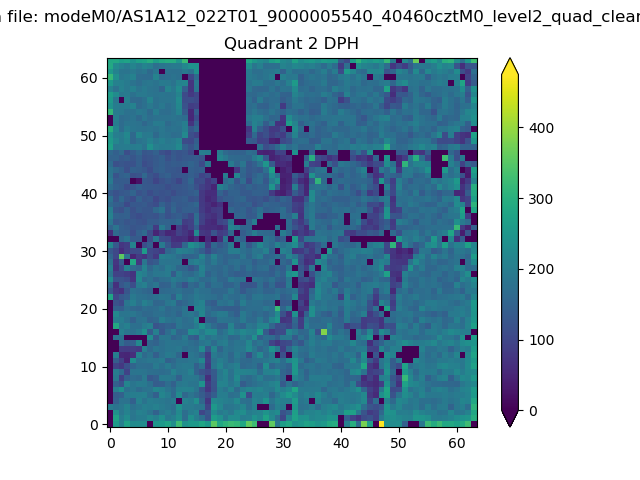 |
Quadrant C |
| Plot type | Count rate plots | Images |
|---|---|---|
| Comparison with Poisson distribution Blue bars denote a histogram of data divided into 1 sec bins. Red curve is a Poisson curve with rate = median count rate of data. |
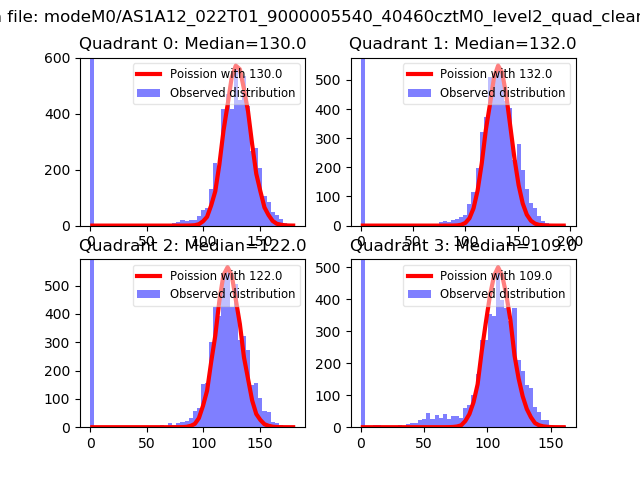 |
 |
| Quadrant-wise count rates Data is divided into 100 sec bins |
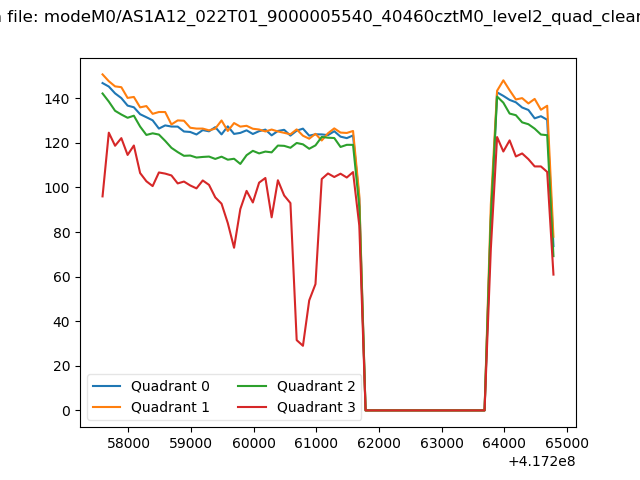 |
|
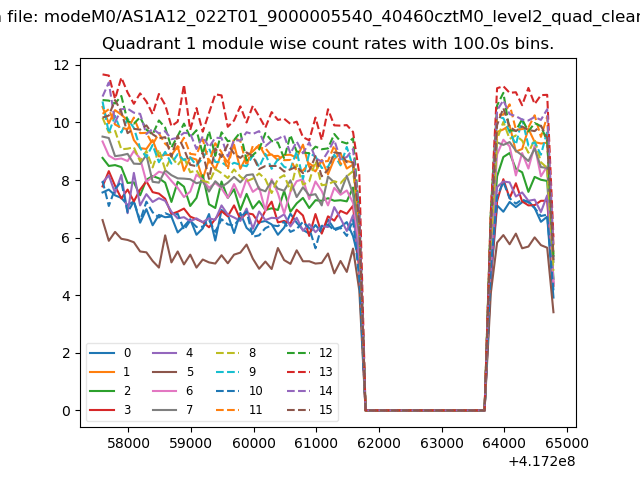
| Module-wise count rates for Quadrant A Data is divided into 100 sec bins |
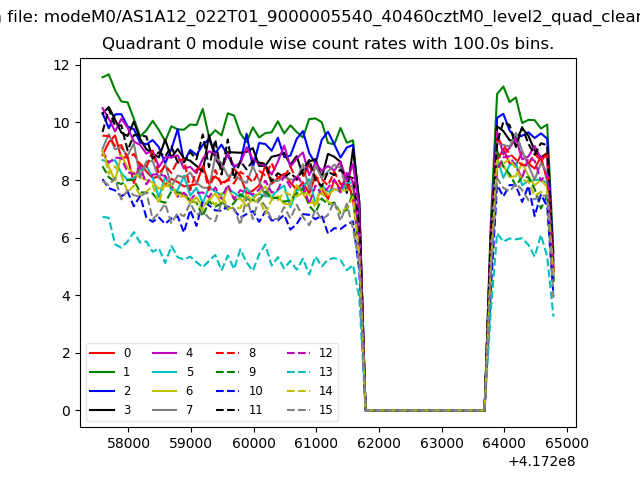 |
 |
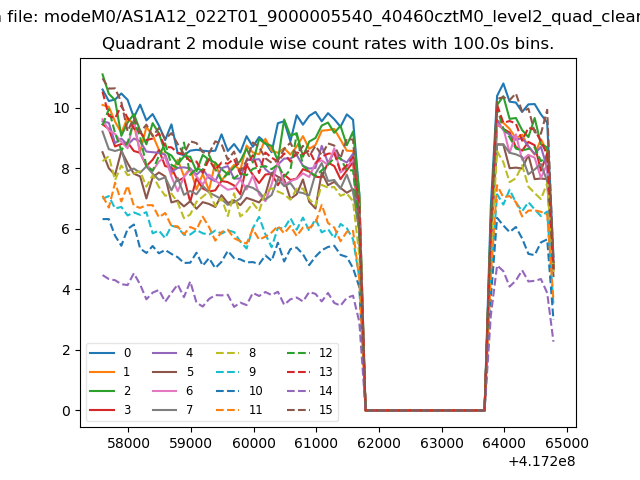
| Module-wise count rates for Quadrant B Data is divided into 100 sec bins |
 |
 |
| Module-wise count rates for Quadrant C Data is divided into 100 sec bins |
 |
 |
| Module-wise count rates for Quadrant D Data is divided into 100 sec bins |
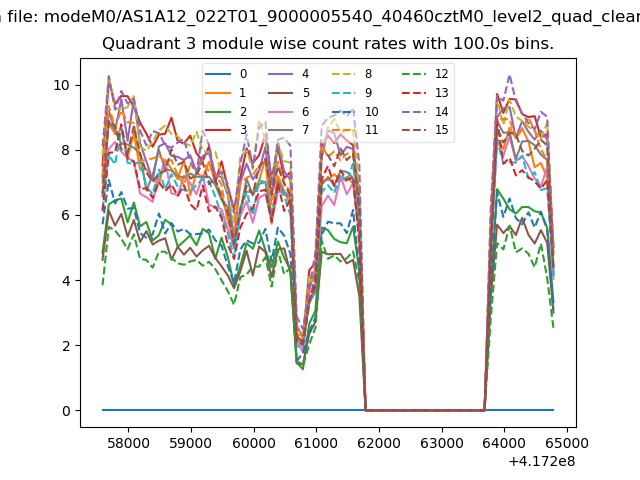 |
 |
| Parameter | Plot |
|---|---|
| CZT HV Monitor | 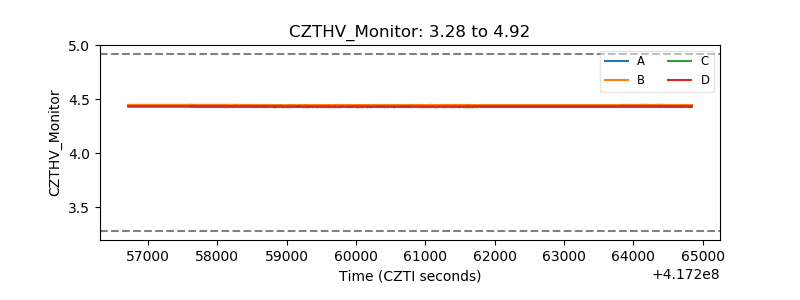 |
| D_VDD | 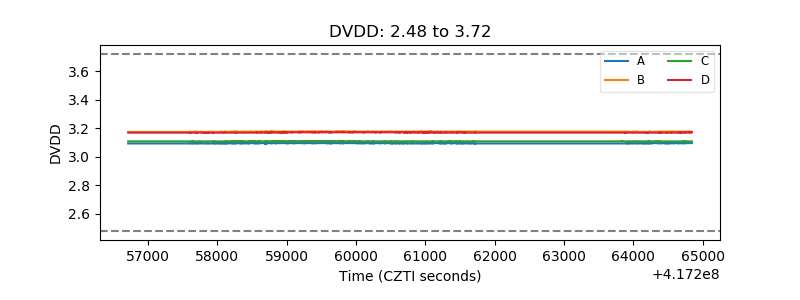 |
| Temperature 1 | 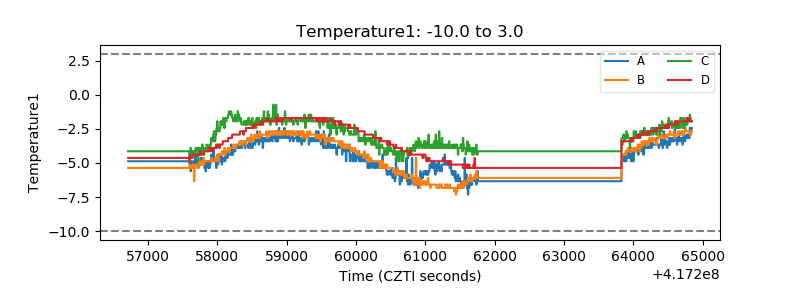 |
| Veto HV Monitor | 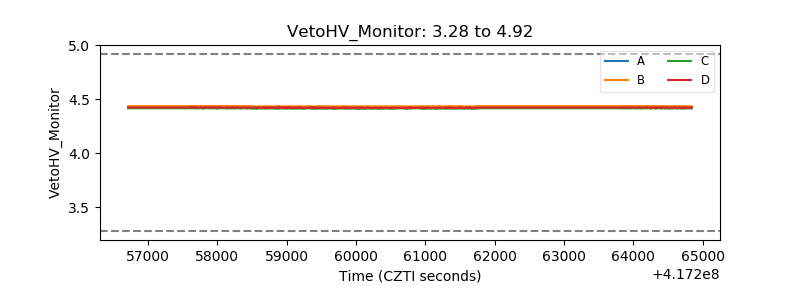 |
| Veto LLD | 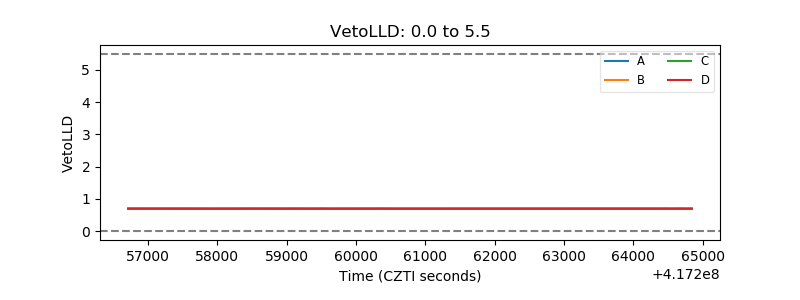 |
| Alpha Counter | 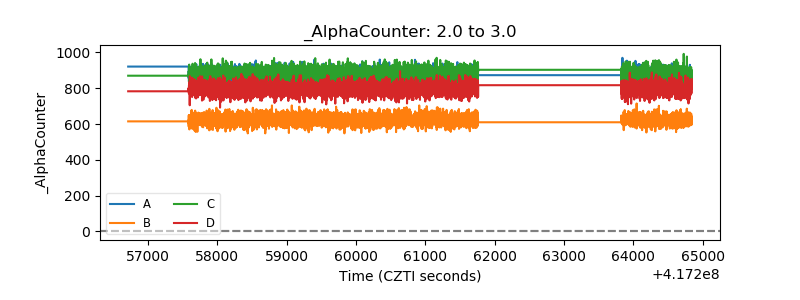 |
| _CPM_Rate | 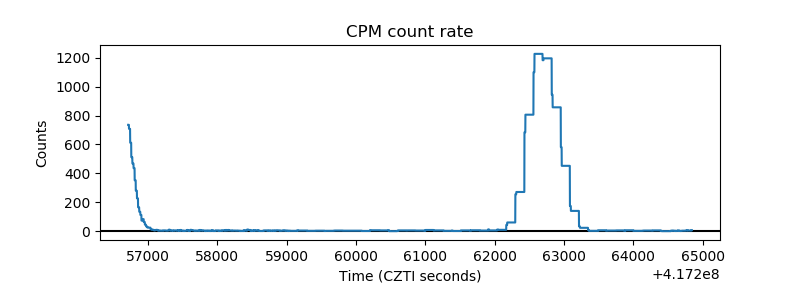 |
| CZT Counter | 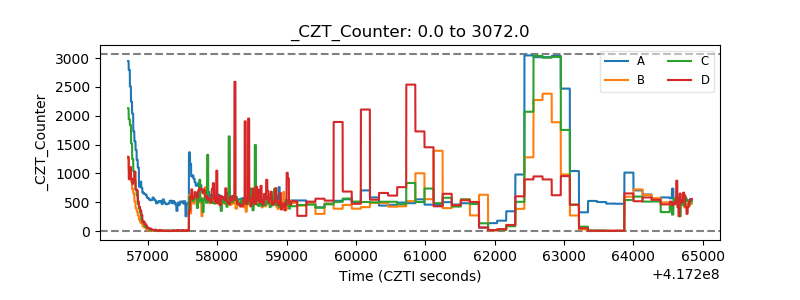 |
| +2.5 Volts monitor | 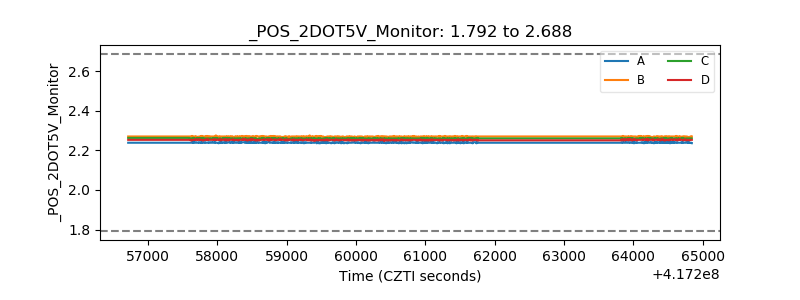 |
| +5 Volts monitor | 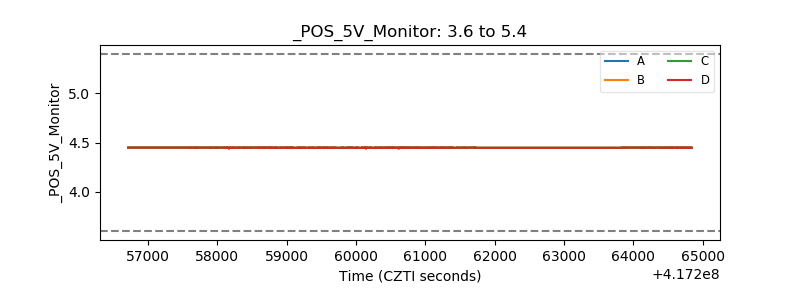 |
| _ROLL_ROT | 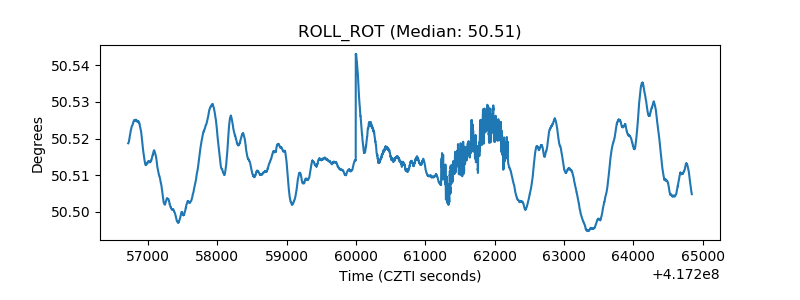 |
| _Roll_DEC | 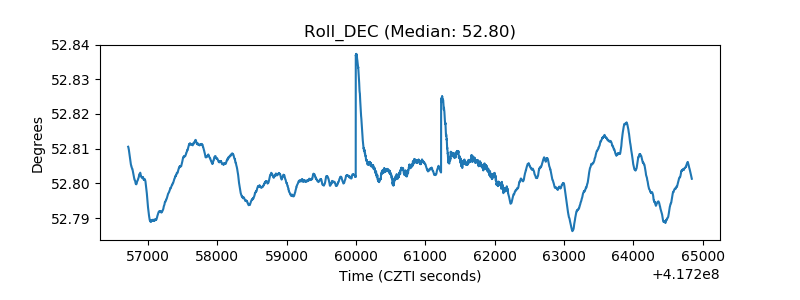 |
| _Roll_RA | 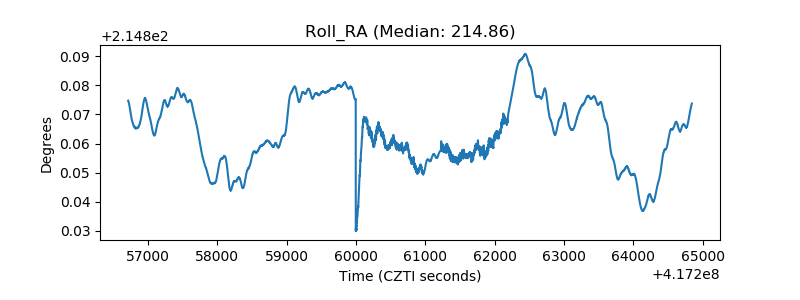 |
| Veto Counter | 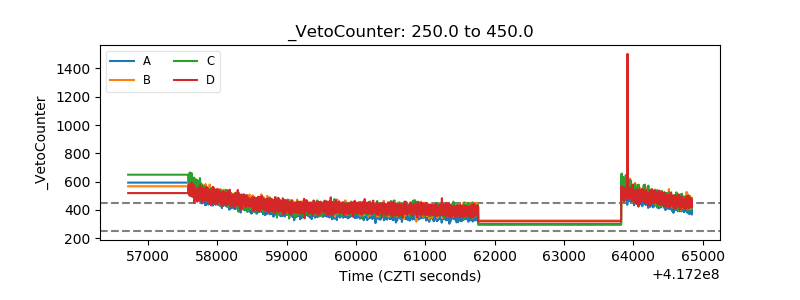 |