| Param | Original file | Final file |
|---|---|---|
| Filename | modeM0/AS1A12_022T01_9000005540_40461cztM0_level2.fits | modeM0/AS1A12_022T01_9000005540_40461cztM0_level2_quad_clean.evt |
| Size (bytes) | 324,034,560 | 94,950,720 |
| Size | 309.0 MB | 90.6 MB |
| Events in quadrant A | 2,895,633 | 662,278 |
| Events in quadrant B | 2,787,330 | 675,484 |
| Events in quadrant C | 2,691,300 | 627,696 |
| Events in quadrant D | 3,215,060 | 545,673 |
| Mode M0 | |||
|---|---|---|---|
| Quadrant | BADHDUFLAG | Total packets | Discarded packets |
| A | 0 | 11676 | 3 |
| B | 0 | 11537 | 2 |
| C | 0 | 10949 | 2 |
| D | 0 | 12892 | 2 |
| Mode M9 | |||
|---|---|---|---|
| Quadrant | BADHDUFLAG | Total packets | Discarded packets |
| A | 0 | 28 | 0 |
| B | 0 | 28 | 0 |
| C | 0 | 28 | 0 |
| D | 0 | 29 | 0 |
| Mode SS | |||
|---|---|---|---|
| Quadrant | BADHDUFLAG | Total packets | Discarded packets |
| A | 0 | 106 | 0 |
| B | 0 | 106 | 0 |
| C | 0 | 106 | 0 |
| D | 0 | 106 | 0 |
| Quadrant | Total seconds | Saturated seconds | Saturation percentage |
|---|---|---|---|
| A | 5200 | 16 | 0.307692% |
| B | 5200 | 30 | 0.576923% |
| C | 5200 | 35 | 0.673077% |
| D | 5200 | 378 | 7.269231% |
Noise dominated data is calculated using 1-second bins in cleaned event files. If a bin has >2000 counts, and if more than 50% of those come from <1% of pixels, then it is considered to be noise-dominated and hence unusable.
| Quadrant | # 1 sec bins | Bins with >0 counts | Bins with >2000 counts | High rate bins dominated by noise | Noise dominated (total time) | Noise dominated (detector-on time) | Marked lightcurve |
|---|---|---|---|---|---|---|---|
| A | 7323 | 5201 | 4 | 4 | 0.05% | 0.08% | 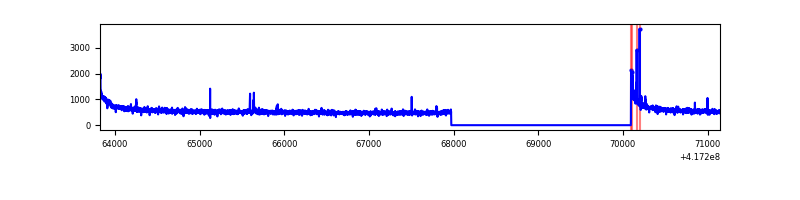 |
| B | 7323 | 5201 | 16 | 16 | 0.22% | 0.31% | 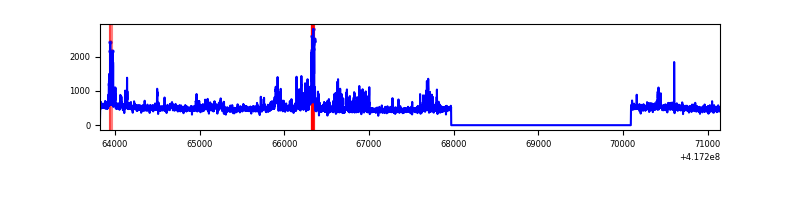 |
| C | 7323 | 5201 | 26 | 26 | 0.36% | 0.50% | 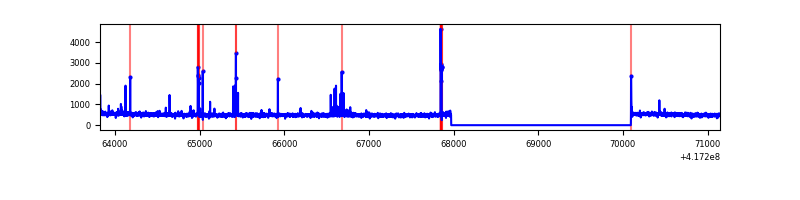 |
| D | 7323 | 5201 | 78 | 78 | 1.07% | 1.50% | 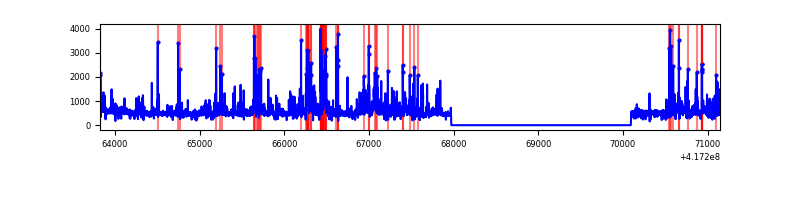 |
Top three noisy pixels from each quadrant. If the there are fewer than three noisy pixels in the level2.evt file, extra rows are filled as -1
| Pixel properties | Quadrant properties | ||||||
|---|---|---|---|---|---|---|---|
| Quadrant | DetID | PixID | Counts | Sigma | Mean | Median | Sigma |
| A | 10 | 83 | 469258 | 3754.49 | 615 | 605 | 124.8 |
| A | 7 | 3 | 28053 | 219.89 | 615 | 605 | 124.8 |
| A | 2 | 79 | 10986 | 83.16 | 615 | 605 | 124.8 |
| B | 4 | 170 | 289191 | 2498.5 | 607 | 590 | 115.5 |
| B | 0 | 230 | 51449 | 440.3 | 607 | 590 | 115.5 |
| B | 0 | 229 | 30965 | 262.96 | 607 | 590 | 115.5 |
| C | 15 | 214 | 226144 | 1654.84 | 593 | 597 | 136.3 |
| C | 14 | 254 | 140279 | 1024.85 | 593 | 597 | 136.3 |
| C | 0 | 10 | 8900 | 60.92 | 593 | 597 | 136.3 |
| D | 12 | 227 | 331932 | 2371.49 | 573 | 558 | 139.7 |
| D | 2 | 250 | 223272 | 1593.86 | 573 | 558 | 139.7 |
| D | 12 | 128 | 183994 | 1312.77 | 573 | 558 | 139.7 |
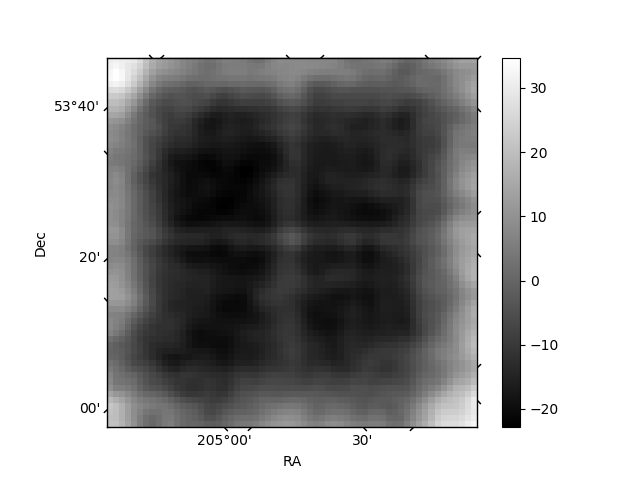
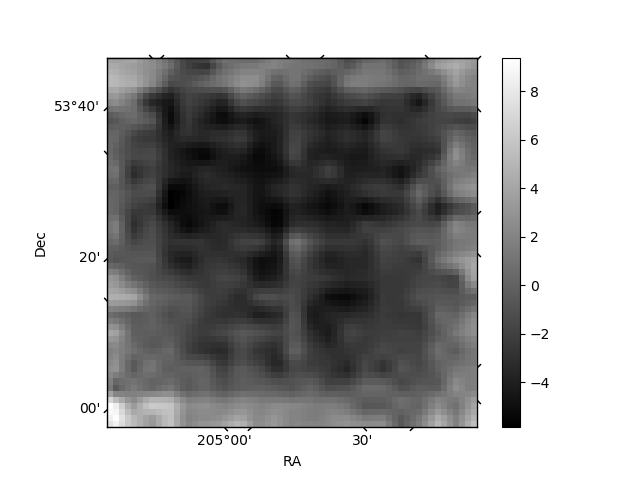
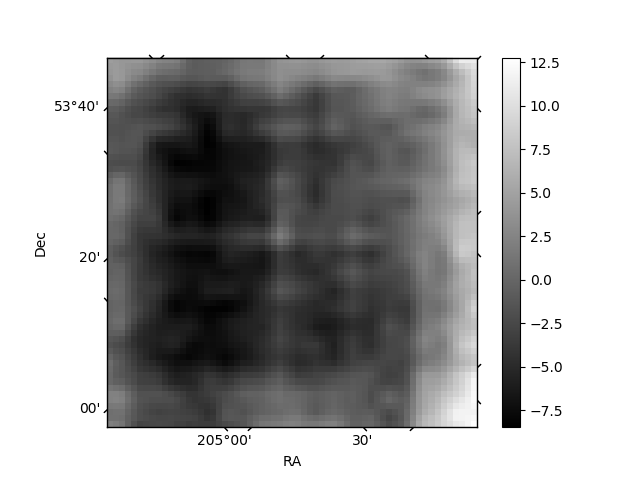
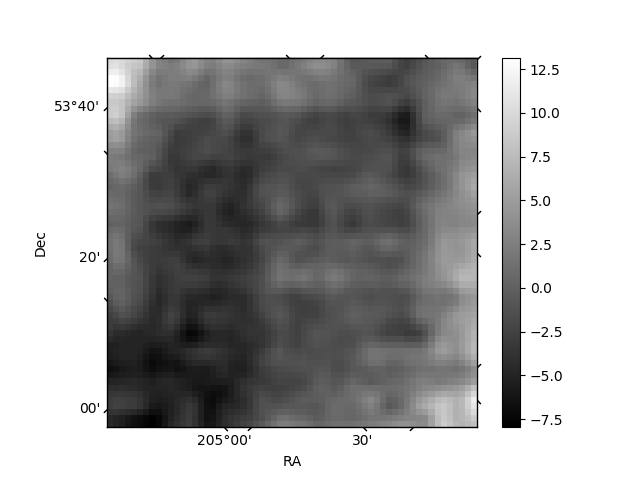
Histogram calculated using DETX and DETY for each event in the final _common_clean file
| Quadrant A | 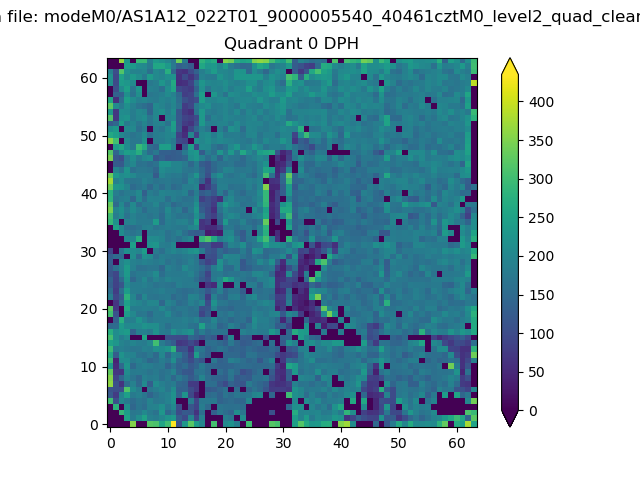 |
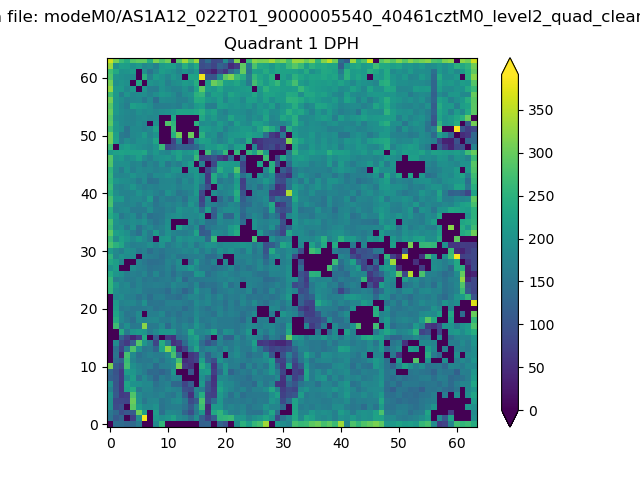 |
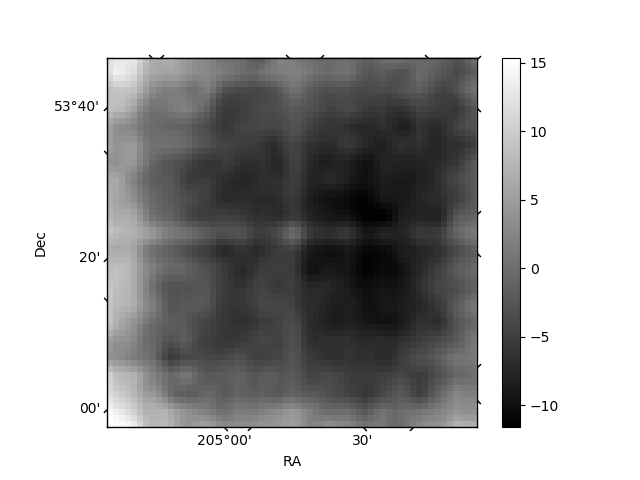
Quadrant B |
|---|---|---|---|
| Quadrant D | 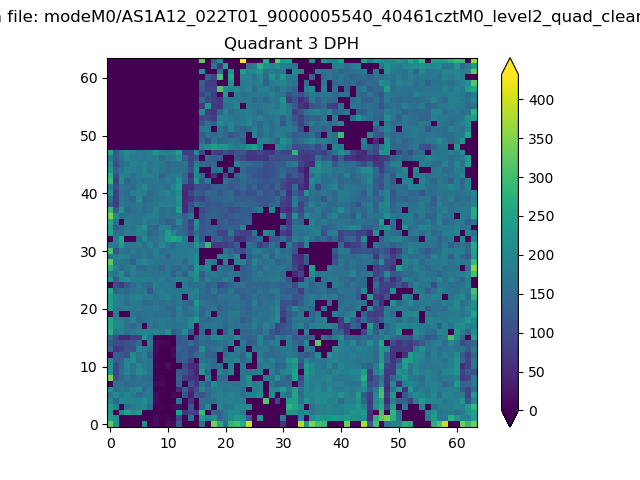 |
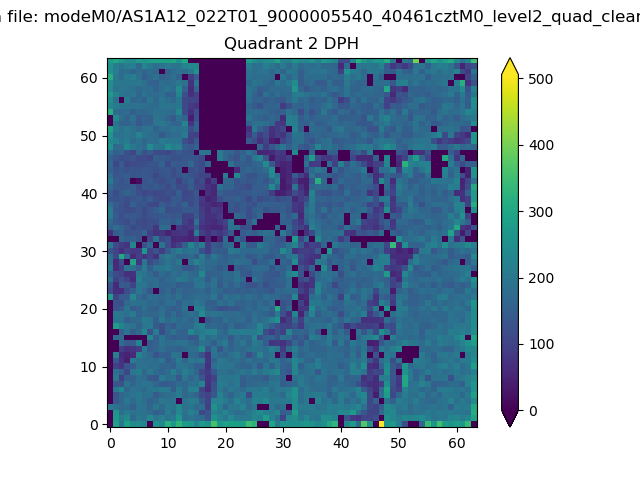 |
Quadrant C |
| Plot type | Count rate plots | Images |
|---|---|---|
| Comparison with Poisson distribution Blue bars denote a histogram of data divided into 1 sec bins. Red curve is a Poisson curve with rate = median count rate of data. |
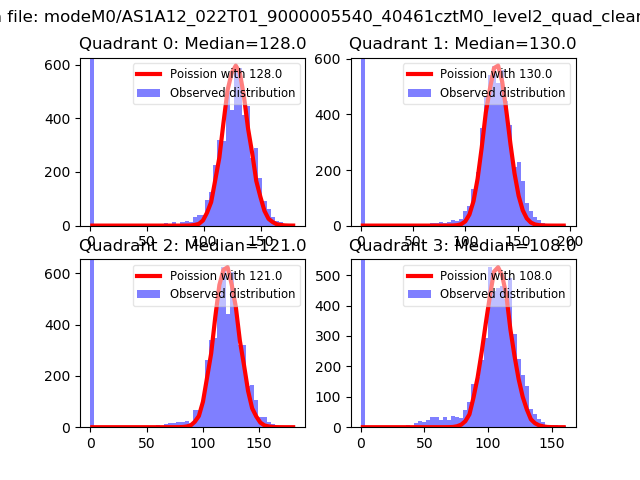 |
 |
| Quadrant-wise count rates Data is divided into 100 sec bins |
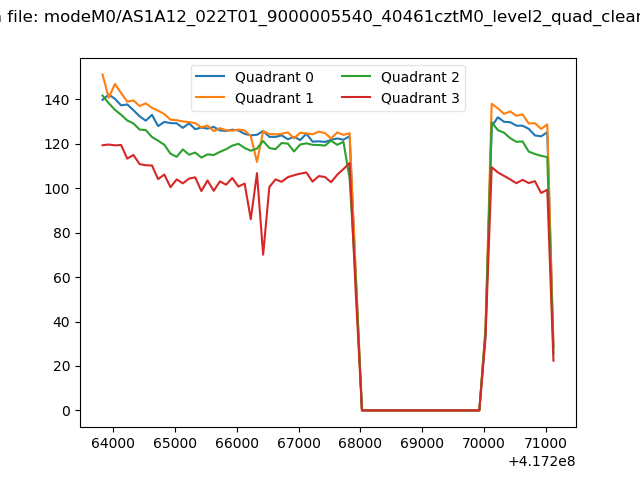 |
|
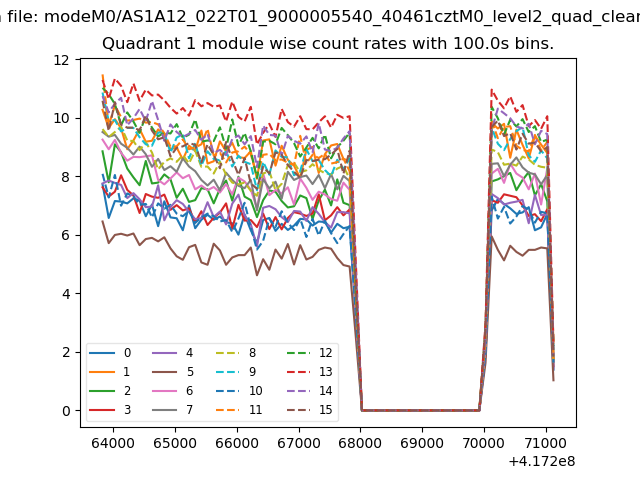
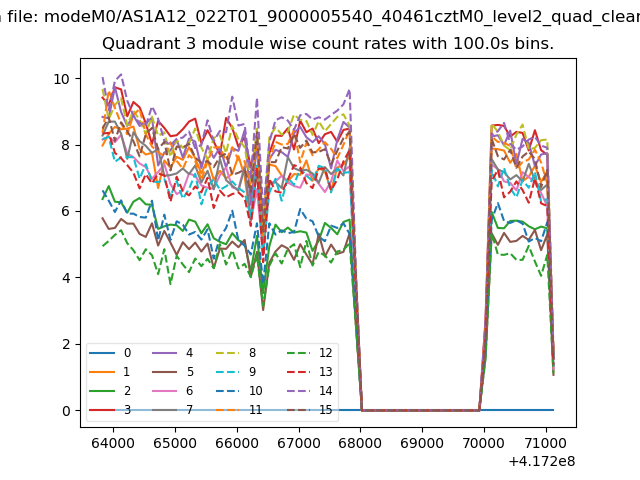
| Module-wise count rates for Quadrant A Data is divided into 100 sec bins |
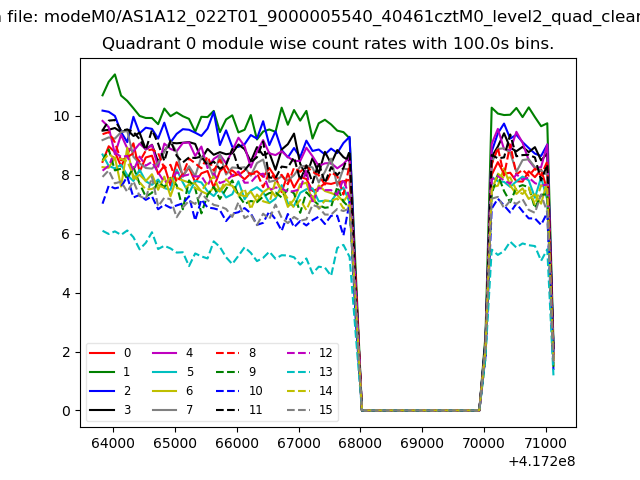 |
 |
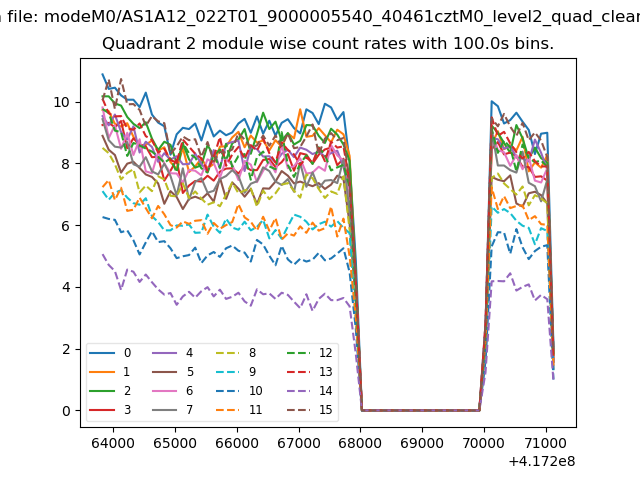
| Module-wise count rates for Quadrant B Data is divided into 100 sec bins |
 |
 |
| Module-wise count rates for Quadrant C Data is divided into 100 sec bins |
 |
 |
| Module-wise count rates for Quadrant D Data is divided into 100 sec bins |
 |
 |
| Parameter | Plot |
|---|---|
| CZT HV Monitor | 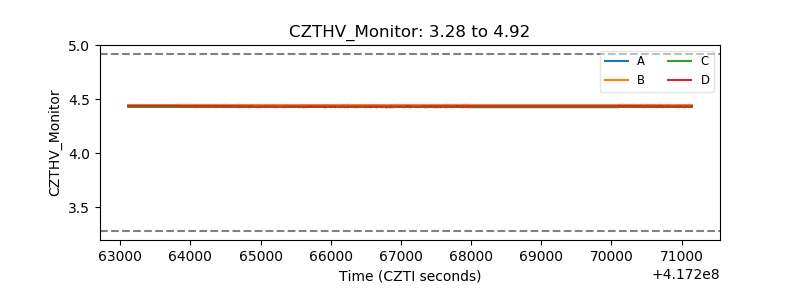 |
| D_VDD | 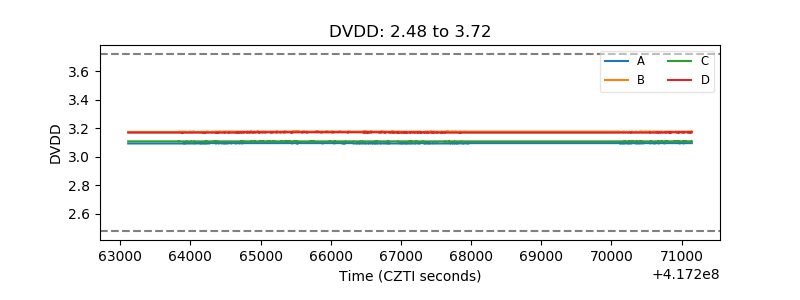 |
| Temperature 1 | 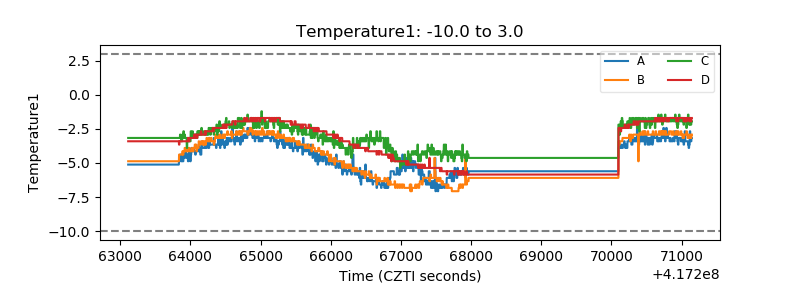 |
| Veto HV Monitor | 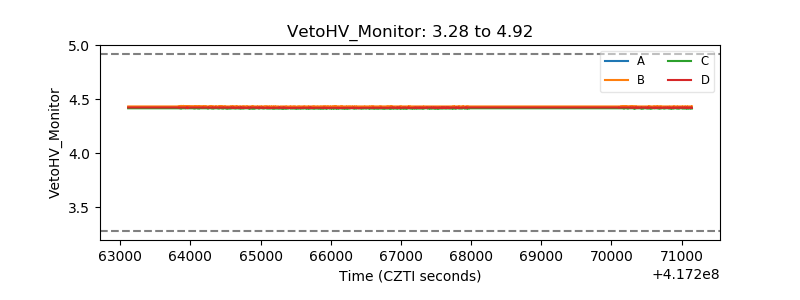 |
| Veto LLD | 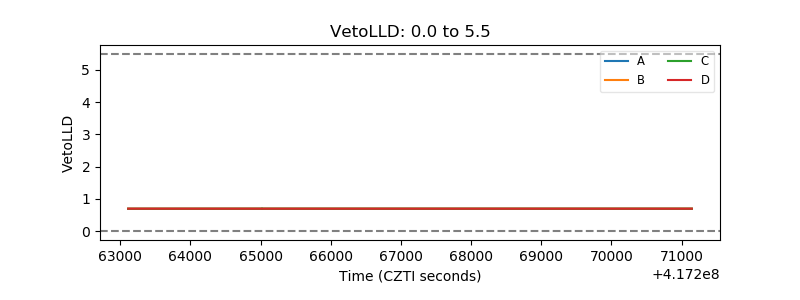 |
| Alpha Counter | 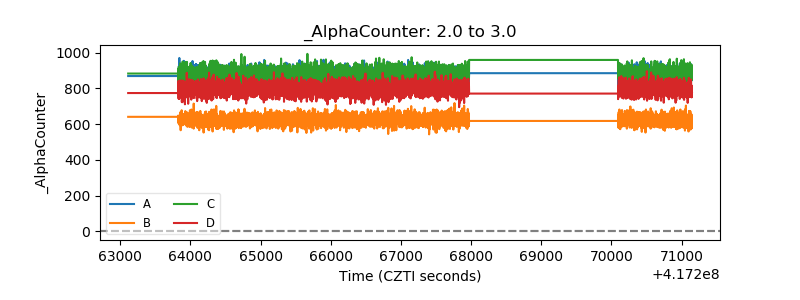 |
| _CPM_Rate | 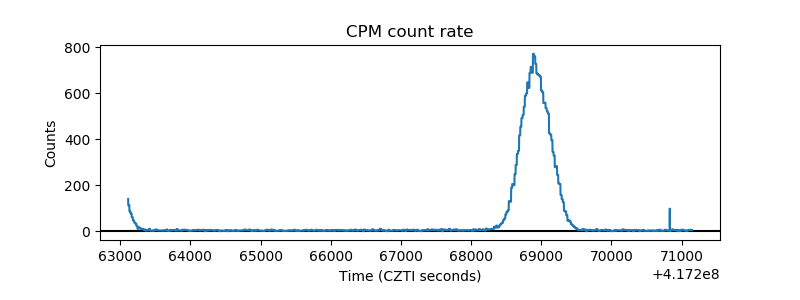 |
| CZT Counter | 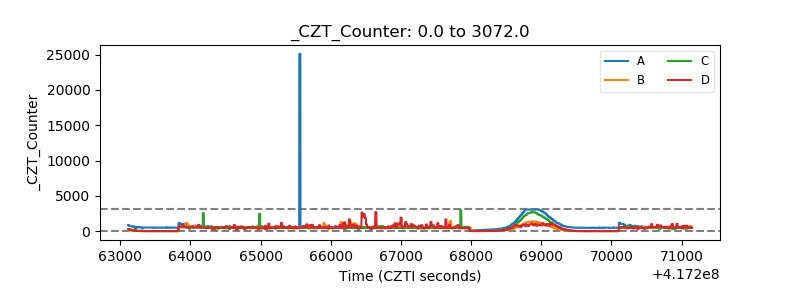 |
| +2.5 Volts monitor | 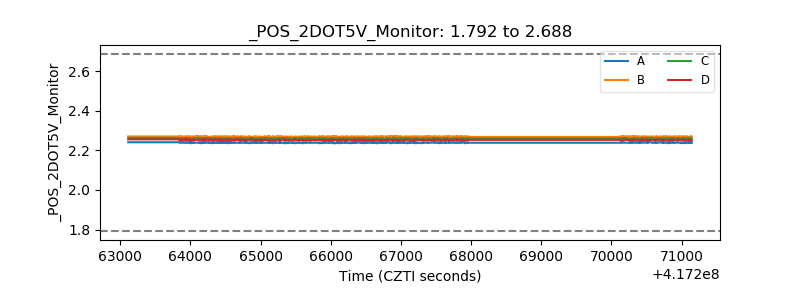 |
| +5 Volts monitor | 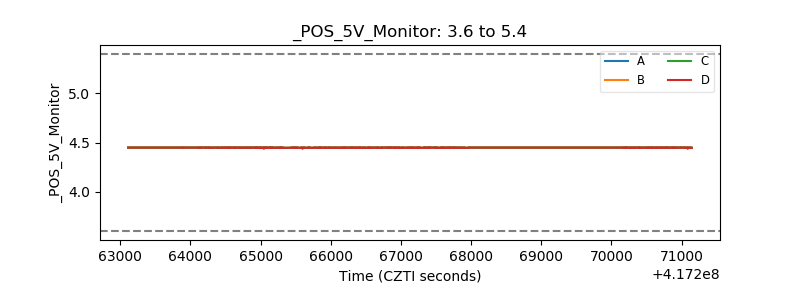 |
| _ROLL_ROT | 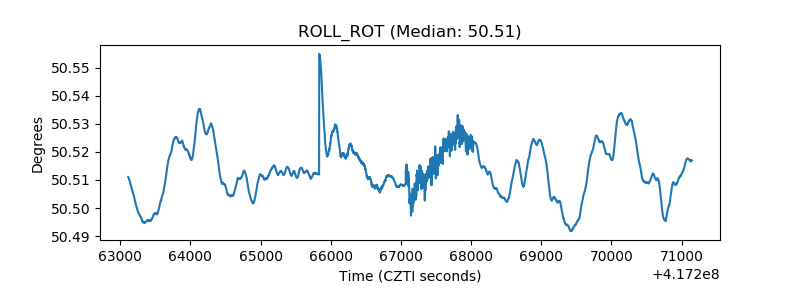 |
| _Roll_DEC | 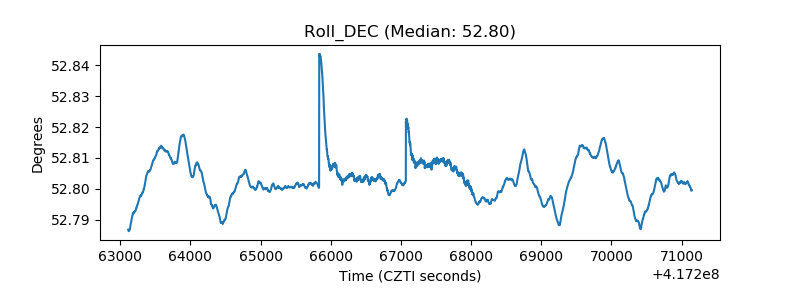 |
| _Roll_RA | 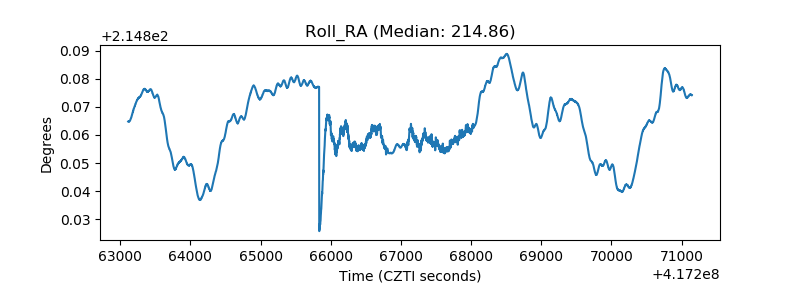 |
| Veto Counter | 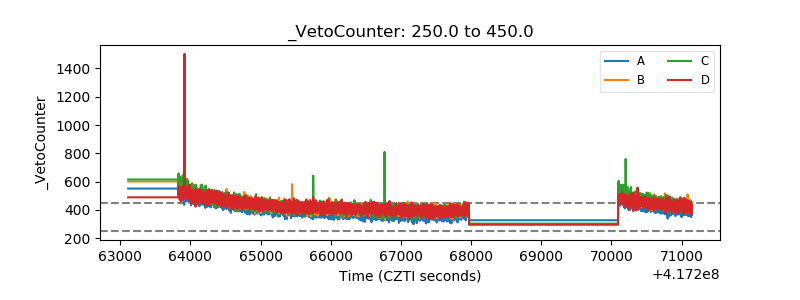 |