| Param | Original file | Final file |
|---|---|---|
| Filename | modeM0/AS1A12_022T01_9000005540_40462cztM0_level2.fits | modeM0/AS1A12_022T01_9000005540_40462cztM0_level2_quad_clean.evt |
| Size (bytes) | 314,438,400 | 88,433,280 |
| Size | 299.9 MB | 84.3 MB |
| Events in quadrant A | 2,762,401 | 616,862 |
| Events in quadrant B | 2,481,021 | 632,384 |
| Events in quadrant C | 2,818,569 | 588,624 |
| Events in quadrant D | 3,178,621 | 481,485 |
| Mode M0 | |||
|---|---|---|---|
| Quadrant | BADHDUFLAG | Total packets | Discarded packets |
| A | 0 | 11352 | 3 |
| B | 0 | 10654 | 2 |
| C | 0 | 11436 | 2 |
| D | 0 | 12927 | 2 |
| Mode M9 | |||
|---|---|---|---|
| Quadrant | BADHDUFLAG | Total packets | Discarded packets |
| A | 0 | 35 | 0 |
| B | 0 | 35 | 0 |
| C | 0 | 35 | 0 |
| D | 0 | 36 | 0 |
| Mode SS | |||
|---|---|---|---|
| Quadrant | BADHDUFLAG | Total packets | Discarded packets |
| A | 0 | 106 | 0 |
| B | 0 | 106 | 0 |
| C | 0 | 106 | 0 |
| D | 0 | 106 | 0 |
| Quadrant | Total seconds | Saturated seconds | Saturation percentage |
|---|---|---|---|
| A | 5109 | 14 | 0.274026% |
| B | 5109 | 21 | 0.411039% |
| C | 5109 | 48 | 0.939518% |
| D | 5109 | 746 | 14.601683% |
Noise dominated data is calculated using 1-second bins in cleaned event files. If a bin has >2000 counts, and if more than 50% of those come from <1% of pixels, then it is considered to be noise-dominated and hence unusable.
| Quadrant | # 1 sec bins | Bins with >0 counts | Bins with >2000 counts | High rate bins dominated by noise | Noise dominated (total time) | Noise dominated (detector-on time) | Marked lightcurve |
|---|---|---|---|---|---|---|---|
| A | 7232 | 5110 | 4 | 4 | 0.06% | 0.08% | 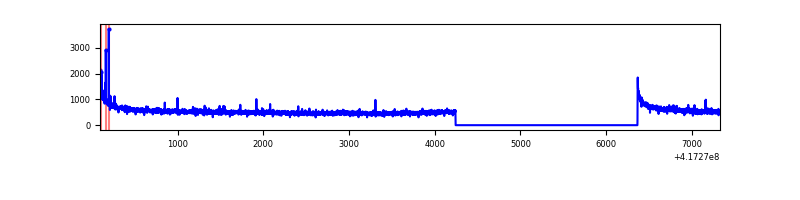 |
| B | 7232 | 5110 | 10 | 10 | 0.14% | 0.20% | 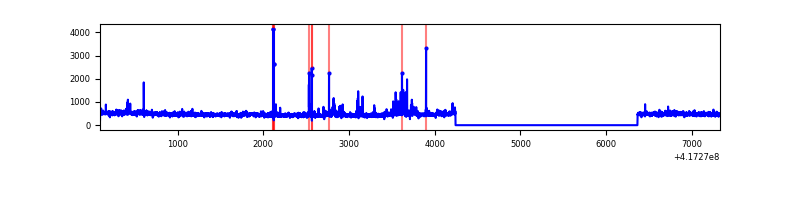 |
| C | 7232 | 5110 | 45 | 45 | 0.62% | 0.88% | 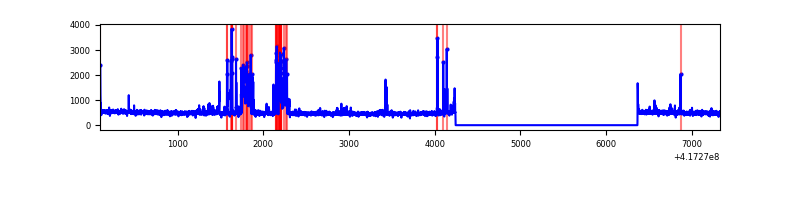 |
| D | 7231 | 5109 | 171 | 171 | 2.36% | 3.35% | 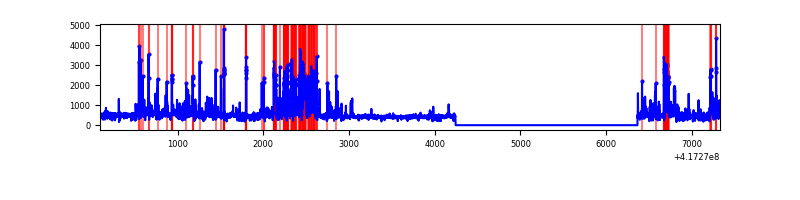 |
Top three noisy pixels from each quadrant. If the there are fewer than three noisy pixels in the level2.evt file, extra rows are filled as -1
| Pixel properties | Quadrant properties | ||||||
|---|---|---|---|---|---|---|---|
| Quadrant | DetID | PixID | Counts | Sigma | Mean | Median | Sigma |
| A | 10 | 83 | 466196 | 3964.54 | 582 | 572 | 117.4 |
| A | 7 | 3 | 24736 | 205.74 | 582 | 572 | 117.4 |
| A | 2 | 79 | 8673 | 68.98 | 582 | 572 | 117.4 |
| B | 4 | 170 | 96139 | 868.01 | 576 | 560 | 110.1 |
| B | 0 | 230 | 55359 | 497.66 | 576 | 560 | 110.1 |
| B | 5 | 255 | 45925 | 411.99 | 576 | 560 | 110.1 |
| C | 14 | 254 | 365683 | 2804.33 | 566 | 568 | 130.2 |
| C | 15 | 214 | 223425 | 1711.69 | 566 | 568 | 130.2 |
| C | 9 | 54 | 12847 | 94.31 | 566 | 568 | 130.2 |
| D | 12 | 227 | 388457 | 3017.58 | 525 | 510 | 128.6 |
| D | 2 | 250 | 234044 | 1816.5 | 525 | 510 | 128.6 |
| D | 12 | 128 | 170293 | 1320.62 | 525 | 510 | 128.6 |
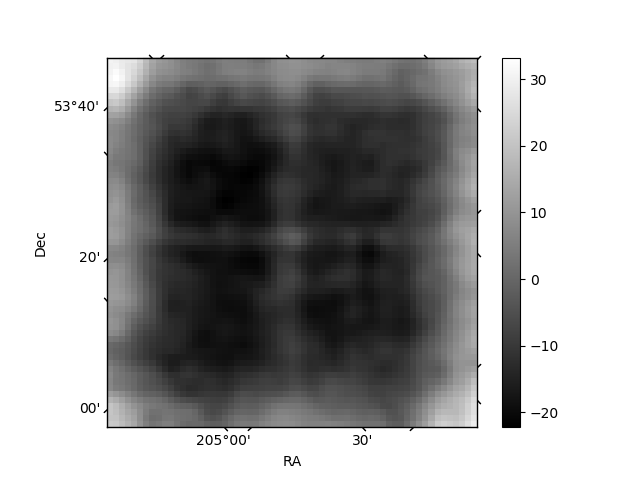
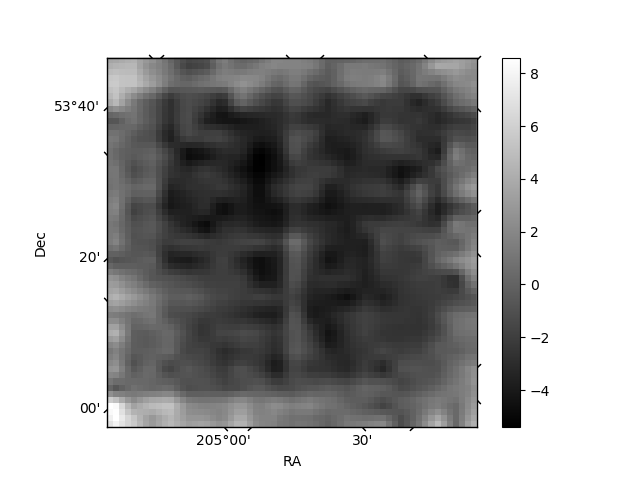
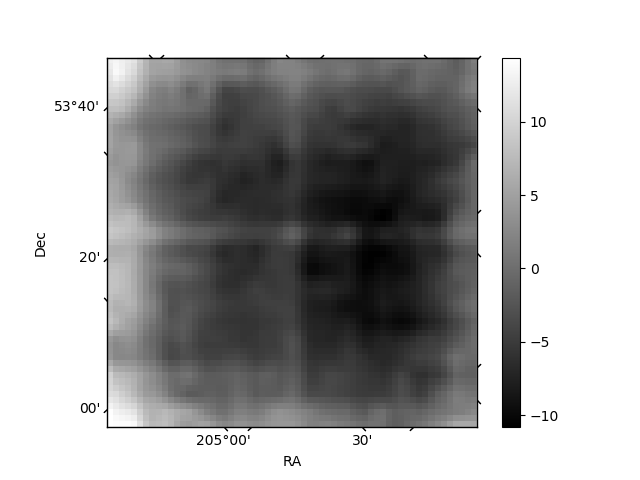
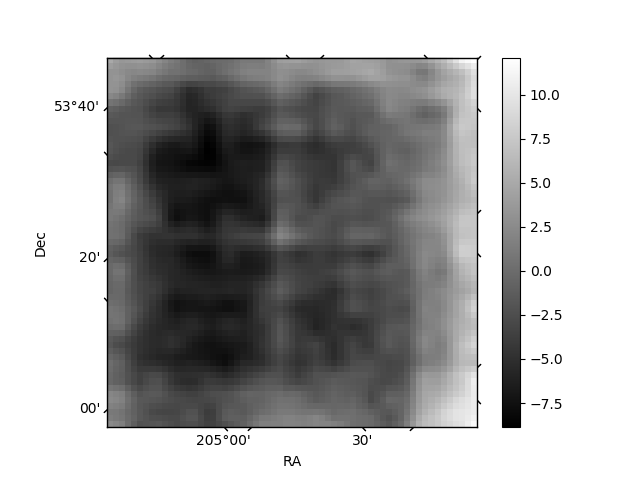
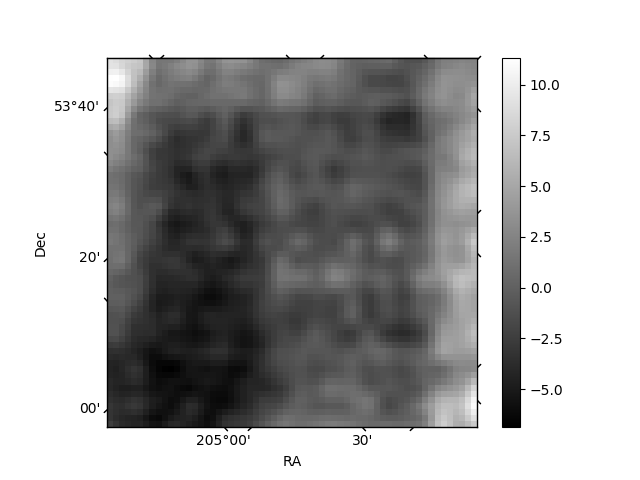
Histogram calculated using DETX and DETY for each event in the final _common_clean file
| Quadrant A | 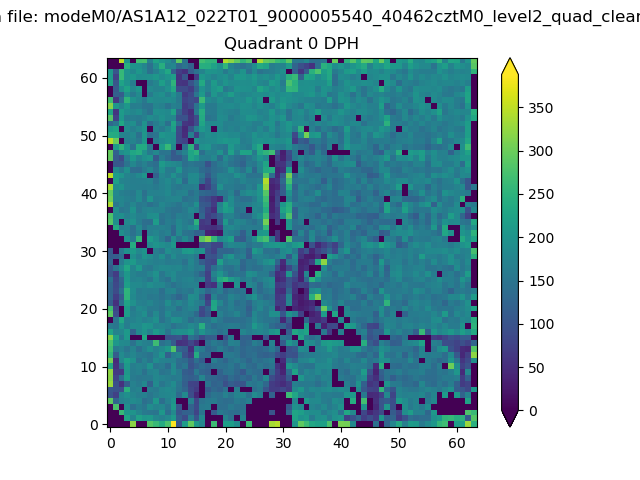 |
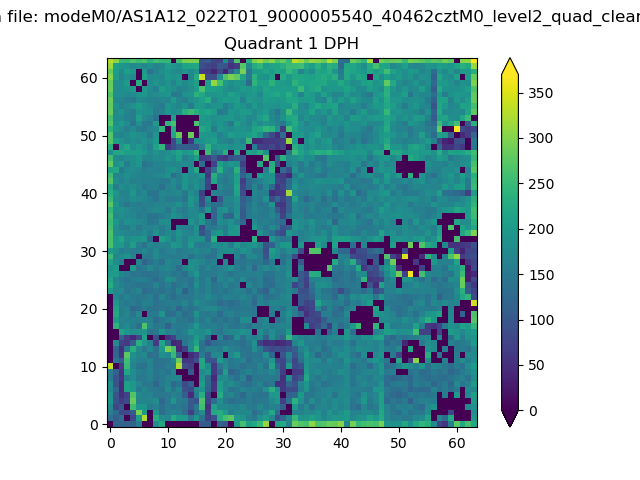 |
Quadrant B |
|---|---|---|---|
| Quadrant D | 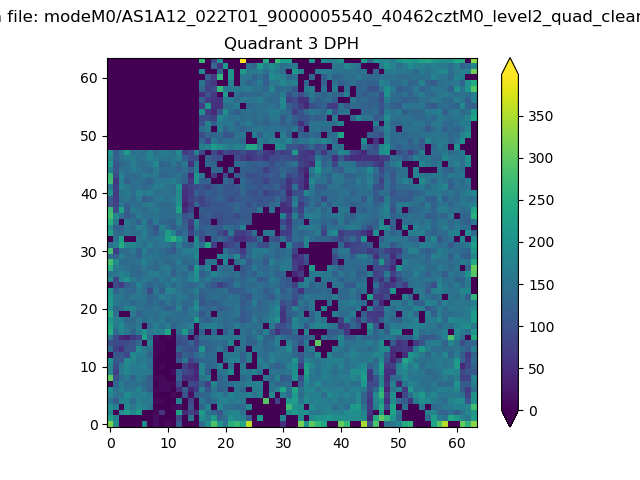 |
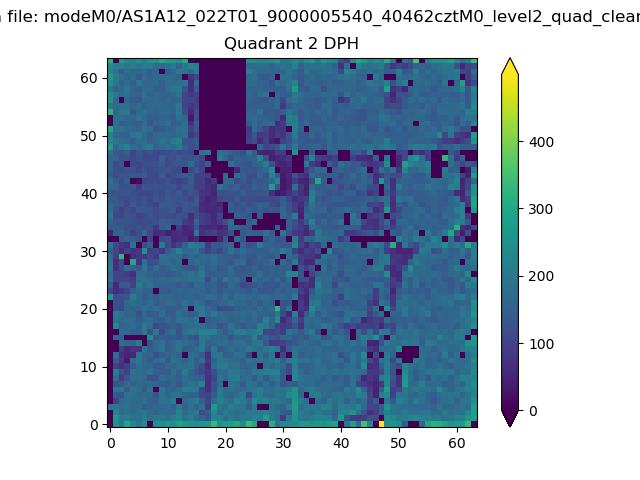 |
Quadrant C |
| Plot type | Count rate plots | Images |
|---|---|---|
| Comparison with Poisson distribution Blue bars denote a histogram of data divided into 1 sec bins. Red curve is a Poisson curve with rate = median count rate of data. |
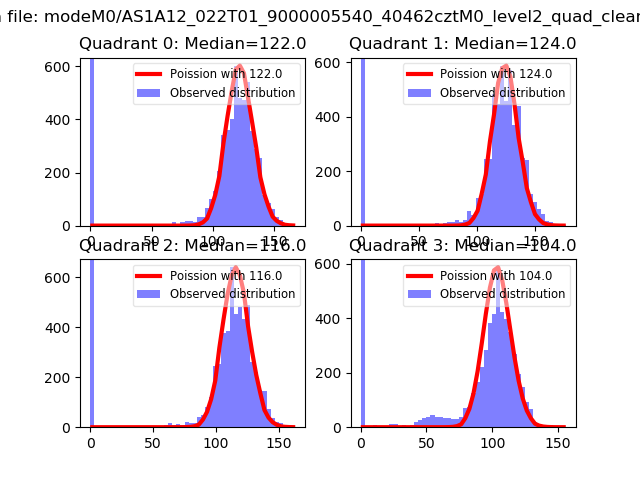 |
 |
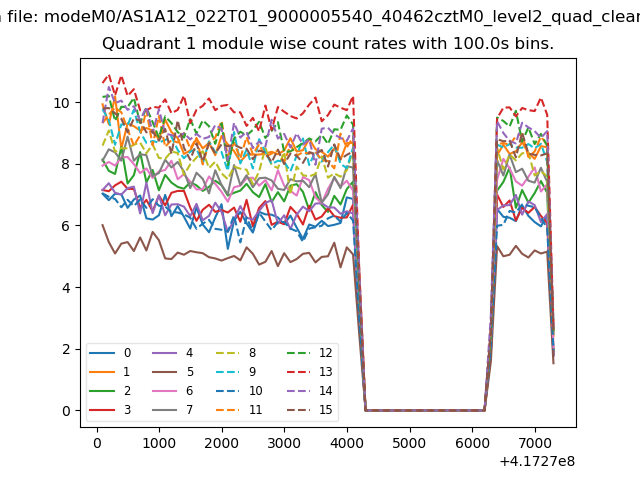
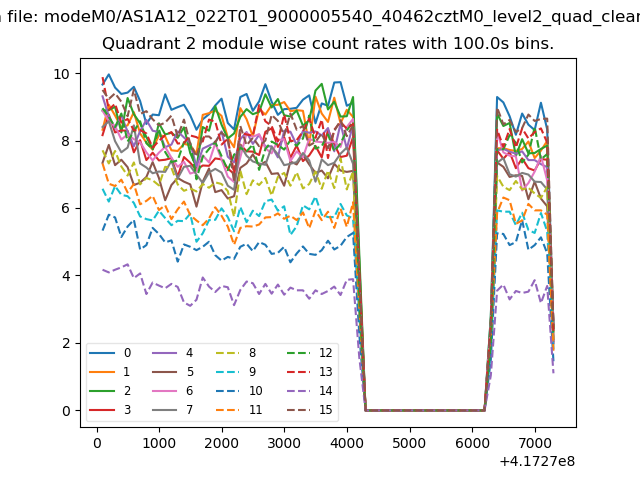
| Quadrant-wise count rates Data is divided into 100 sec bins |
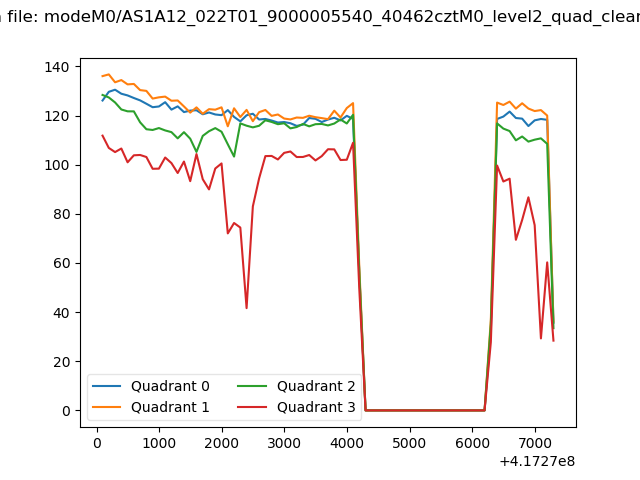 |
|
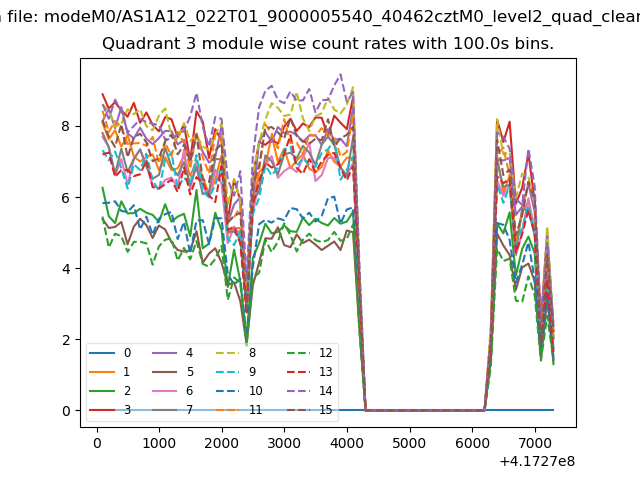
| Module-wise count rates for Quadrant A Data is divided into 100 sec bins |
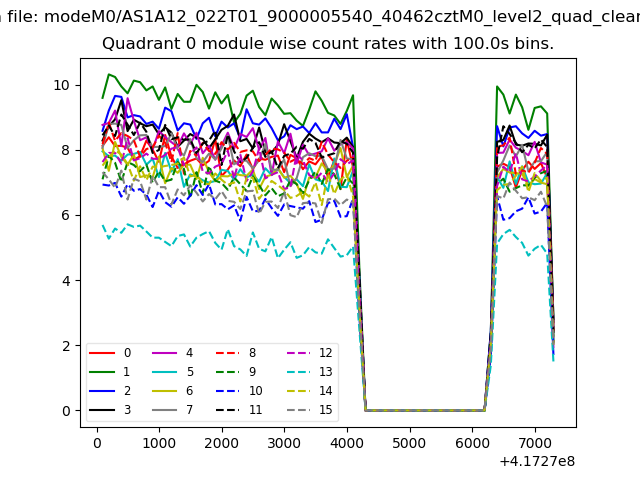 |
 |
| Module-wise count rates for Quadrant B Data is divided into 100 sec bins |
 |
 |
| Module-wise count rates for Quadrant C Data is divided into 100 sec bins |
 |
 |
| Module-wise count rates for Quadrant D Data is divided into 100 sec bins |
 |
 |
| Parameter | Plot |
|---|---|
| CZT HV Monitor | 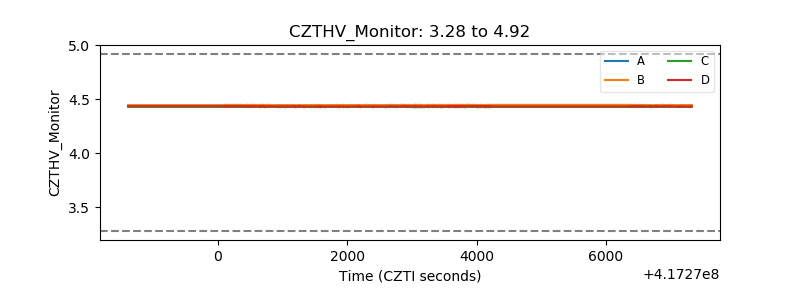 |
| D_VDD | 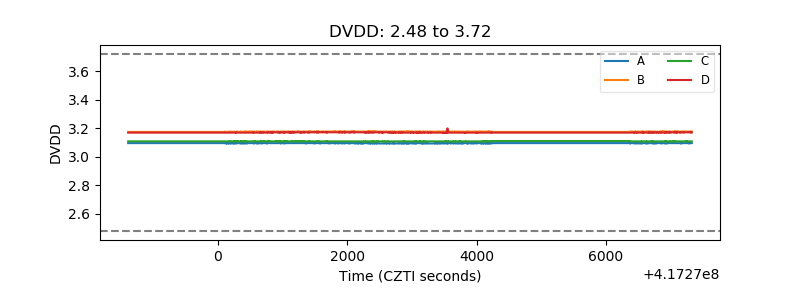 |
| Temperature 1 | 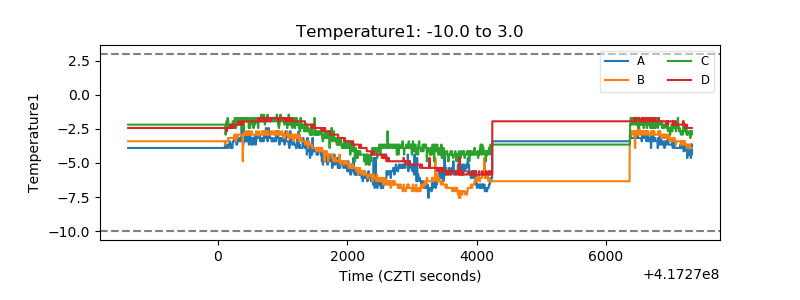 |
| Veto HV Monitor | 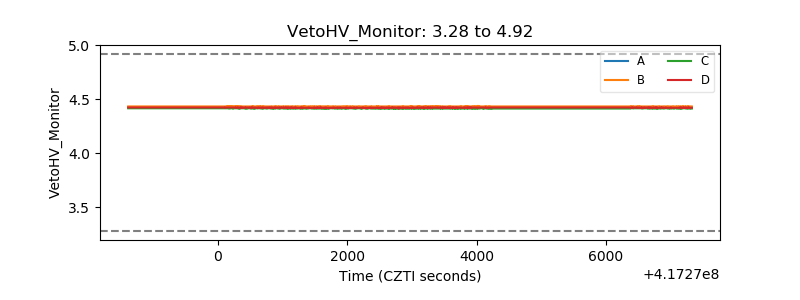 |
| Veto LLD | 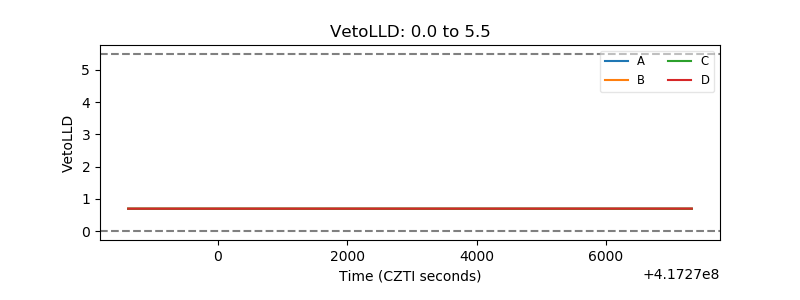 |
| Alpha Counter | 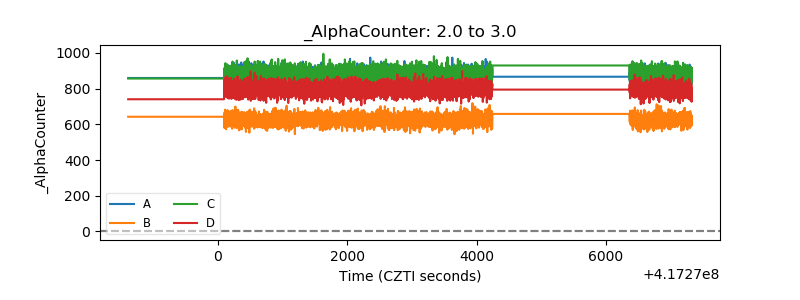 |
| _CPM_Rate | 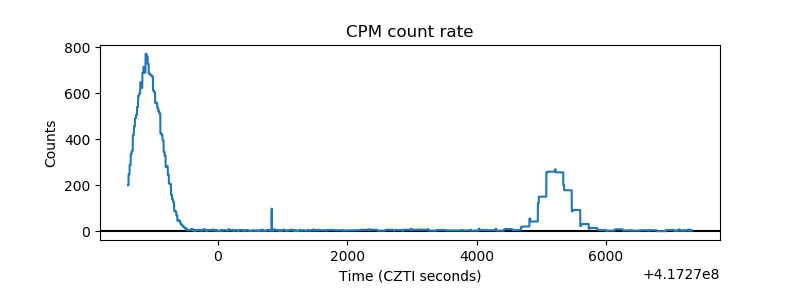 |
| CZT Counter | 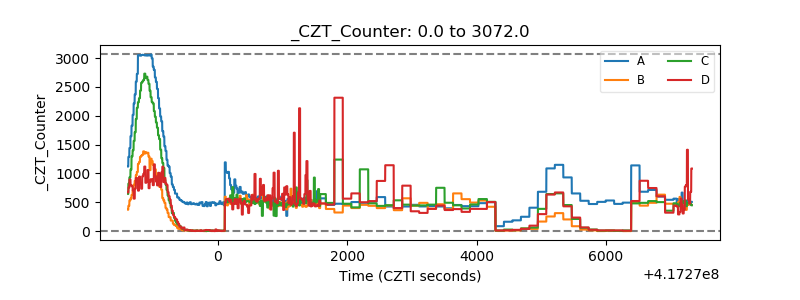 |
| +2.5 Volts monitor | 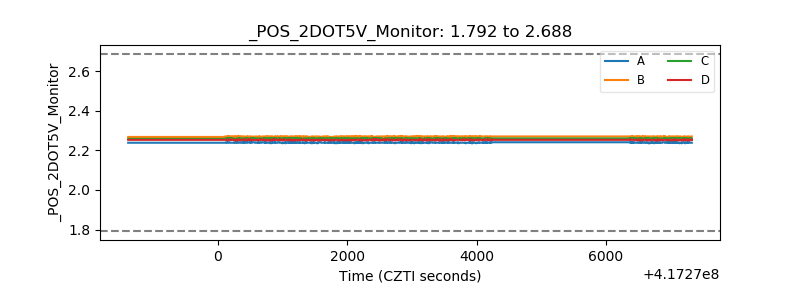 |
| +5 Volts monitor | 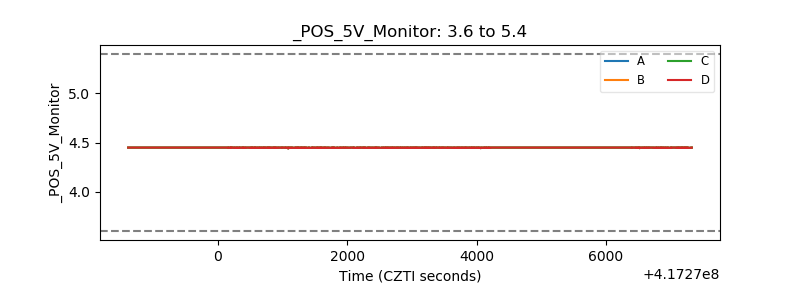 |
| _ROLL_ROT | 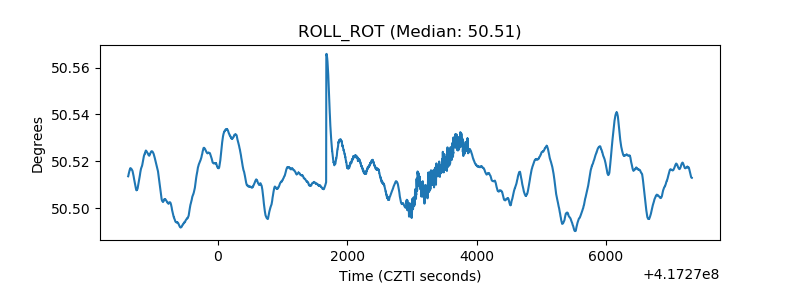 |
| _Roll_DEC | 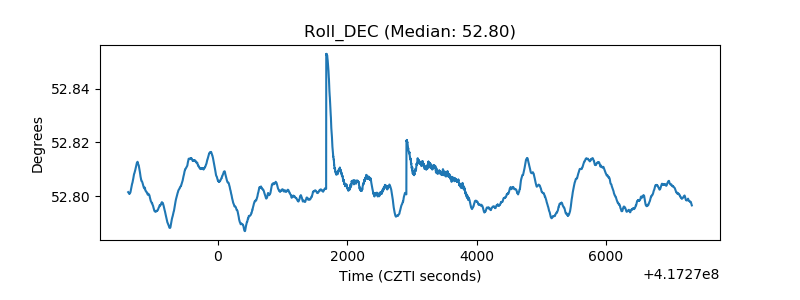 |
| _Roll_RA | 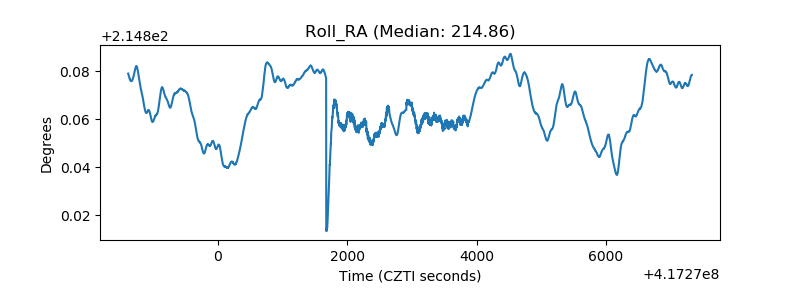 |
| Veto Counter | 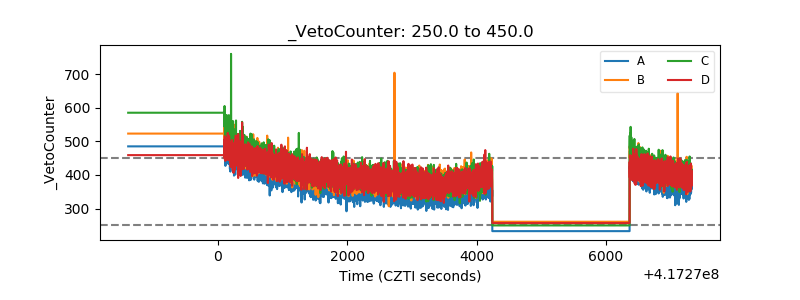 |