| Param | Original file | Final file |
|---|---|---|
| Filename | modeM0/AS1A12_022T01_9000005540_40463cztM0_level2.fits | modeM0/AS1A12_022T01_9000005540_40463cztM0_level2_quad_clean.evt |
| Size (bytes) | 286,819,200 | 83,764,800 |
| Size | 273.5 MB | 79.9 MB |
| Events in quadrant A | 2,660,343 | 585,280 |
| Events in quadrant B | 2,350,804 | 597,689 |
| Events in quadrant C | 2,426,738 | 562,482 |
| Events in quadrant D | 2,779,253 | 432,634 |
| Mode M0 | |||
|---|---|---|---|
| Quadrant | BADHDUFLAG | Total packets | Discarded packets |
| A | 0 | 11175 | 3 |
| B | 0 | 10375 | 2 |
| C | 0 | 10462 | 2 |
| D | 0 | 11941 | 2 |
| Mode M9 | |||
|---|---|---|---|
| Quadrant | BADHDUFLAG | Total packets | Discarded packets |
| A | 0 | 32 | 0 |
| B | 0 | 32 | 0 |
| C | 0 | 32 | 0 |
| D | 0 | 33 | 0 |
| Mode SS | |||
|---|---|---|---|
| Quadrant | BADHDUFLAG | Total packets | Discarded packets |
| A | 0 | 104 | 0 |
| B | 0 | 104 | 0 |
| C | 0 | 104 | 0 |
| D | 0 | 104 | 0 |
| Quadrant | Total seconds | Saturated seconds | Saturation percentage |
|---|---|---|---|
| A | 5113 | 14 | 0.273812% |
| B | 5113 | 8 | 0.156464% |
| C | 5113 | 7 | 0.136906% |
| D | 5113 | 1037 | 20.281635% |
Noise dominated data is calculated using 1-second bins in cleaned event files. If a bin has >2000 counts, and if more than 50% of those come from <1% of pixels, then it is considered to be noise-dominated and hence unusable.
| Quadrant | # 1 sec bins | Bins with >0 counts | Bins with >2000 counts | High rate bins dominated by noise | Noise dominated (total time) | Noise dominated (detector-on time) | Marked lightcurve |
|---|---|---|---|---|---|---|---|
| A | 7086 | 5114 | 5 | 5 | 0.07% | 0.10% | 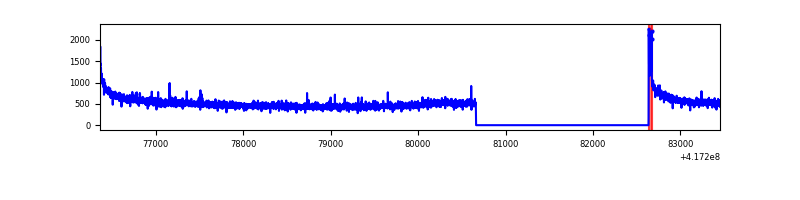 |
| B | 7086 | 5114 | 4 | 4 | 0.06% | 0.08% | 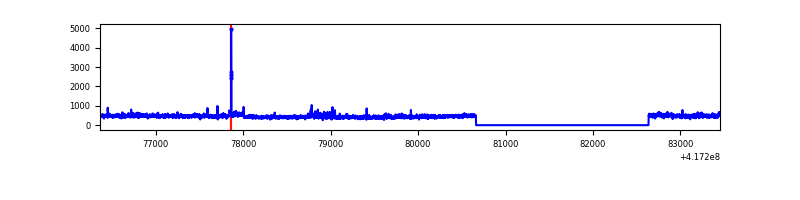 |
| C | 7086 | 5114 | 3 | 3 | 0.04% | 0.06% | 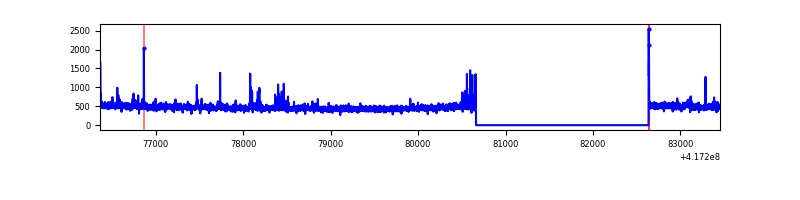 |
| D | 7086 | 5114 | 71 | 71 | 1.00% | 1.39% | 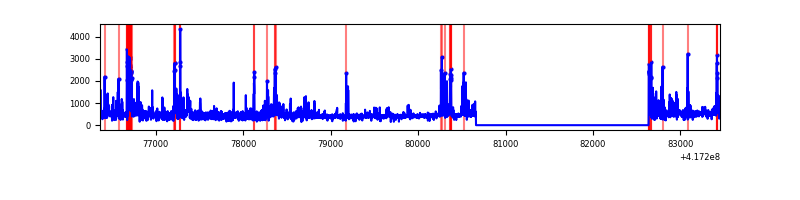 |
Top three noisy pixels from each quadrant. If the there are fewer than three noisy pixels in the level2.evt file, extra rows are filled as -1
| Pixel properties | Quadrant properties | ||||||
|---|---|---|---|---|---|---|---|
| Quadrant | DetID | PixID | Counts | Sigma | Mean | Median | Sigma |
| A | 10 | 83 | 470402 | 4125.74 | 557 | 546 | 113.9 |
| A | 7 | 3 | 13197 | 111.09 | 557 | 546 | 113.9 |
| A | 15 | 191 | 12185 | 102.2 | 557 | 546 | 113.9 |
| B | 0 | 230 | 77028 | 713.34 | 554 | 538 | 107.2 |
| B | 3 | 112 | 44950 | 414.19 | 554 | 538 | 107.2 |
| B | 4 | 170 | 26071 | 238.12 | 554 | 538 | 107.2 |
| C | 15 | 214 | 221148 | 1740.35 | 545 | 547 | 126.8 |
| C | 14 | 254 | 63593 | 497.38 | 545 | 547 | 126.8 |
| C | 0 | 10 | 11126 | 83.46 | 545 | 547 | 126.8 |
| D | 12 | 191 | 219107 | 1830.55 | 485 | 473 | 119.4 |
| D | 2 | 250 | 213641 | 1784.79 | 485 | 473 | 119.4 |
| D | 12 | 227 | 158307 | 1321.49 | 485 | 473 | 119.4 |
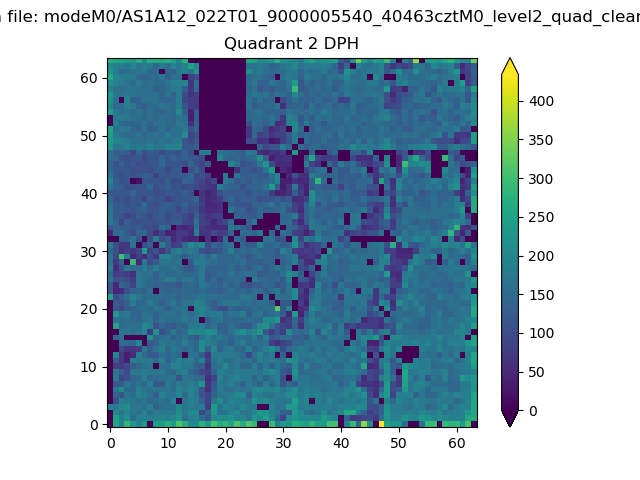
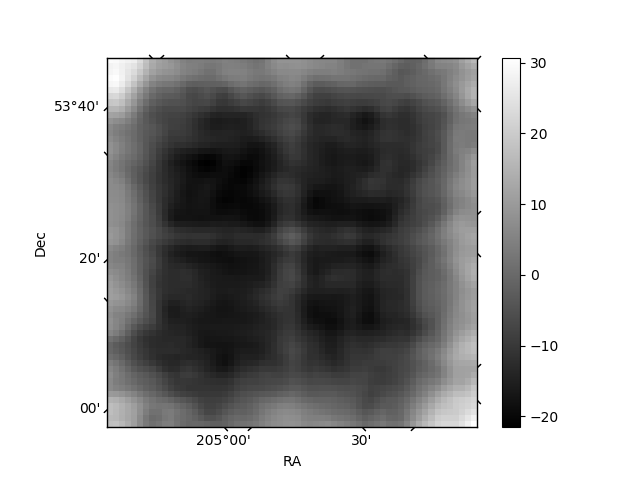
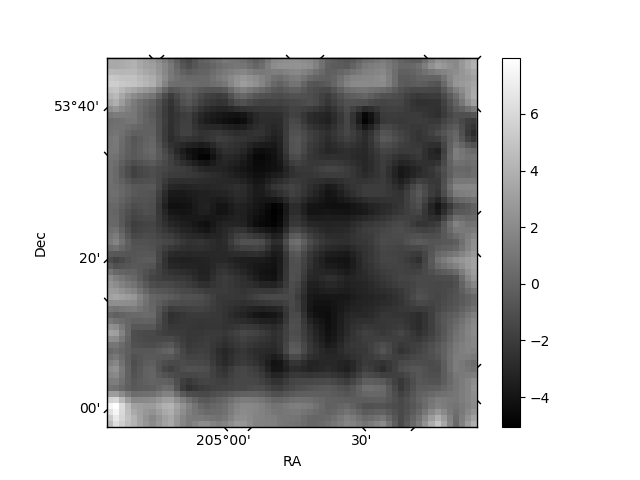
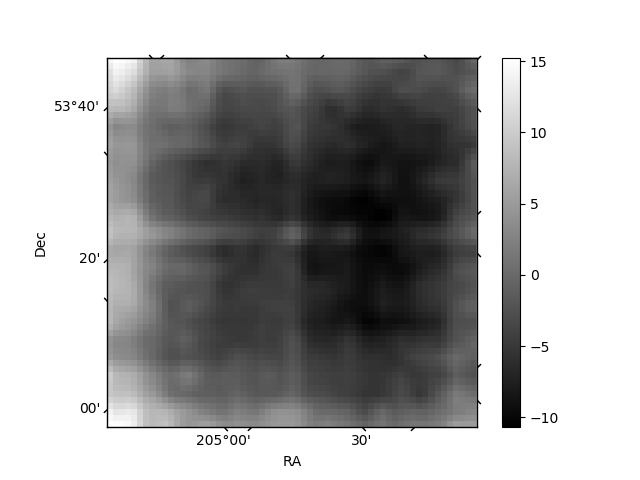
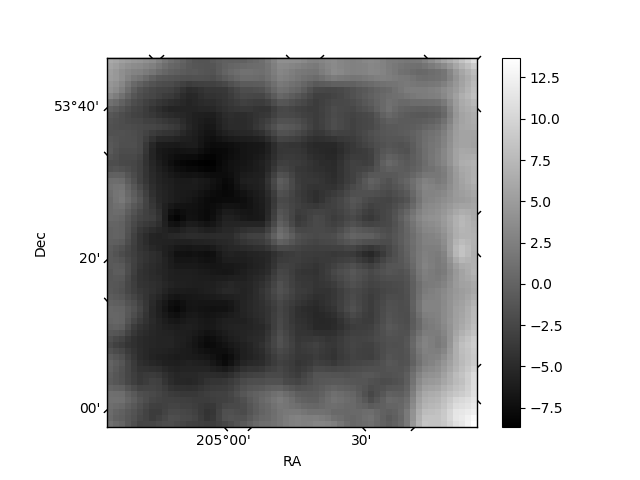
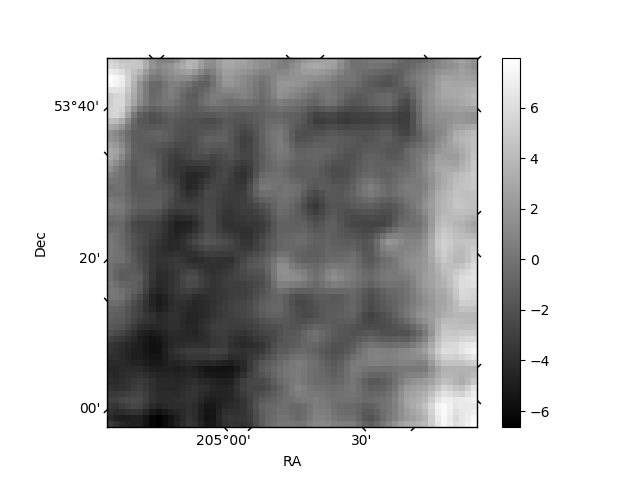
Histogram calculated using DETX and DETY for each event in the final _common_clean file
| Quadrant A | 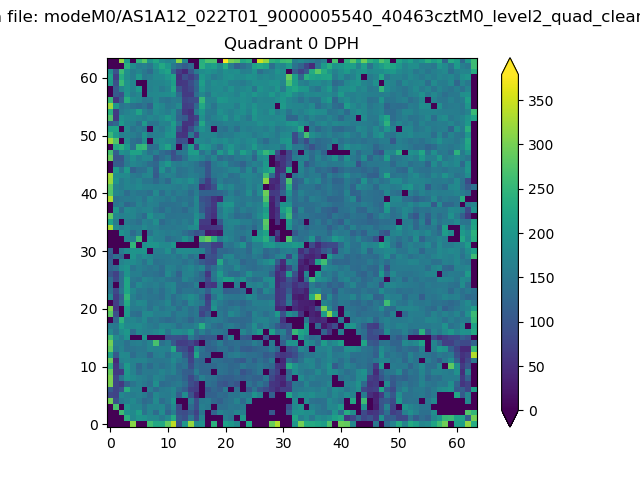 |
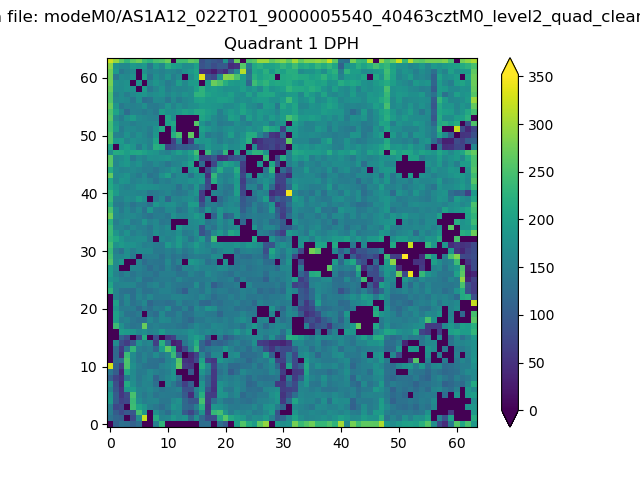 |
Quadrant B |
|---|---|---|---|
| Quadrant D | 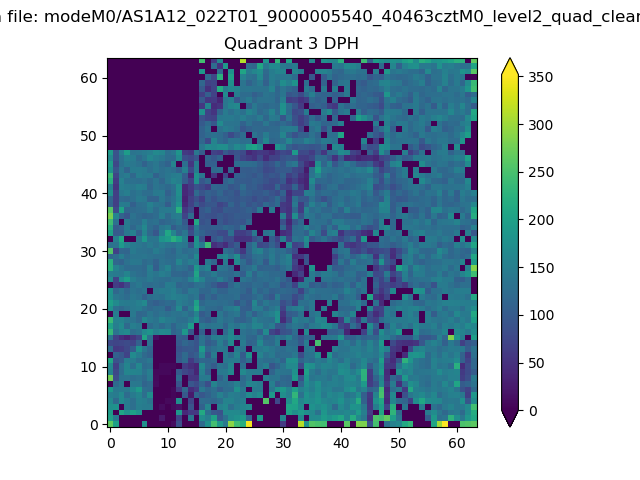 |
 |
Quadrant C |
| Plot type | Count rate plots | Images |
|---|---|---|
| Comparison with Poisson distribution Blue bars denote a histogram of data divided into 1 sec bins. Red curve is a Poisson curve with rate = median count rate of data. |
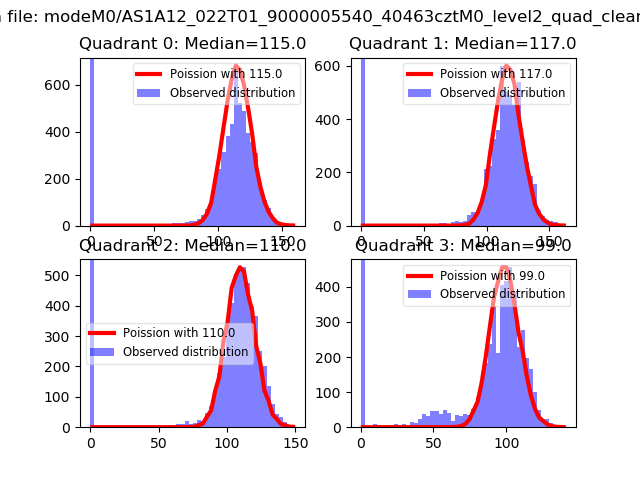 |
 |
| Quadrant-wise count rates Data is divided into 100 sec bins |
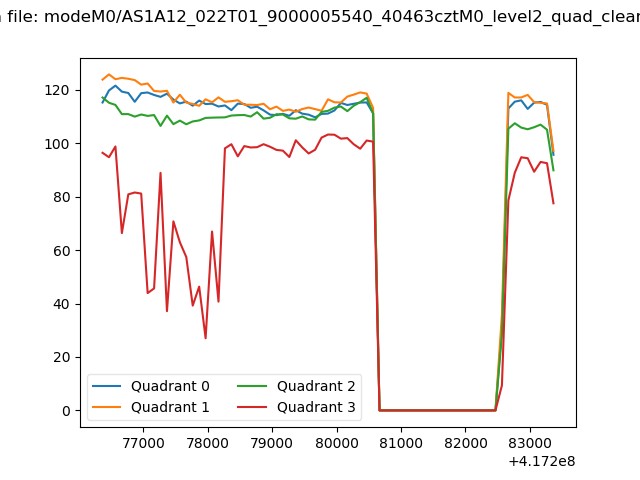 |
|
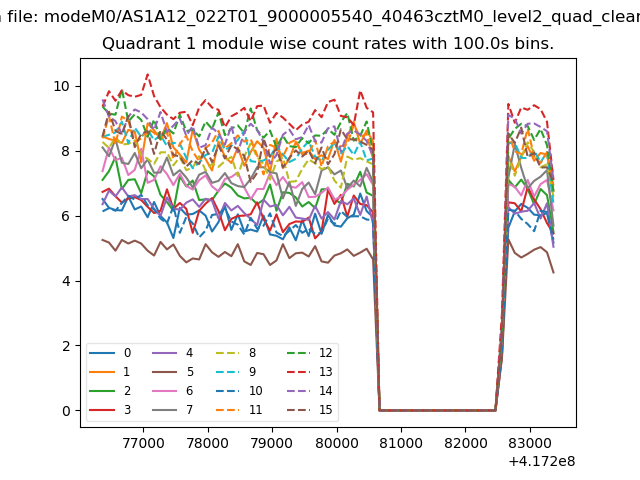
| Module-wise count rates for Quadrant A Data is divided into 100 sec bins |
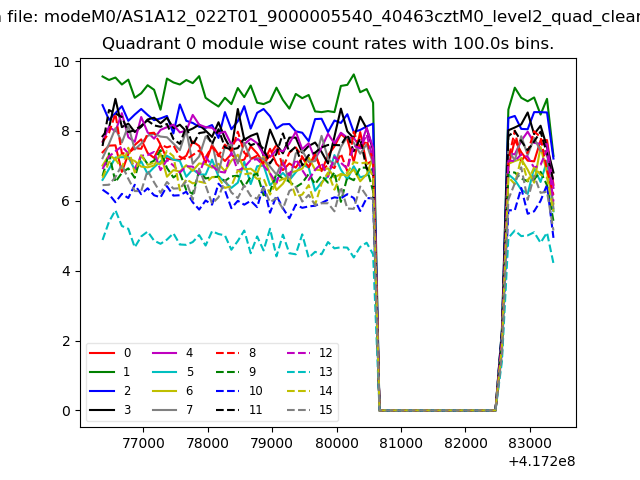 |
 |
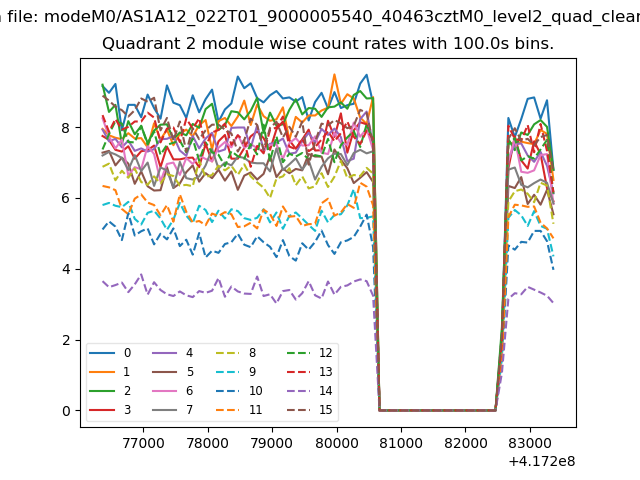
| Module-wise count rates for Quadrant B Data is divided into 100 sec bins |
 |
 |
| Module-wise count rates for Quadrant C Data is divided into 100 sec bins |
 |
 |
| Module-wise count rates for Quadrant D Data is divided into 100 sec bins |
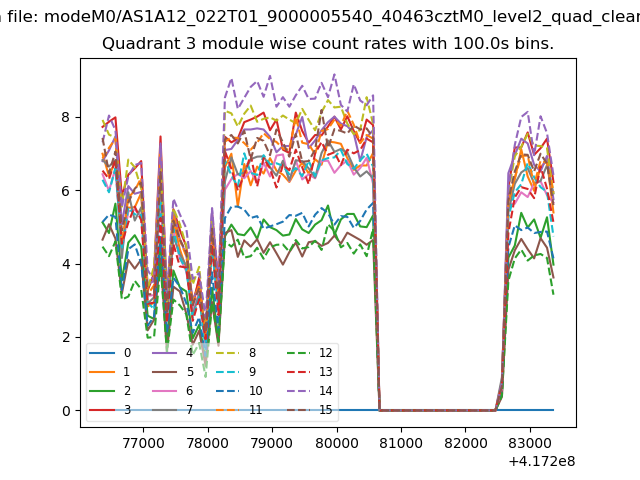 |
 |
| Parameter | Plot |
|---|---|
| CZT HV Monitor | 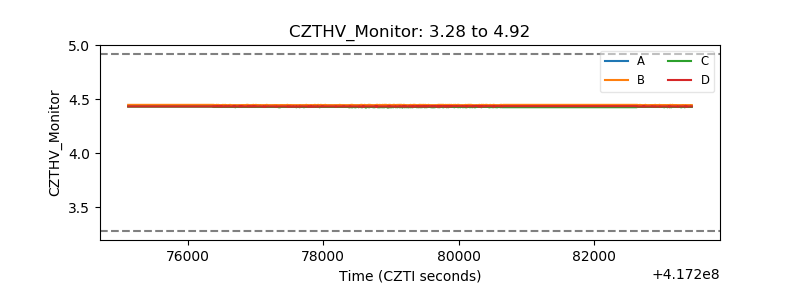 |
| D_VDD | 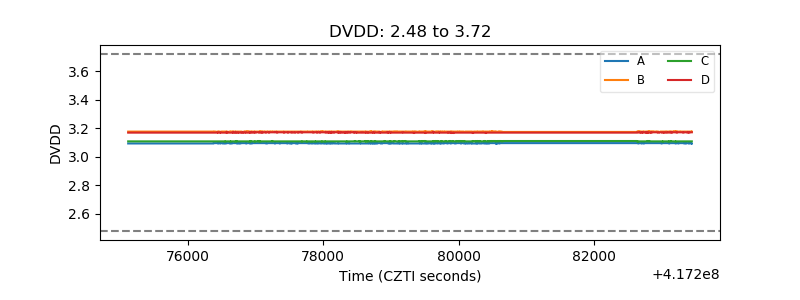 |
| Temperature 1 | 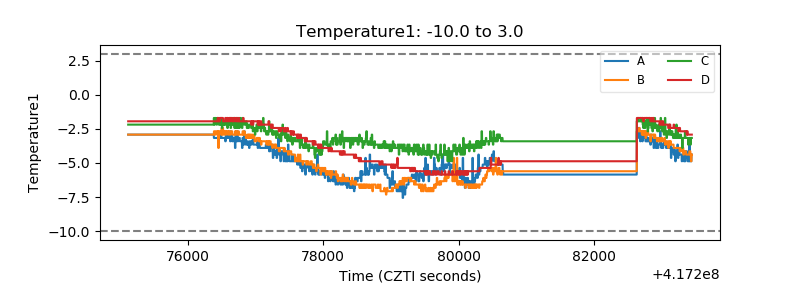 |
| Veto HV Monitor | 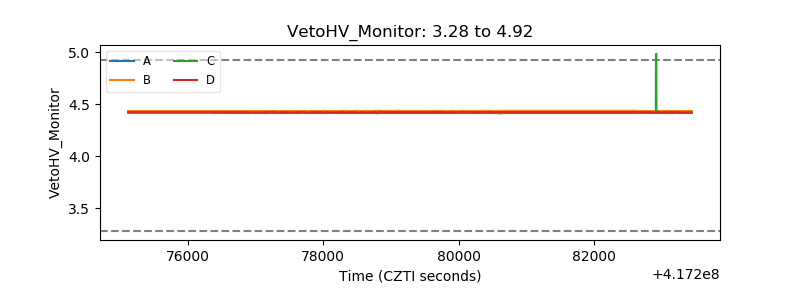 |
| Veto LLD | 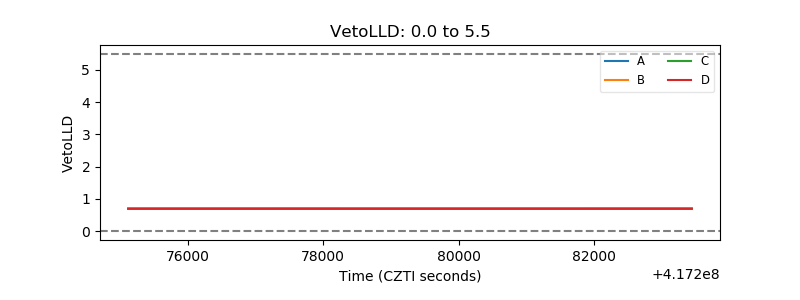 |
| Alpha Counter | 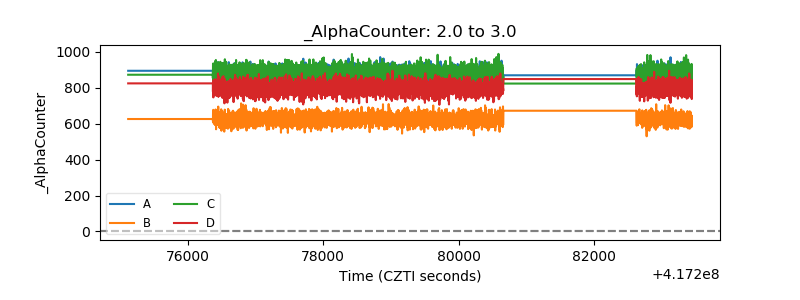 |
| _CPM_Rate | 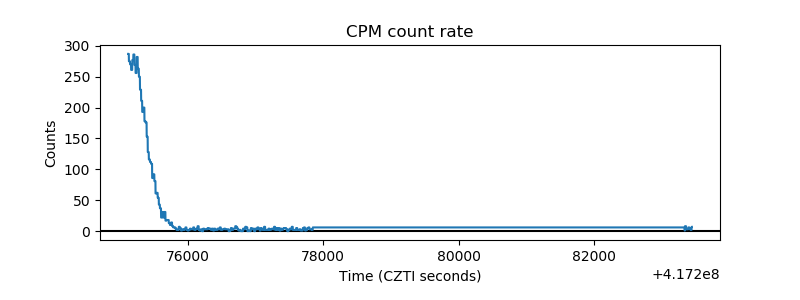 |
| CZT Counter | 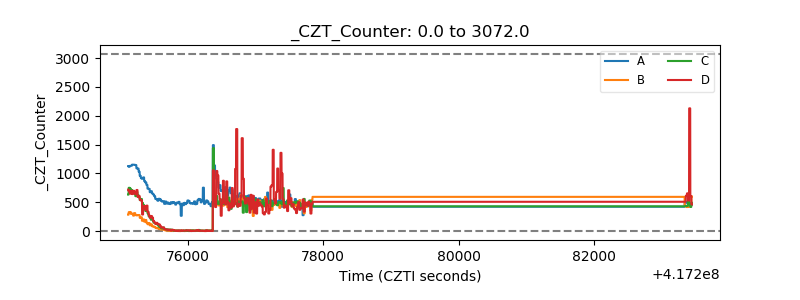 |
| +2.5 Volts monitor | 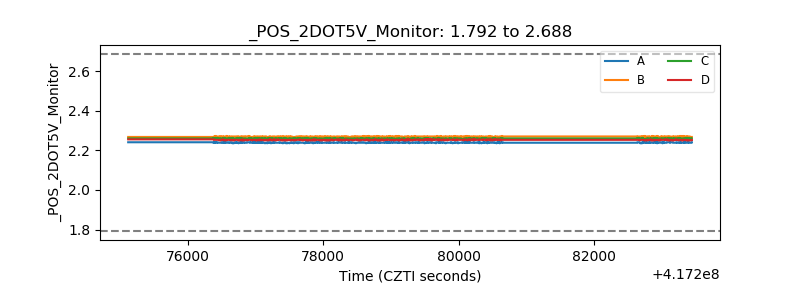 |
| +5 Volts monitor | 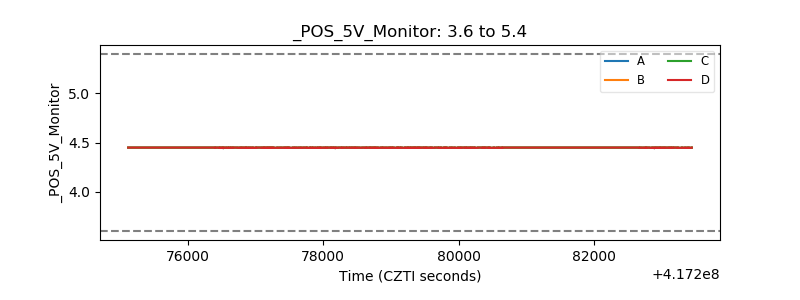 |
| _ROLL_ROT | 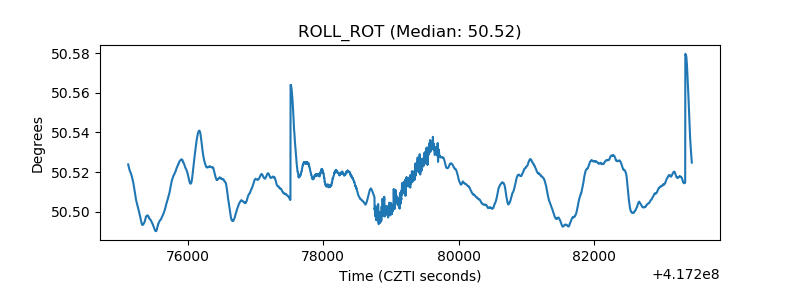 |
| _Roll_DEC | 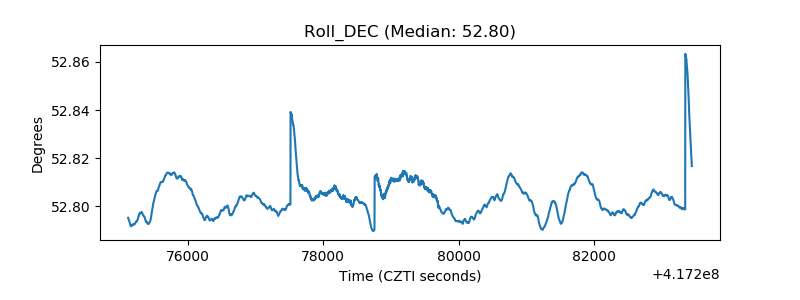 |
| _Roll_RA | 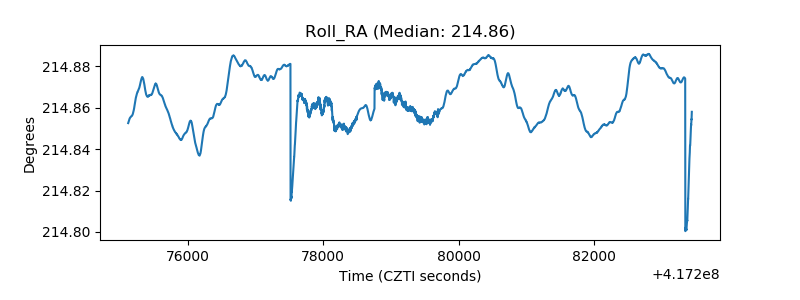 |
| Veto Counter | 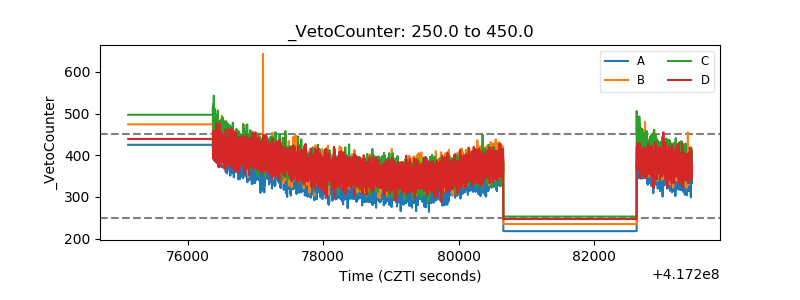 |