| Param | Original file | Final file |
|---|---|---|
| Filename | modeM0/AS1A12_022T01_9000005540_40464cztM0_level2.fits | modeM0/AS1A12_022T01_9000005540_40464cztM0_level2_quad_clean.evt |
| Size (bytes) | 319,478,400 | 88,977,600 |
| Size | 304.7 MB | 84.9 MB |
| Events in quadrant A | 2,811,626 | 611,010 |
| Events in quadrant B | 2,695,414 | 619,266 |
| Events in quadrant C | 2,721,802 | 594,413 |
| Events in quadrant D | 3,166,108 | 482,702 |
| Mode M0 | |||
|---|---|---|---|
| Quadrant | BADHDUFLAG | Total packets | Discarded packets |
| A | 0 | 11970 | 3 |
| B | 0 | 11719 | 2 |
| C | 0 | 11687 | 2 |
| D | 0 | 13327 | 2 |
| Mode M9 | |||
|---|---|---|---|
| Quadrant | BADHDUFLAG | Total packets | Discarded packets |
| A | 0 | 36 | 0 |
| B | 0 | 36 | 0 |
| C | 0 | 36 | 0 |
| D | 0 | 36 | 0 |
| Mode SS | |||
|---|---|---|---|
| Quadrant | BADHDUFLAG | Total packets | Discarded packets |
| A | 0 | 116 | 0 |
| B | 0 | 116 | 0 |
| C | 0 | 116 | 0 |
| D | 0 | 116 | 0 |
| Quadrant | Total seconds | Saturated seconds | Saturation percentage |
|---|---|---|---|
| A | 5522 | 17 | 0.307859% |
| B | 5522 | 47 | 0.851141% |
| C | 5522 | 24 | 0.434625% |
| D | 5522 | 779 | 14.107208% |
Noise dominated data is calculated using 1-second bins in cleaned event files. If a bin has >2000 counts, and if more than 50% of those come from <1% of pixels, then it is considered to be noise-dominated and hence unusable.
| Quadrant | # 1 sec bins | Bins with >0 counts | Bins with >2000 counts | High rate bins dominated by noise | Noise dominated (total time) | Noise dominated (detector-on time) | Marked lightcurve |
|---|---|---|---|---|---|---|---|
| A | 9168 | 5524 | 7 | 7 | 0.08% | 0.13% | 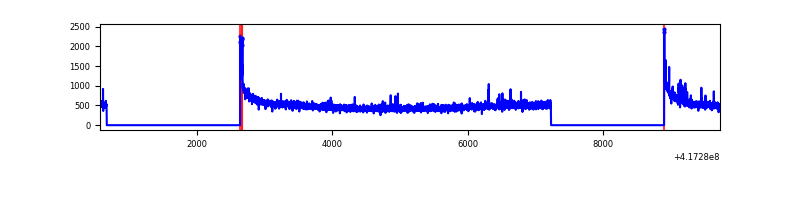 |
| B | 9168 | 5524 | 32 | 32 | 0.35% | 0.58% | 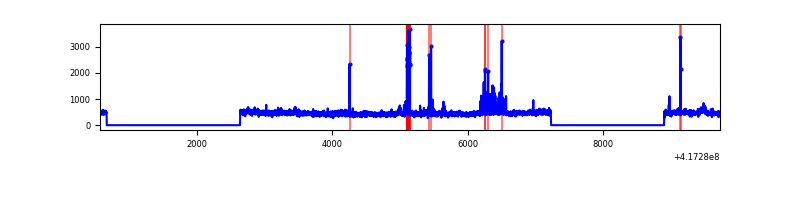 |
| C | 9168 | 5524 | 18 | 18 | 0.20% | 0.33% | 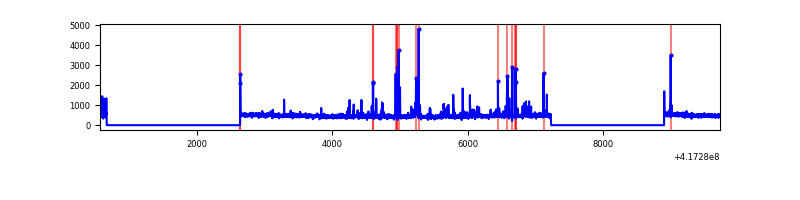 |
| D | 9168 | 5524 | 61 | 61 | 0.67% | 1.10% | 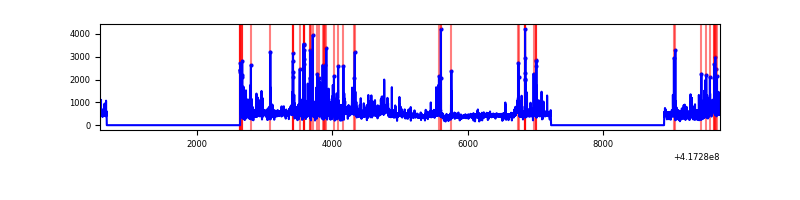 |
Top three noisy pixels from each quadrant. If the there are fewer than three noisy pixels in the level2.evt file, extra rows are filled as -1
| Pixel properties | Quadrant properties | ||||||
|---|---|---|---|---|---|---|---|
| Quadrant | DetID | PixID | Counts | Sigma | Mean | Median | Sigma |
| A | 10 | 83 | 490370 | 4105.38 | 586 | 575 | 119.3 |
| A | 3 | 1 | 35629 | 293.81 | 586 | 575 | 119.3 |
| A | 7 | 3 | 15268 | 123.15 | 586 | 575 | 119.3 |
| B | 4 | 170 | 198345 | 1754.26 | 581 | 565 | 112.7 |
| B | 0 | 230 | 84950 | 748.47 | 581 | 565 | 112.7 |
| B | 3 | 112 | 75647 | 665.96 | 581 | 565 | 112.7 |
| C | 15 | 214 | 239386 | 1786.54 | 575 | 578 | 133.7 |
| C | 14 | 254 | 219563 | 1638.24 | 575 | 578 | 133.7 |
| C | 0 | 10 | 11001 | 77.97 | 575 | 578 | 133.7 |
| D | 12 | 227 | 311296 | 2404.46 | 527 | 512 | 129.3 |
| D | 2 | 250 | 246501 | 1903.16 | 527 | 512 | 129.3 |
| D | 12 | 191 | 197474 | 1523.85 | 527 | 512 | 129.3 |
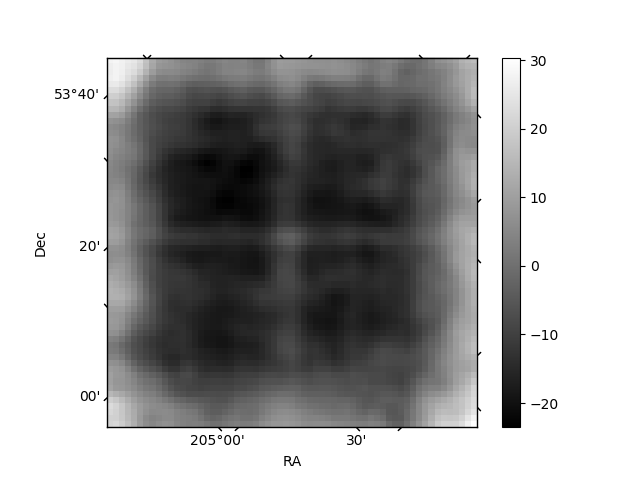
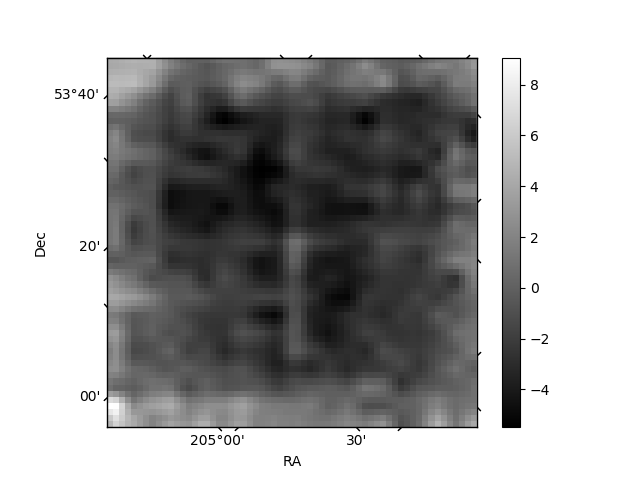
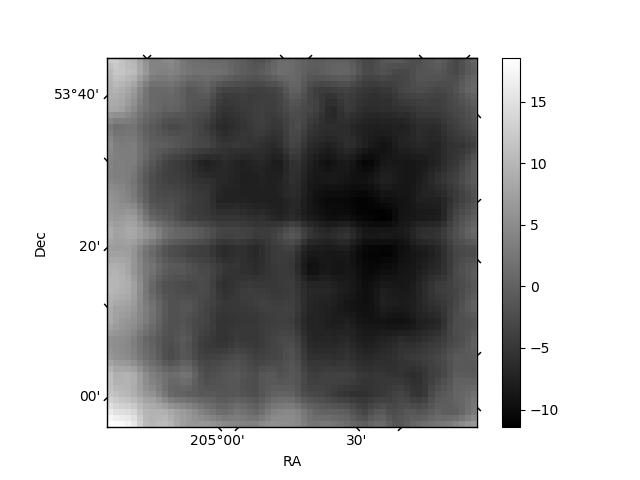
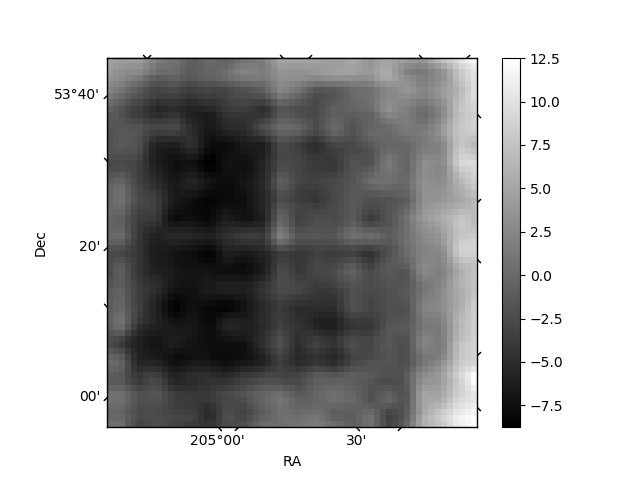
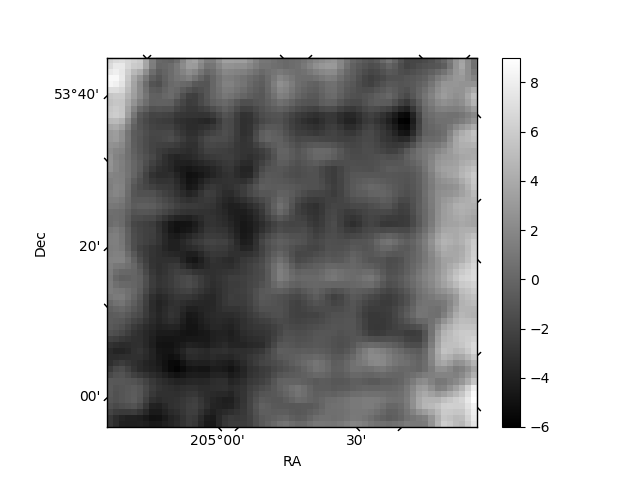
Histogram calculated using DETX and DETY for each event in the final _common_clean file
| Quadrant A | 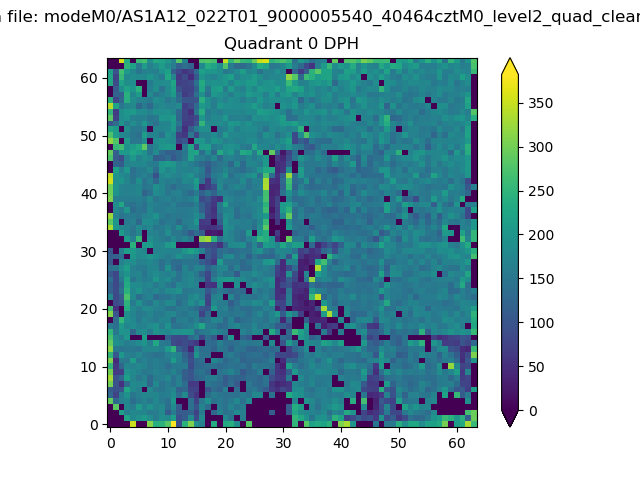 |
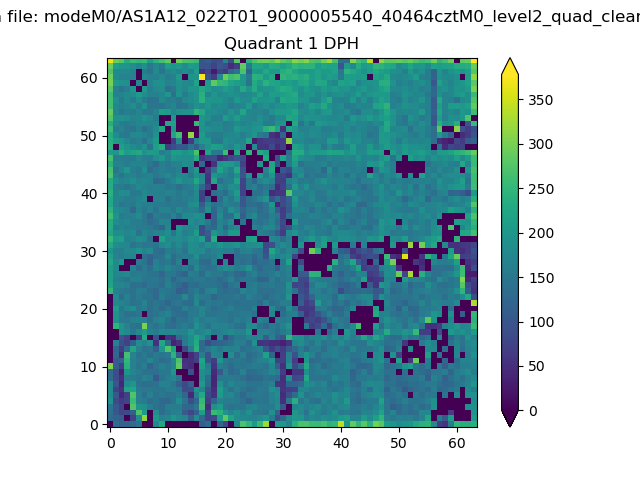 |
Quadrant B |
|---|---|---|---|
| Quadrant D | 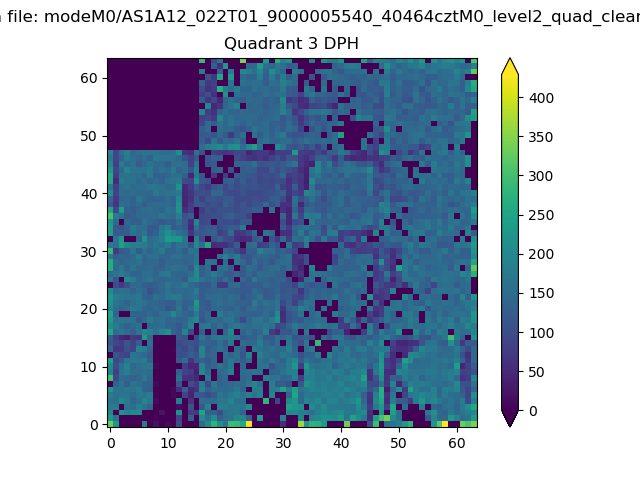 |
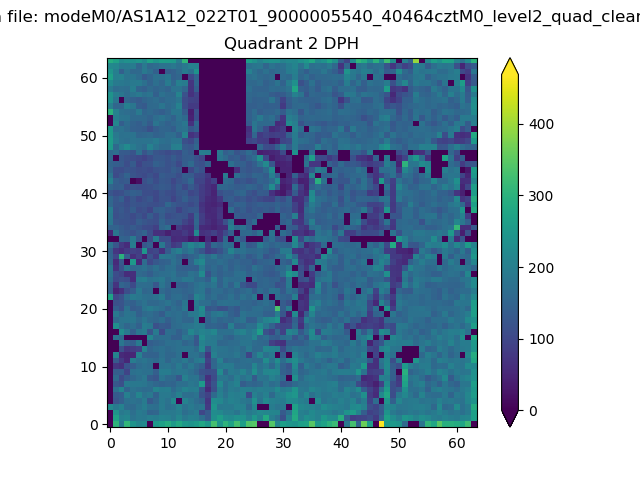 |
Quadrant C |
| Plot type | Count rate plots | Images |
|---|---|---|
| Comparison with Poisson distribution Blue bars denote a histogram of data divided into 1 sec bins. Red curve is a Poisson curve with rate = median count rate of data. |
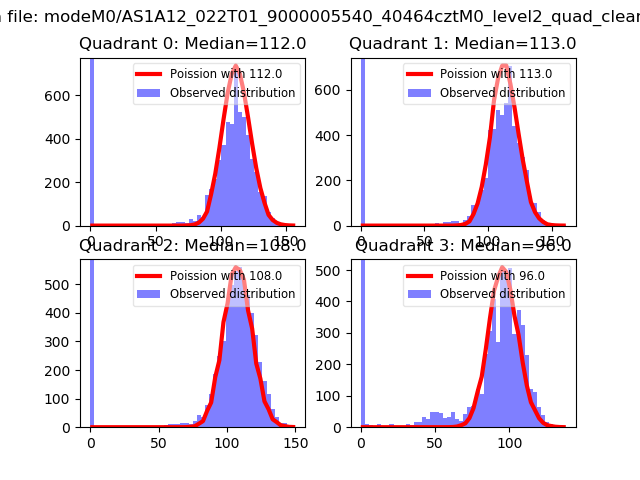 |
 |
| Quadrant-wise count rates Data is divided into 100 sec bins |
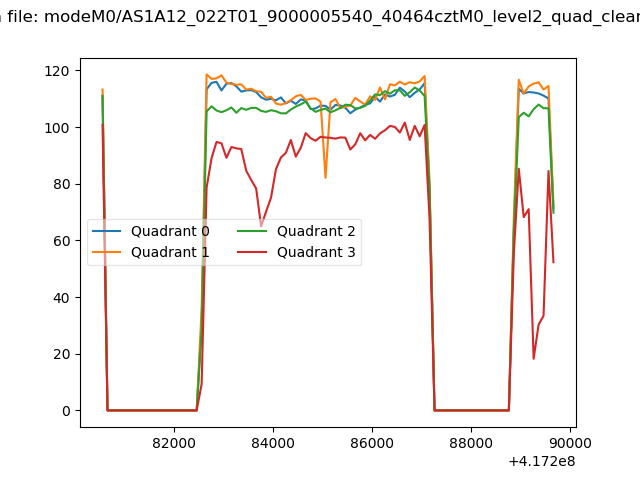 |
|
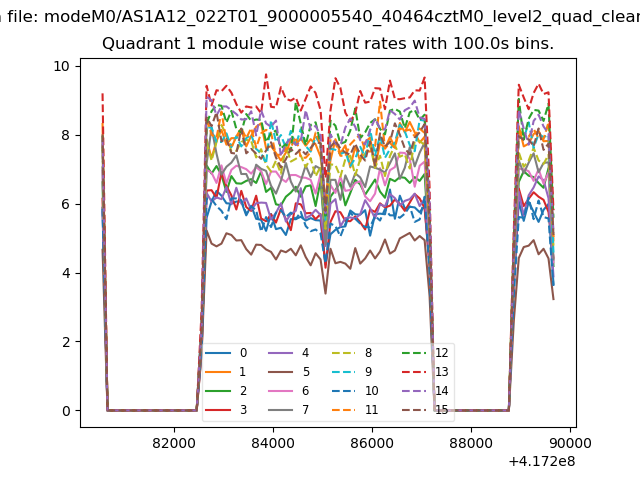
| Module-wise count rates for Quadrant A Data is divided into 100 sec bins |
 |
 |
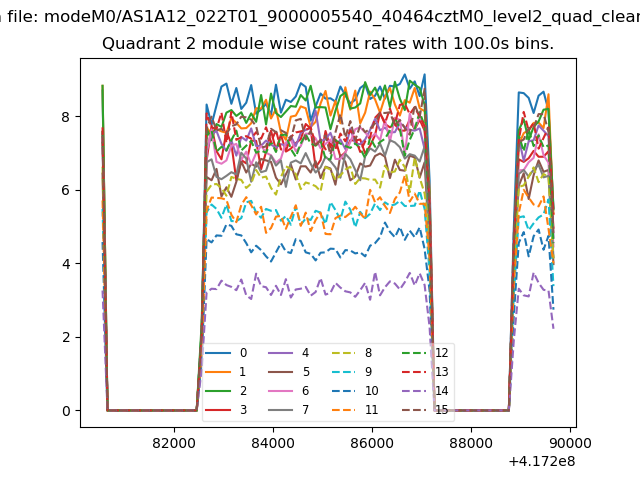
| Module-wise count rates for Quadrant B Data is divided into 100 sec bins |
 |
 |
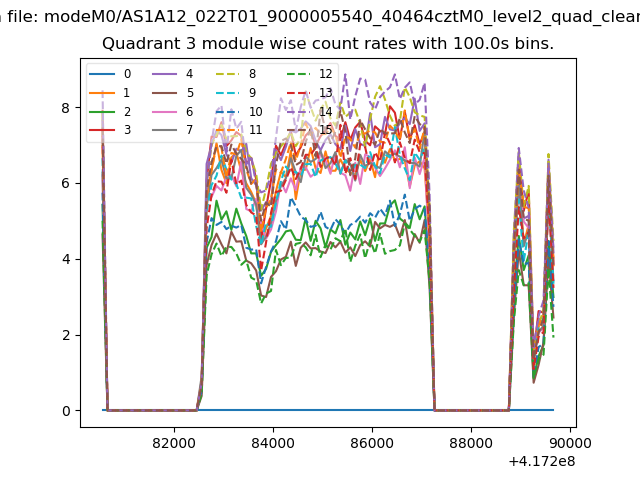
| Module-wise count rates for Quadrant C Data is divided into 100 sec bins |
 |
 |
| Module-wise count rates for Quadrant D Data is divided into 100 sec bins |
 |
 |
| Parameter | Plot |
|---|---|
| CZT HV Monitor | 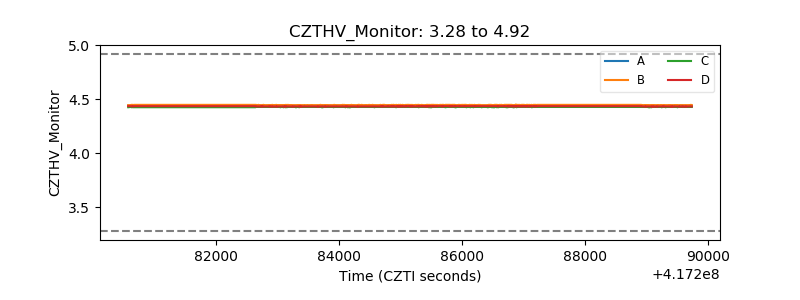 |
| D_VDD | 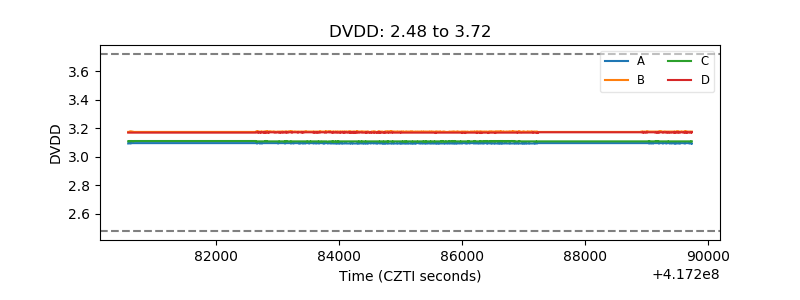 |
| Temperature 1 | 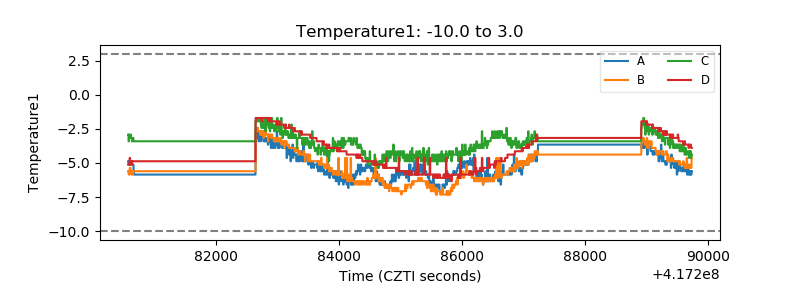 |
| Veto HV Monitor | 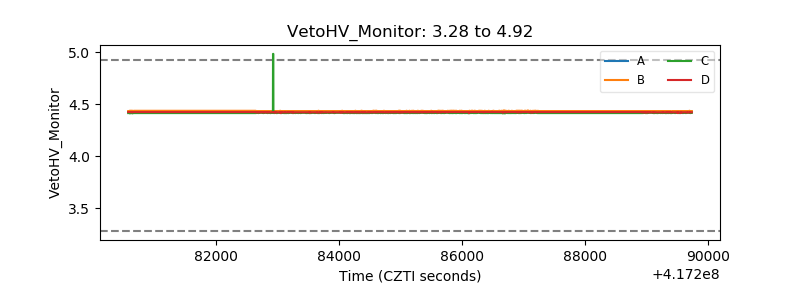 |
| Veto LLD | 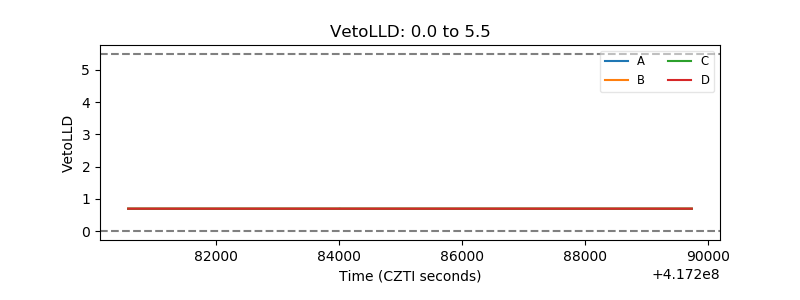 |
| Alpha Counter | 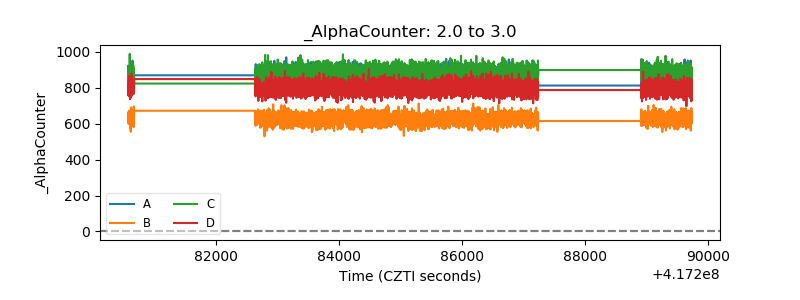 |
| _CPM_Rate | 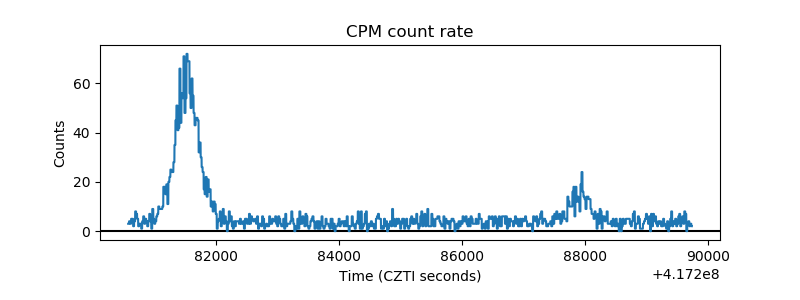 |
| CZT Counter | 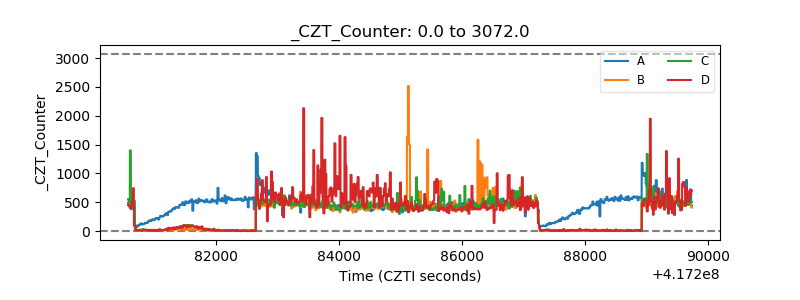 |
| +2.5 Volts monitor | 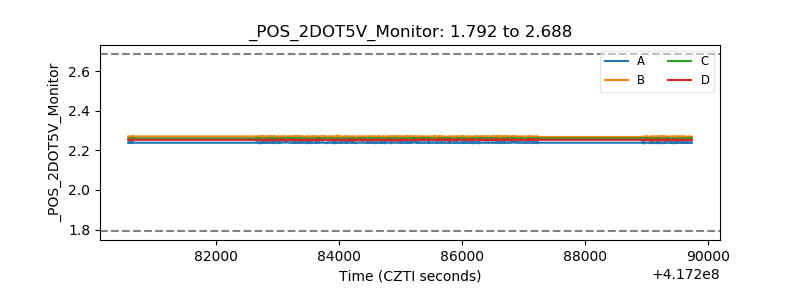 |
| +5 Volts monitor | 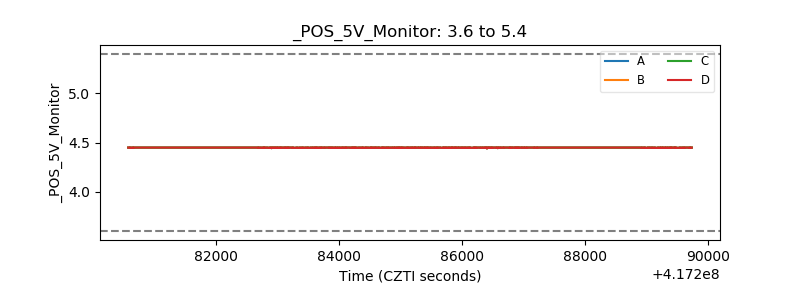 |
| _ROLL_ROT | 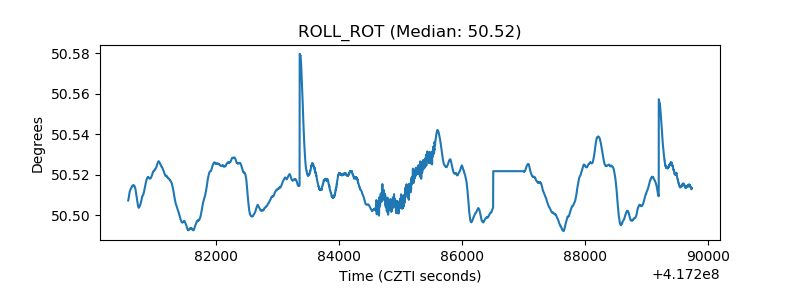 |
| _Roll_DEC | 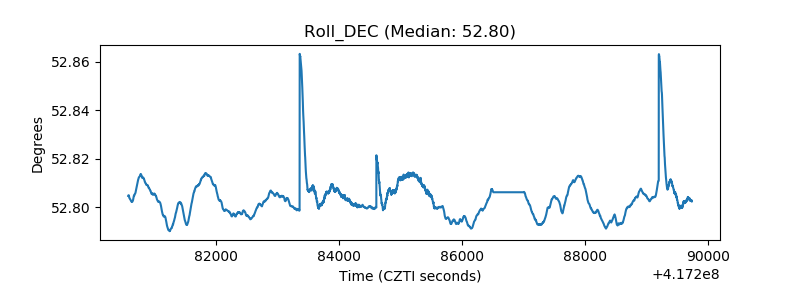 |
| _Roll_RA | 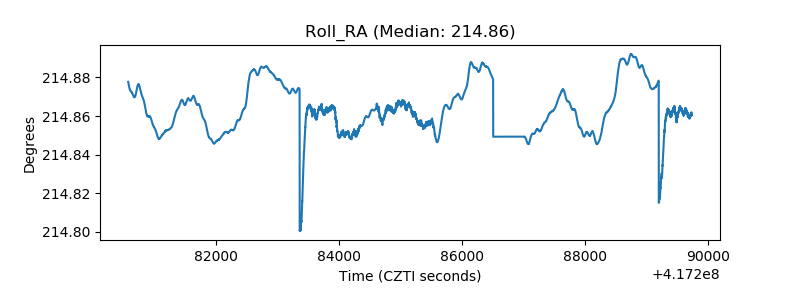 |
| Veto Counter | 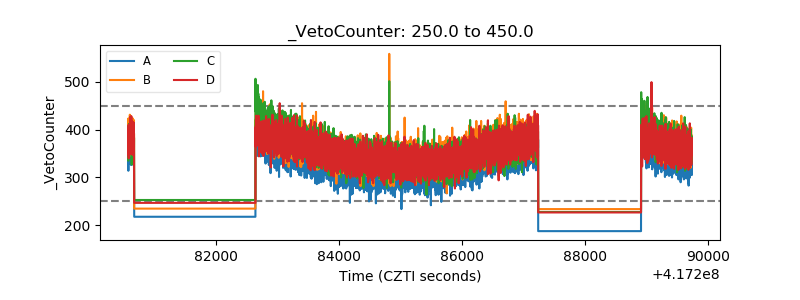 |