| Param | Original file | Final file |
|---|---|---|
| Filename | modeM0/AS1A12_022T01_9000005540_40465cztM0_level2.fits | modeM0/AS1A12_022T01_9000005540_40465cztM0_level2_quad_clean.evt |
| Size (bytes) | 350,576,640 | 94,942,080 |
| Size | 334.3 MB | 90.5 MB |
| Events in quadrant A | 2,982,009 | 649,217 |
| Events in quadrant B | 2,713,222 | 662,790 |
| Events in quadrant C | 2,915,646 | 636,340 |
| Events in quadrant D | 3,900,744 | 509,083 |
| Mode M0 | |||
|---|---|---|---|
| Quadrant | BADHDUFLAG | Total packets | Discarded packets |
| A | 0 | 12765 | 3 |
| B | 0 | 12295 | 2 |
| C | 0 | 12589 | 2 |
| D | 0 | 15822 | 2 |
| Mode M9 | |||
|---|---|---|---|
| Quadrant | BADHDUFLAG | Total packets | Discarded packets |
| A | 0 | 30 | 0 |
| B | 0 | 30 | 0 |
| C | 0 | 30 | 0 |
| D | 0 | 30 | 0 |
| Mode SS | |||
|---|---|---|---|
| Quadrant | BADHDUFLAG | Total packets | Discarded packets |
| A | 0 | 126 | 0 |
| B | 0 | 126 | 0 |
| C | 0 | 126 | 0 |
| D | 0 | 126 | 0 |
| Quadrant | Total seconds | Saturated seconds | Saturation percentage |
|---|---|---|---|
| A | 5965 | 13 | 0.217938% |
| B | 5965 | 23 | 0.385583% |
| C | 5965 | 39 | 0.653814% |
| D | 5965 | 983 | 16.479464% |
Noise dominated data is calculated using 1-second bins in cleaned event files. If a bin has >2000 counts, and if more than 50% of those come from <1% of pixels, then it is considered to be noise-dominated and hence unusable.
| Quadrant | # 1 sec bins | Bins with >0 counts | Bins with >2000 counts | High rate bins dominated by noise | Noise dominated (total time) | Noise dominated (detector-on time) | Marked lightcurve |
|---|---|---|---|---|---|---|---|
| A | 9041 | 5967 | 5 | 5 | 0.06% | 0.08% | 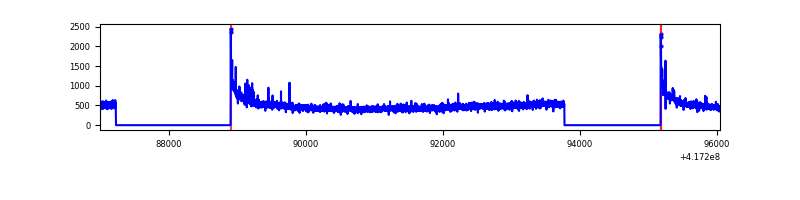 |
| B | 9041 | 5967 | 14 | 14 | 0.15% | 0.23% | 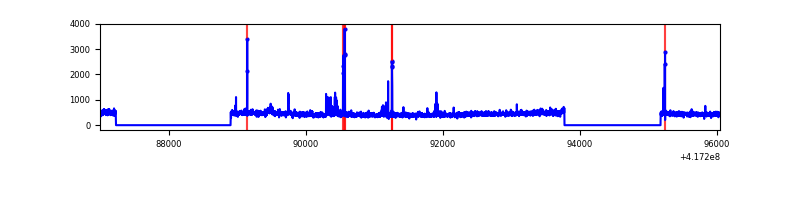 |
| C | 9041 | 5967 | 31 | 31 | 0.34% | 0.52% | 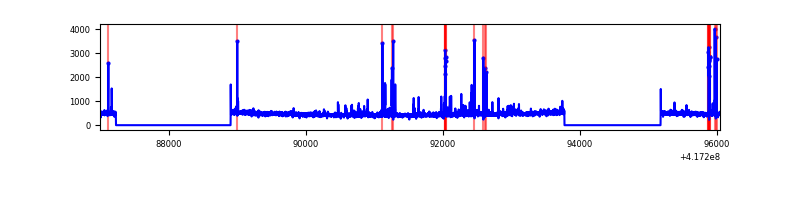 |
| D | 9041 | 5967 | 154 | 154 | 1.70% | 2.58% | 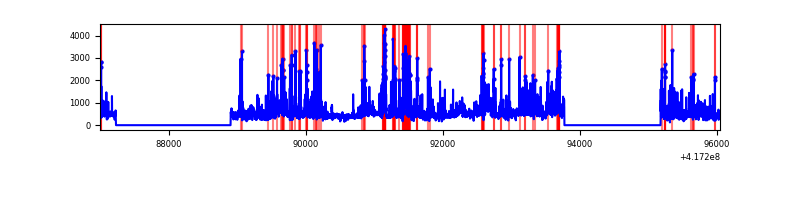 |
Top three noisy pixels from each quadrant. If the there are fewer than three noisy pixels in the level2.evt file, extra rows are filled as -1
| Pixel properties | Quadrant properties | ||||||
|---|---|---|---|---|---|---|---|
| Quadrant | DetID | PixID | Counts | Sigma | Mean | Median | Sigma |
| A | 10 | 83 | 504849 | 3930.4 | 628 | 616 | 128.3 |
| A | 3 | 1 | 26539 | 202.06 | 628 | 616 | 128.3 |
| A | 12 | 189 | 16486 | 123.7 | 628 | 616 | 128.3 |
| B | 4 | 170 | 95578 | 784.46 | 625 | 607 | 121.1 |
| B | 0 | 230 | 69798 | 571.52 | 625 | 607 | 121.1 |
| B | 3 | 112 | 57834 | 472.69 | 625 | 607 | 121.1 |
| C | 15 | 214 | 258545 | 1789.15 | 614 | 617 | 144.2 |
| C | 14 | 254 | 207292 | 1433.63 | 614 | 617 | 144.2 |
| C | 9 | 187 | 26024 | 176.24 | 614 | 617 | 144.2 |
| D | 2 | 250 | 597199 | 4363.73 | 561 | 546 | 136.7 |
| D | 2 | 120 | 329432 | 2405.37 | 561 | 546 | 136.7 |
| D | 12 | 191 | 206514 | 1506.38 | 561 | 546 | 136.7 |
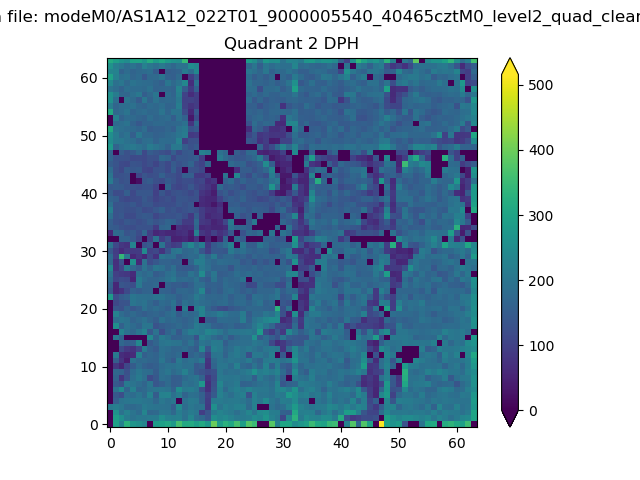
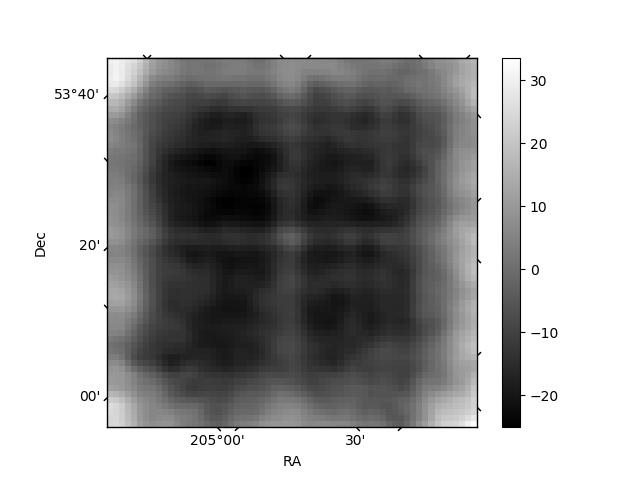
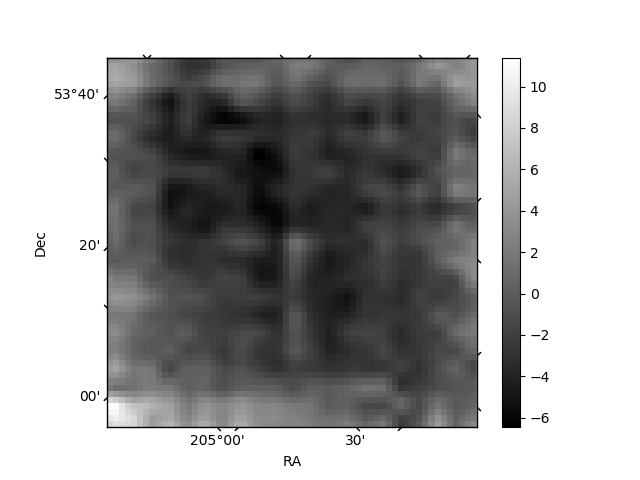
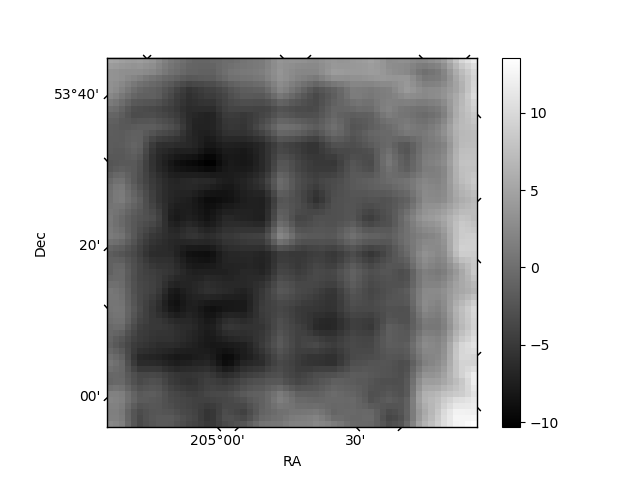
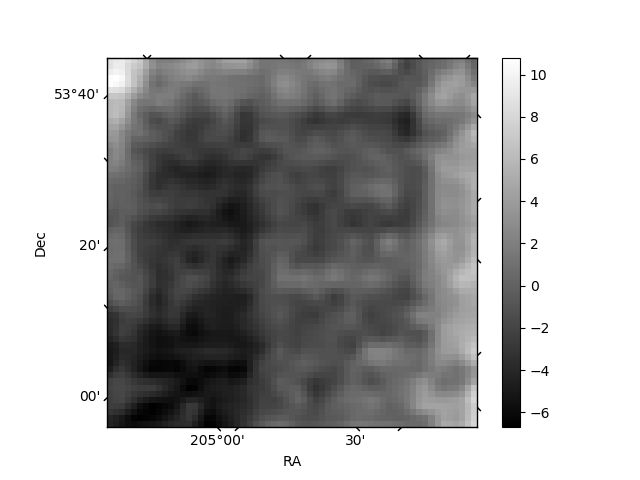
Histogram calculated using DETX and DETY for each event in the final _common_clean file
| Quadrant A | 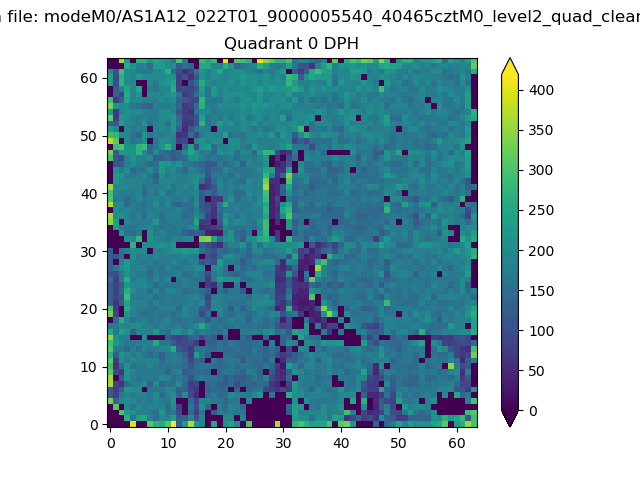 |
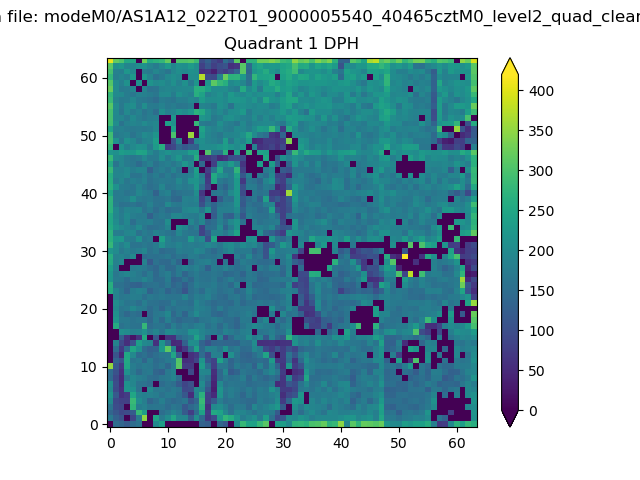 |
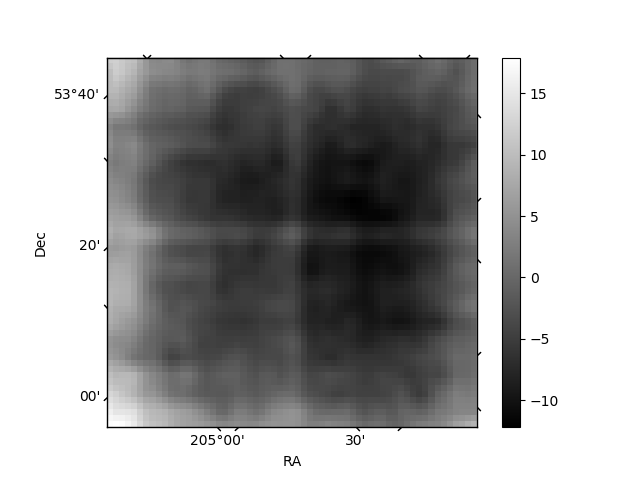
Quadrant B |
|---|---|---|---|
| Quadrant D | 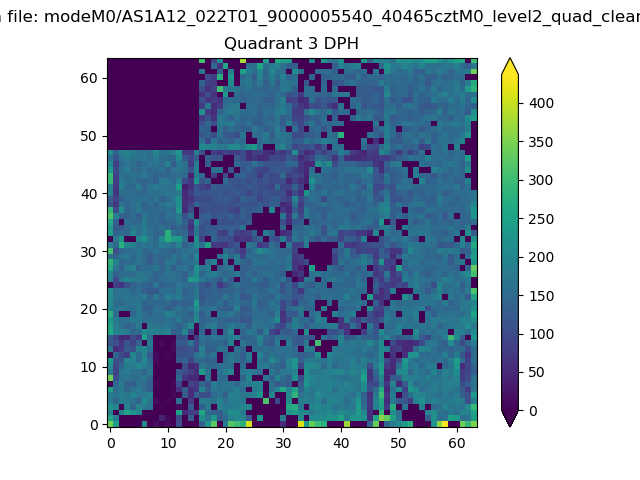 |
 |
Quadrant C |
| Plot type | Count rate plots | Images |
|---|---|---|
| Comparison with Poisson distribution Blue bars denote a histogram of data divided into 1 sec bins. Red curve is a Poisson curve with rate = median count rate of data. |
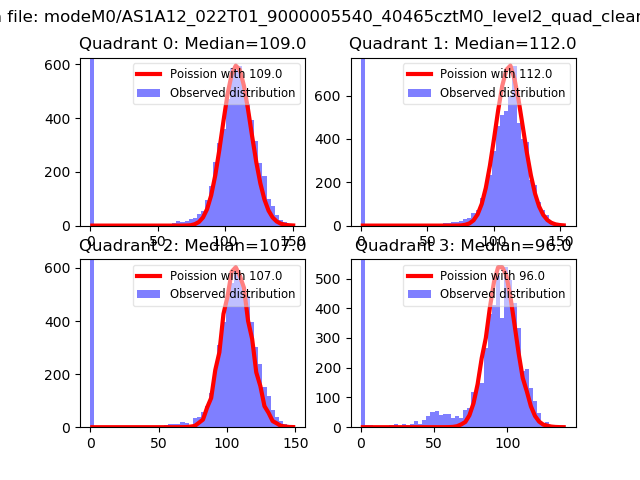 |
 |
| Quadrant-wise count rates Data is divided into 100 sec bins |
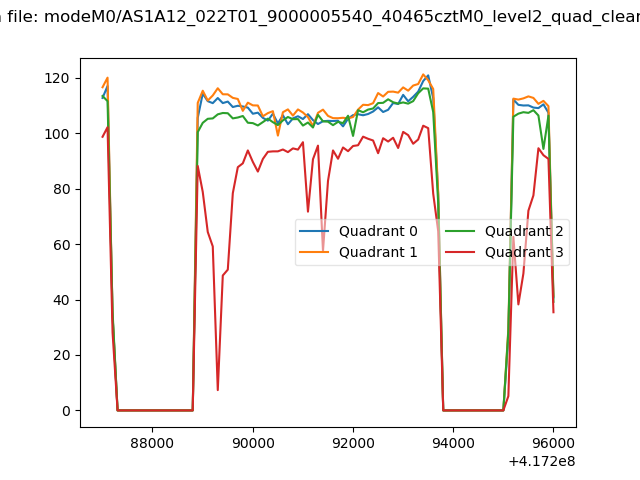 |
|
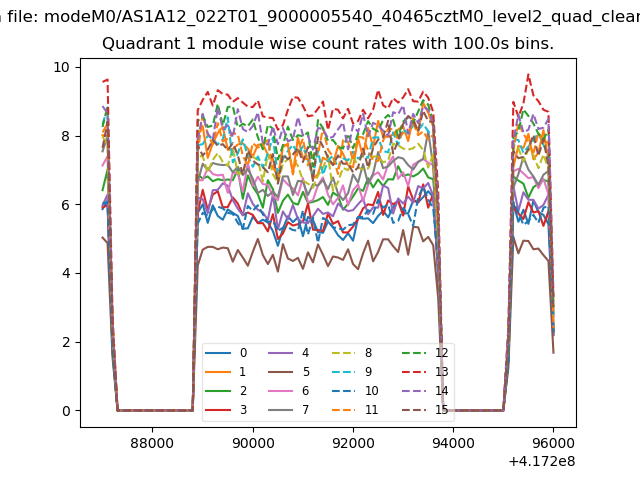
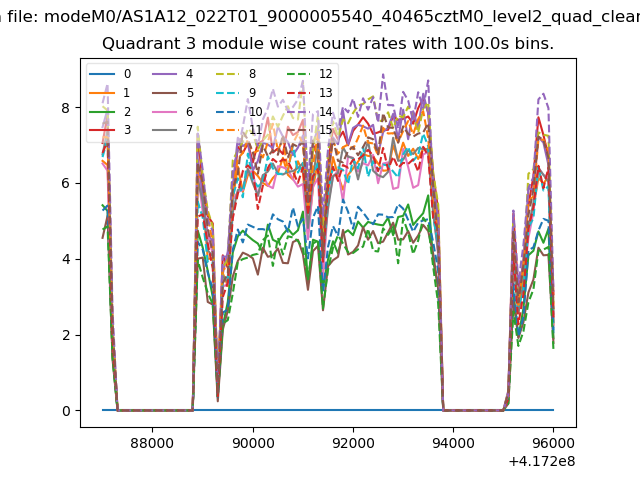
| Module-wise count rates for Quadrant A Data is divided into 100 sec bins |
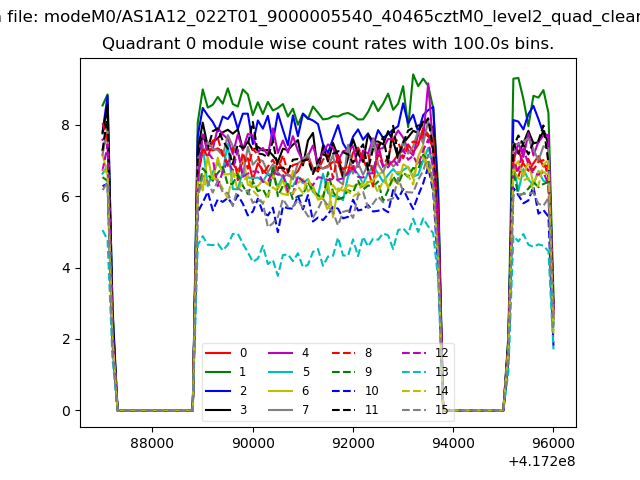 |
 |
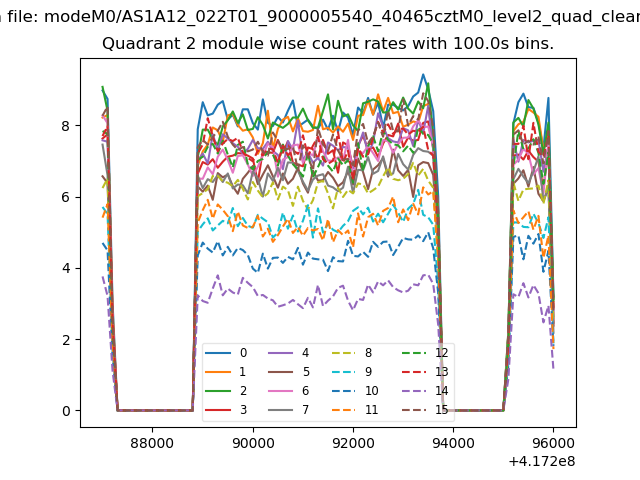
| Module-wise count rates for Quadrant B Data is divided into 100 sec bins |
 |
 |
| Module-wise count rates for Quadrant C Data is divided into 100 sec bins |
 |
 |
| Module-wise count rates for Quadrant D Data is divided into 100 sec bins |
 |
 |
| Parameter | Plot |
|---|---|
| CZT HV Monitor | 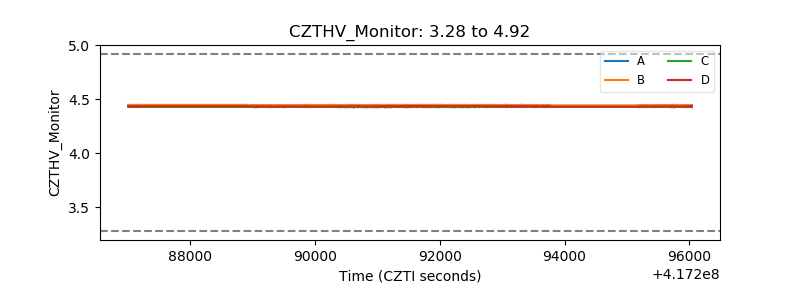 |
| D_VDD | 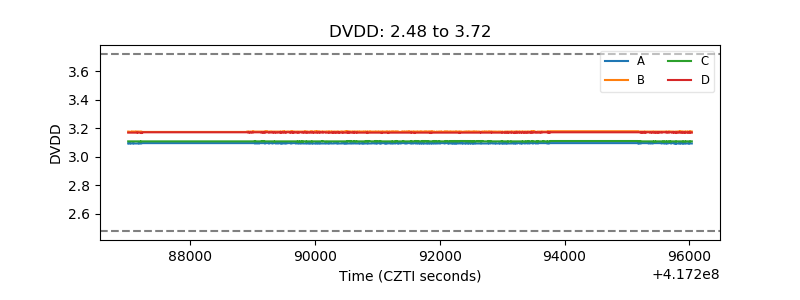 |
| Temperature 1 | 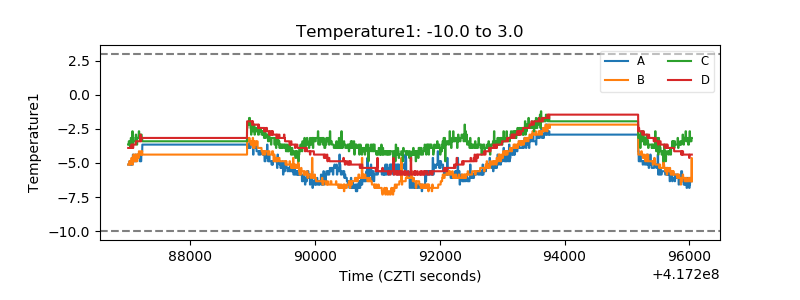 |
| Veto HV Monitor | 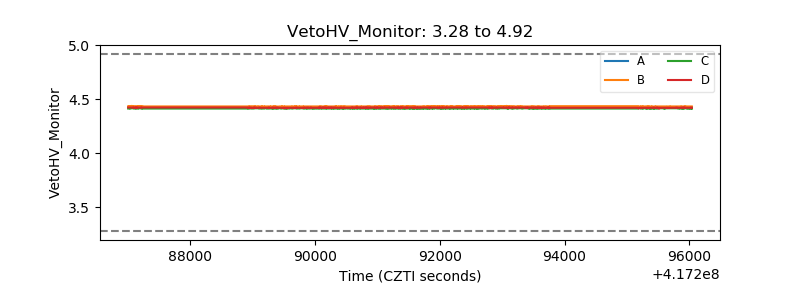 |
| Veto LLD | 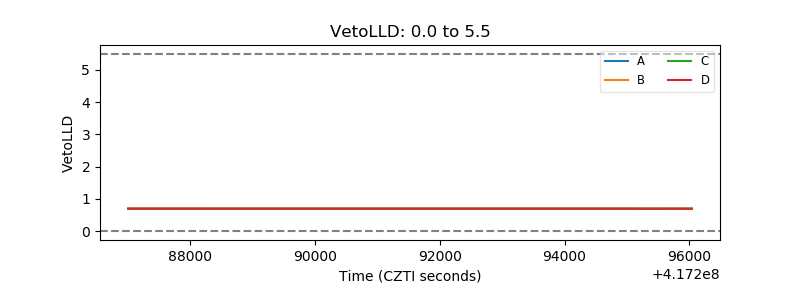 |
| Alpha Counter | 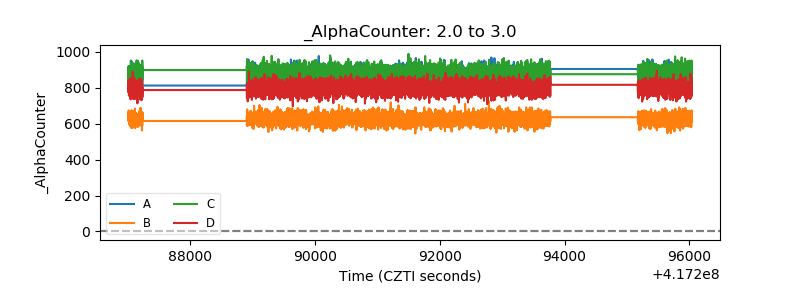 |
| _CPM_Rate | 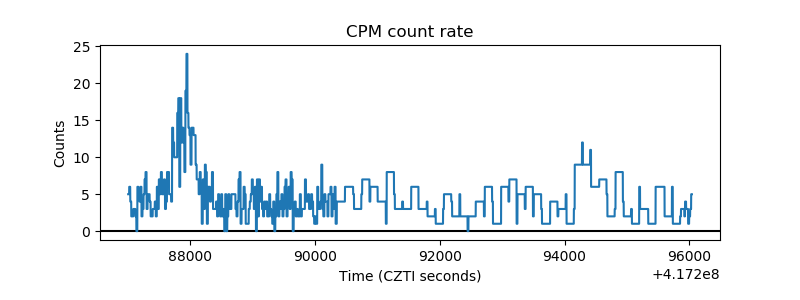 |
| CZT Counter | 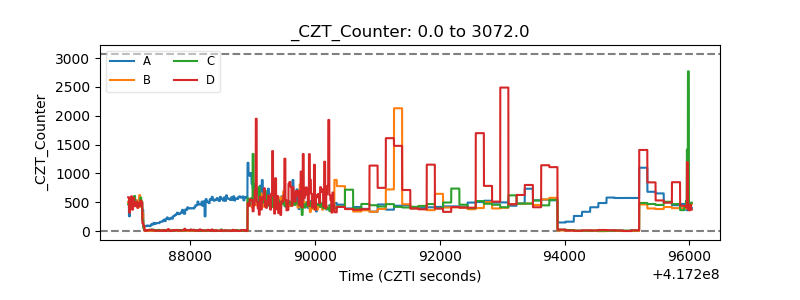 |
| +2.5 Volts monitor | 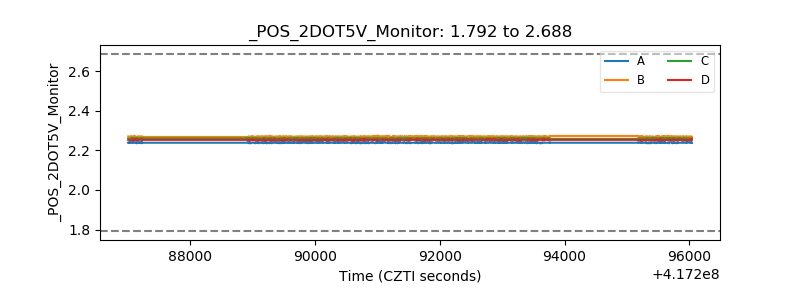 |
| +5 Volts monitor | 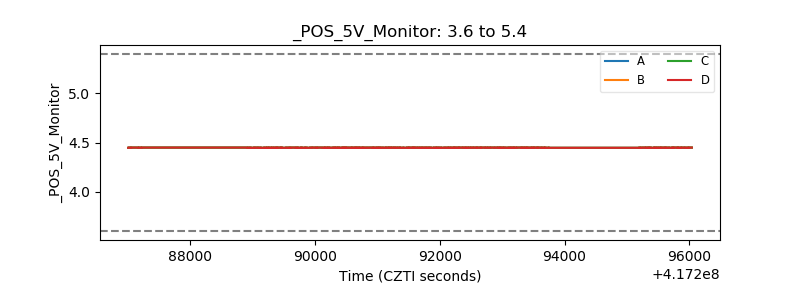 |
| _ROLL_ROT | 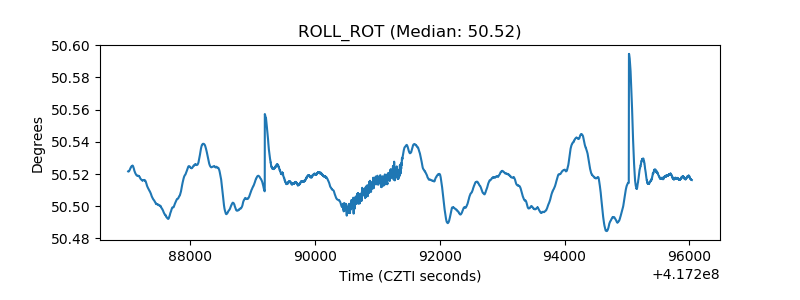 |
| _Roll_DEC | 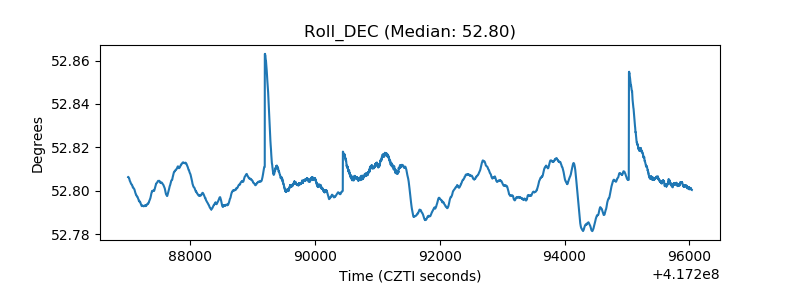 |
| _Roll_RA | 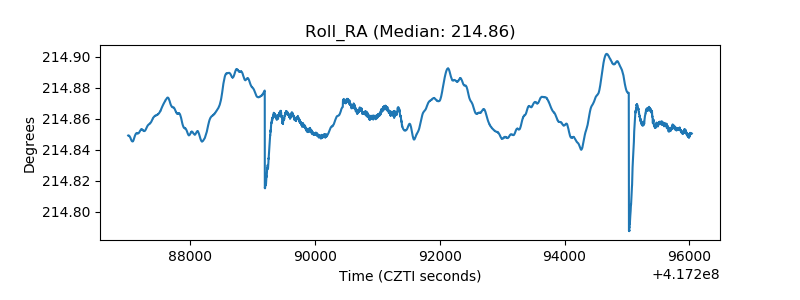 |
| Veto Counter | 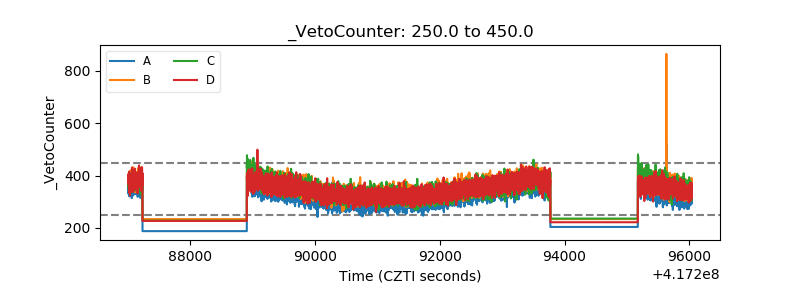 |