| Param | Original file | Final file |
|---|---|---|
| Filename | modeM0/AS1A12_022T01_9000005540_40466cztM0_level2.fits | modeM0/AS1A12_022T01_9000005540_40466cztM0_level2_quad_clean.evt |
| Size (bytes) | 323,072,640 | 93,830,400 |
| Size | 308.1 MB | 89.5 MB |
| Events in quadrant A | 2,940,728 | 635,676 |
| Events in quadrant B | 2,530,898 | 647,586 |
| Events in quadrant C | 2,915,454 | 626,194 |
| Events in quadrant D | 3,114,214 | 521,646 |
| Mode M0 | |||
|---|---|---|---|
| Quadrant | BADHDUFLAG | Total packets | Discarded packets |
| A | 0 | 12592 | 3 |
| B | 0 | 11816 | 2 |
| C | 0 | 12560 | 2 |
| D | 0 | 13597 | 2 |
| Mode M9 | |||
|---|---|---|---|
| Quadrant | BADHDUFLAG | Total packets | Discarded packets |
| A | 0 | 23 | 0 |
| B | 0 | 23 | 0 |
| C | 0 | 23 | 0 |
| D | 0 | 24 | 0 |
| Mode SS | |||
|---|---|---|---|
| Quadrant | BADHDUFLAG | Total packets | Discarded packets |
| A | 0 | 120 | 0 |
| B | 0 | 120 | 0 |
| C | 0 | 120 | 0 |
| D | 0 | 120 | 0 |
| Quadrant | Total seconds | Saturated seconds | Saturation percentage |
|---|---|---|---|
| A | 5863 | 12 | 0.204673% |
| B | 5863 | 7 | 0.119393% |
| C | 5863 | 43 | 0.733413% |
| D | 5863 | 704 | 12.007505% |
Noise dominated data is calculated using 1-second bins in cleaned event files. If a bin has >2000 counts, and if more than 50% of those come from <1% of pixels, then it is considered to be noise-dominated and hence unusable.
| Quadrant | # 1 sec bins | Bins with >0 counts | Bins with >2000 counts | High rate bins dominated by noise | Noise dominated (total time) | Noise dominated (detector-on time) | Marked lightcurve |
|---|---|---|---|---|---|---|---|
| A | 7176 | 5864 | 5 | 5 | 0.07% | 0.09% | 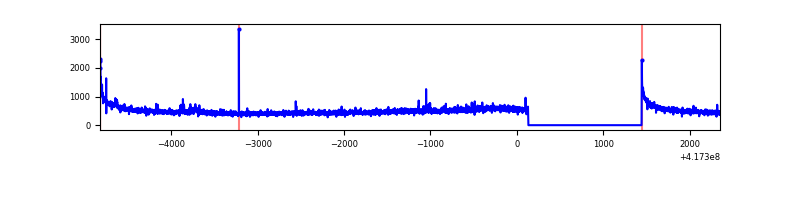 |
| B | 7176 | 5864 | 2 | 2 | 0.03% | 0.03% | 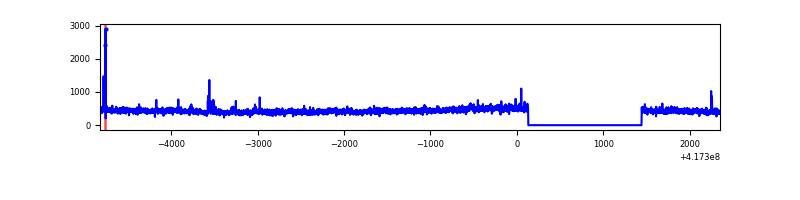 |
| C | 7176 | 5864 | 34 | 34 | 0.47% | 0.58% | 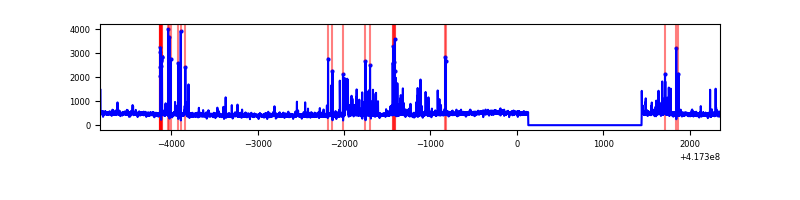 |
| D | 7176 | 5864 | 78 | 78 | 1.09% | 1.33% | 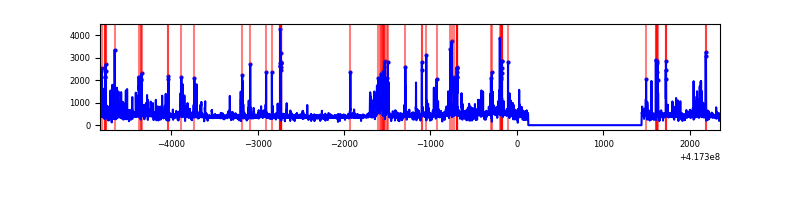 |
Top three noisy pixels from each quadrant. If the there are fewer than three noisy pixels in the level2.evt file, extra rows are filled as -1
| Pixel properties | Quadrant properties | ||||||
|---|---|---|---|---|---|---|---|
| Quadrant | DetID | PixID | Counts | Sigma | Mean | Median | Sigma |
| A | 10 | 83 | 509027 | 4046.85 | 613 | 602 | 125.6 |
| A | 12 | 189 | 34710 | 271.49 | 613 | 602 | 125.6 |
| A | 3 | 1 | 11492 | 86.68 | 613 | 602 | 125.6 |
| B | 0 | 190 | 63139 | 530.91 | 609 | 593 | 117.8 |
| B | 4 | 170 | 21842 | 180.37 | 609 | 593 | 117.8 |
| B | 3 | 112 | 18520 | 152.17 | 609 | 593 | 117.8 |
| C | 14 | 254 | 253224 | 1781.21 | 602 | 606 | 141.8 |
| C | 15 | 214 | 252235 | 1774.24 | 602 | 606 | 141.8 |
| C | 10 | 20 | 53574 | 373.48 | 602 | 606 | 141.8 |
| D | 12 | 128 | 295328 | 2147.39 | 560 | 545 | 137.3 |
| D | 2 | 250 | 197392 | 1433.96 | 560 | 545 | 137.3 |
| D | 12 | 191 | 182566 | 1325.96 | 560 | 545 | 137.3 |
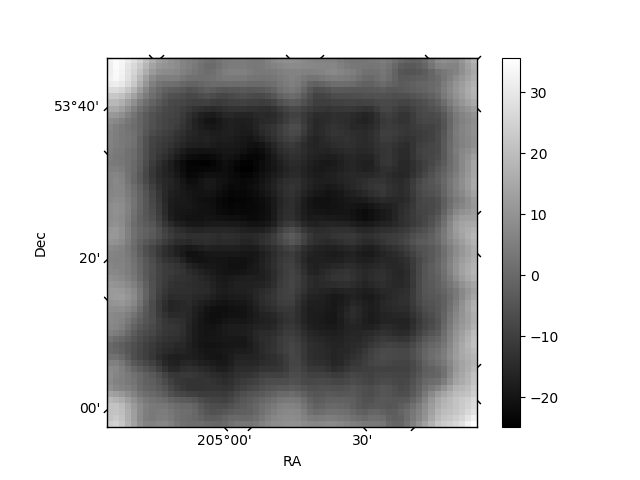
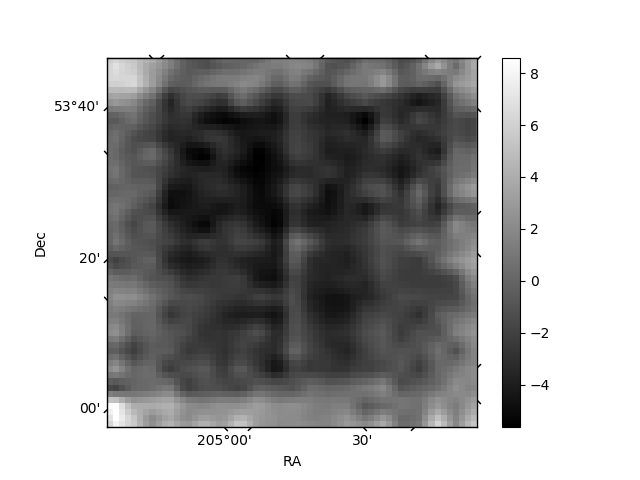
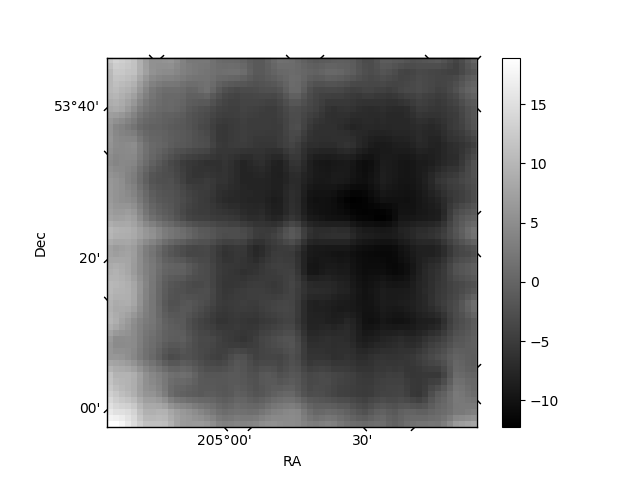
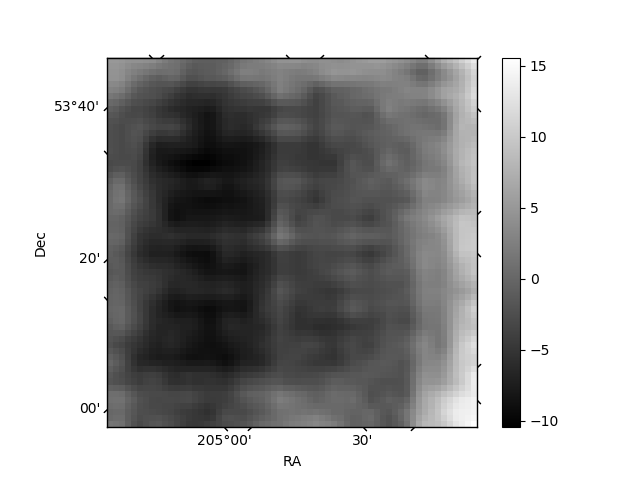
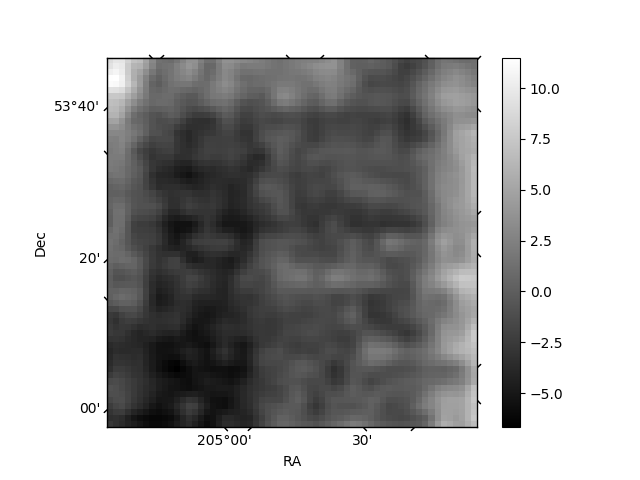
Histogram calculated using DETX and DETY for each event in the final _common_clean file
| Quadrant A | 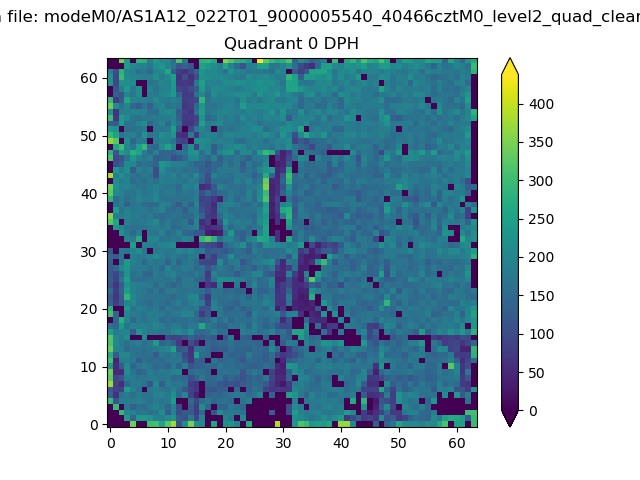 |
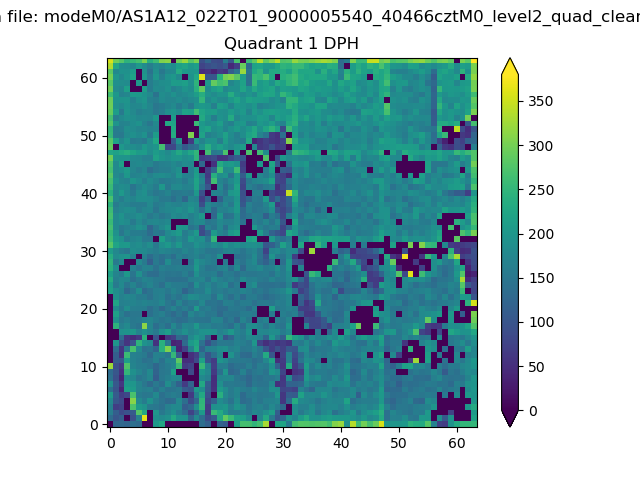 |
Quadrant B |
|---|---|---|---|
| Quadrant D | 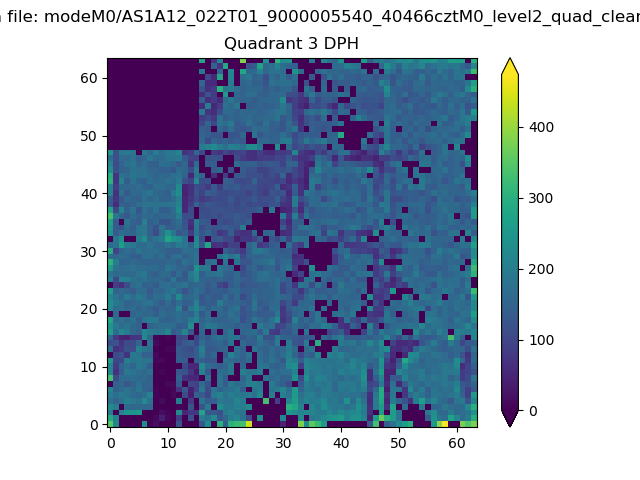 |
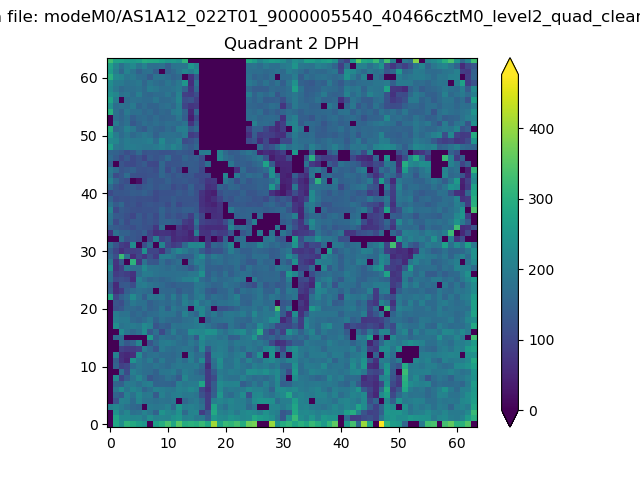 |
Quadrant C |
| Plot type | Count rate plots | Images |
|---|---|---|
| Comparison with Poisson distribution Blue bars denote a histogram of data divided into 1 sec bins. Red curve is a Poisson curve with rate = median count rate of data. |
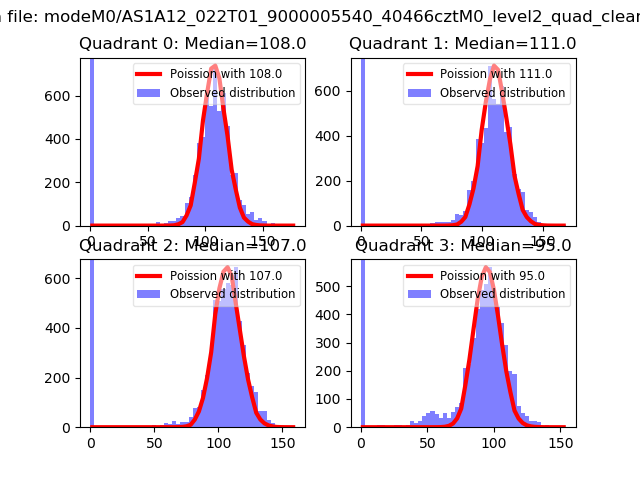 |
 |
| Quadrant-wise count rates Data is divided into 100 sec bins |
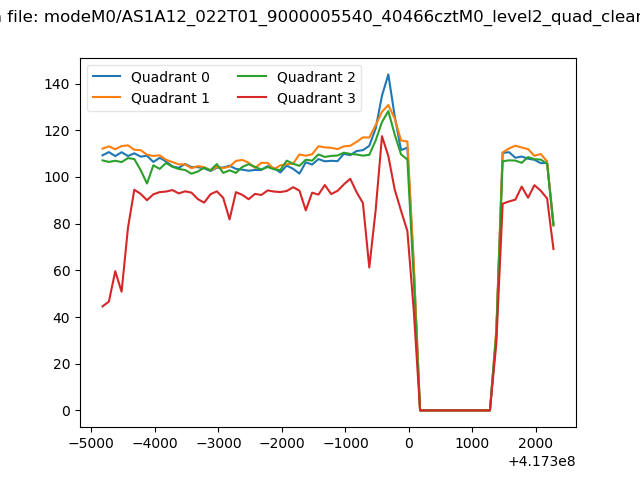 |
|
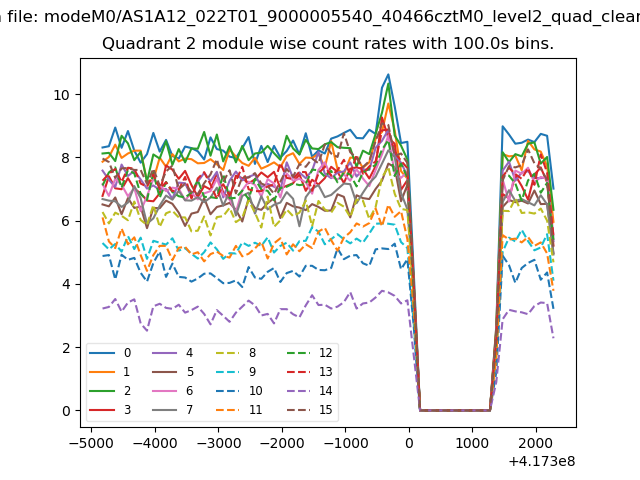
| Module-wise count rates for Quadrant A Data is divided into 100 sec bins |
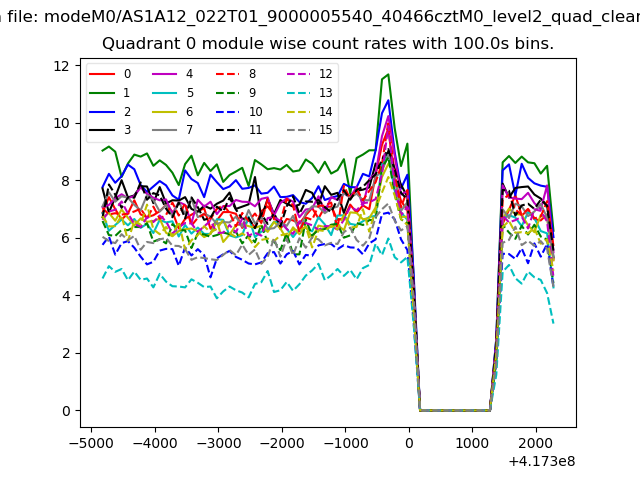 |
 |
| Module-wise count rates for Quadrant B Data is divided into 100 sec bins |
 |
 |
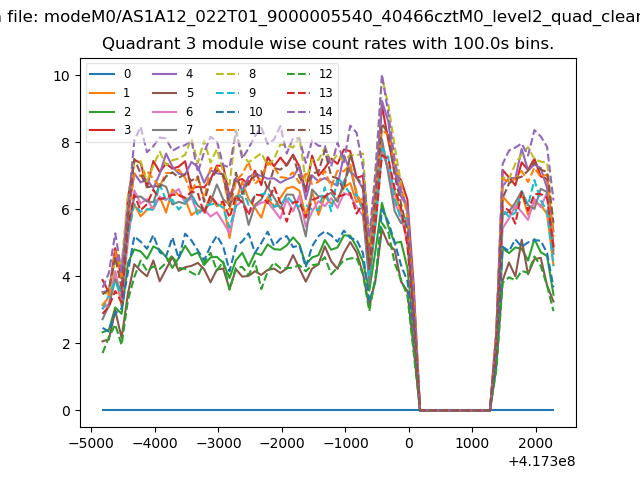
| Module-wise count rates for Quadrant C Data is divided into 100 sec bins |
 |
 |
| Module-wise count rates for Quadrant D Data is divided into 100 sec bins |
 |
 |
| Parameter | Plot |
|---|---|
| CZT HV Monitor |  |
| D_VDD | 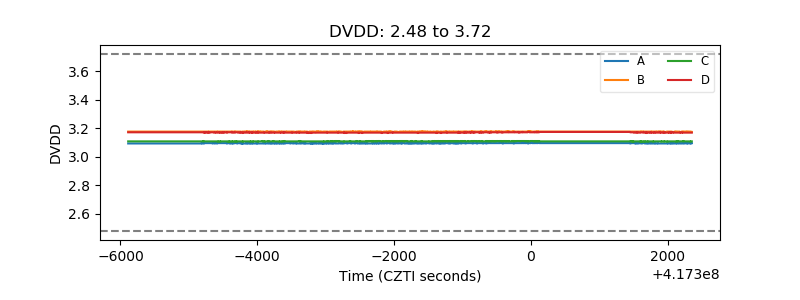 |
| Temperature 1 | 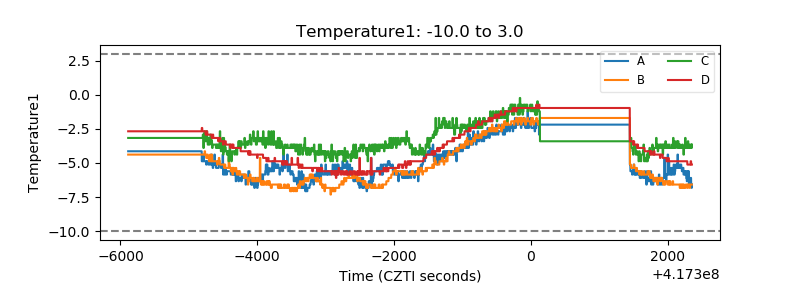 |
| Veto HV Monitor | 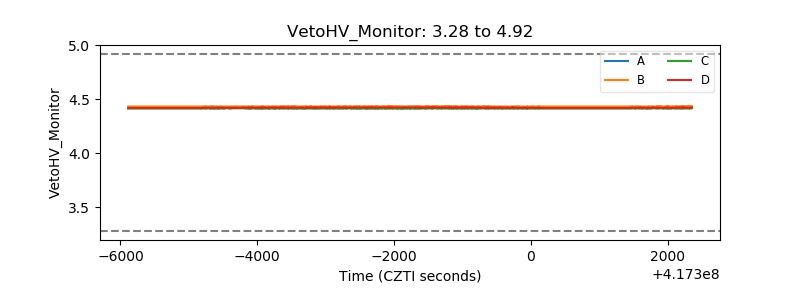 |
| Veto LLD | 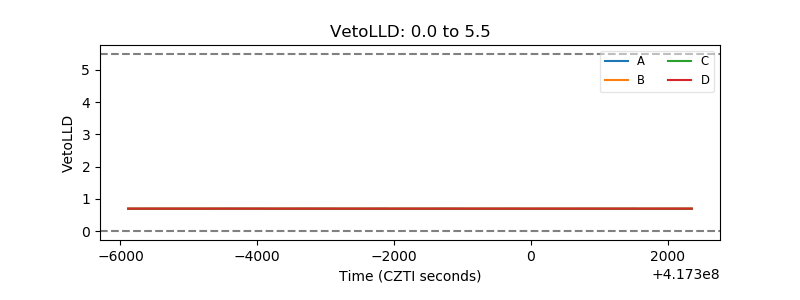 |
| Alpha Counter | 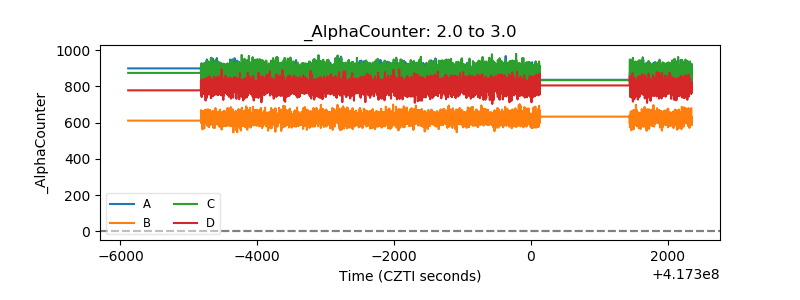 |
| _CPM_Rate | 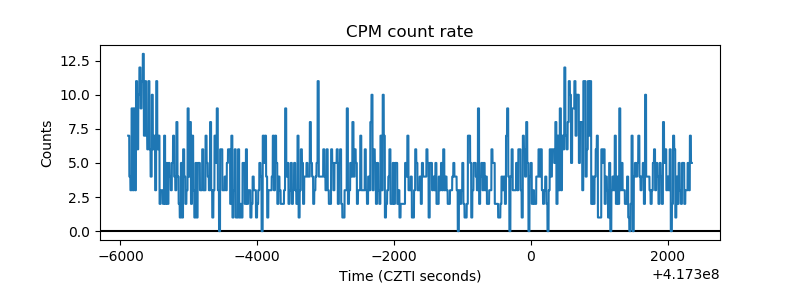 |
| CZT Counter | 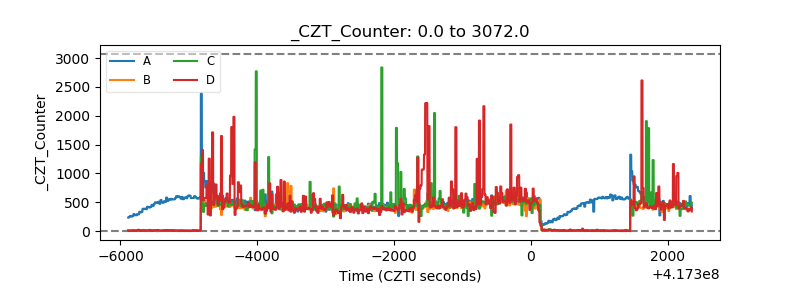 |
| +2.5 Volts monitor | 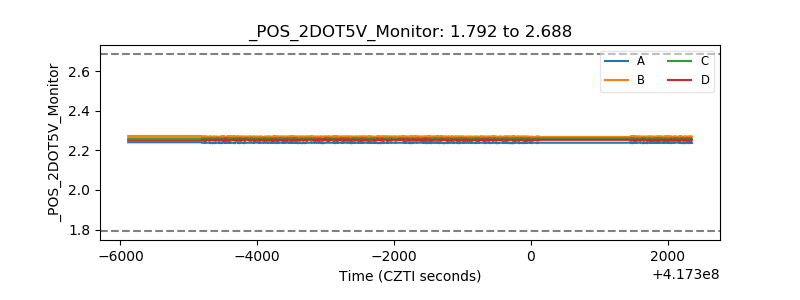 |
| +5 Volts monitor | 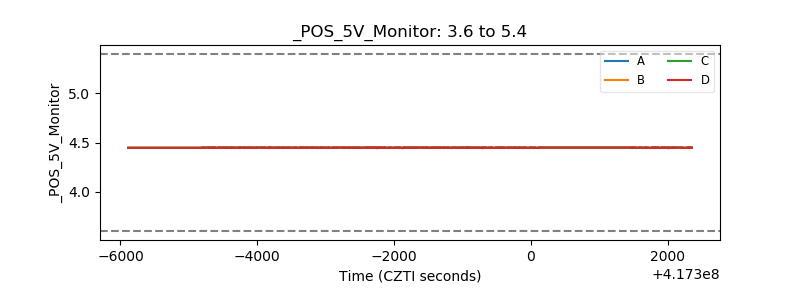 |
| _ROLL_ROT | 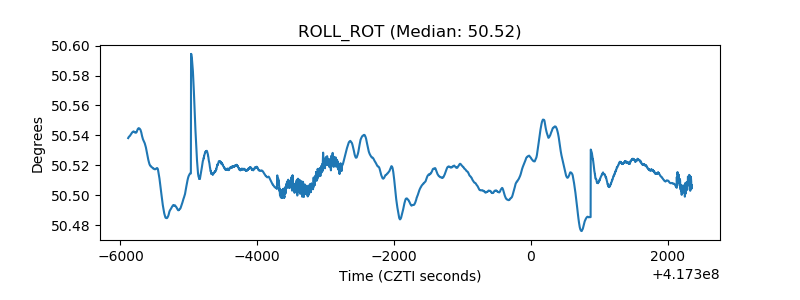 |
| _Roll_DEC | 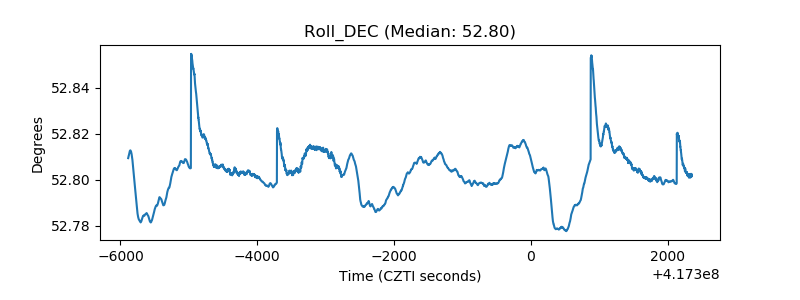 |
| _Roll_RA | 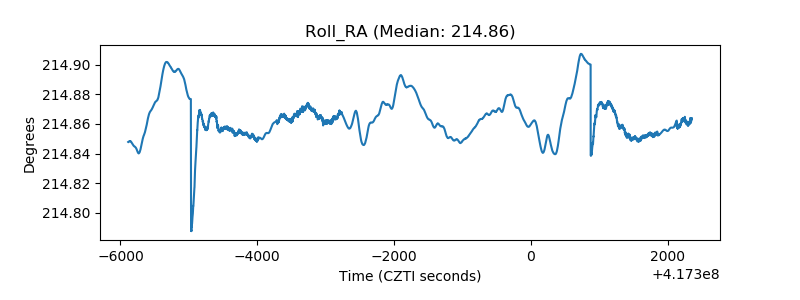 |
| Veto Counter | 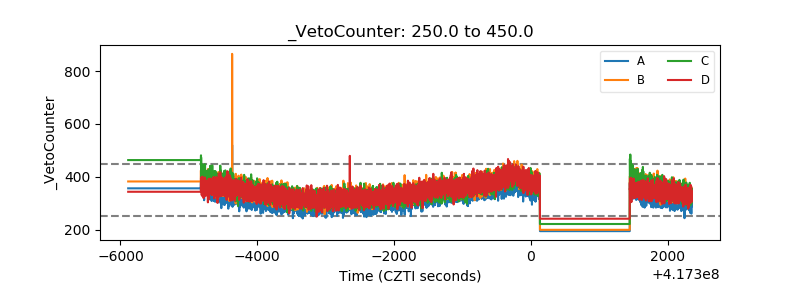 |