| Param | Original file | Final file |
|---|---|---|
| Filename | modeM0/AS1A12_022T01_9000005540_40469cztM0_level2.fits | modeM0/AS1A12_022T01_9000005540_40469cztM0_level2_quad_clean.evt |
| Size (bytes) | 890,570,880 | 244,716,480 |
| Size | 849.3 MB | 233.4 MB |
| Events in quadrant A | 7,770,843 | 1,662,973 |
| Events in quadrant B | 7,563,063 | 1,683,109 |
| Events in quadrant C | 8,186,674 | 1,635,302 |
| Events in quadrant D | 8,237,053 | 1,354,289 |
| Mode M0 | |||
|---|---|---|---|
| Quadrant | BADHDUFLAG | Total packets | Discarded packets |
| A | 0 | 33184 | 5 |
| B | 0 | 33896 | 4 |
| C | 0 | 34847 | 4 |
| D | 0 | 36055 | 4 |
| Mode M9 | |||
|---|---|---|---|
| Quadrant | BADHDUFLAG | Total packets | Discarded packets |
| A | 0 | 52 | 0 |
| B | 0 | 52 | 0 |
| C | 0 | 52 | 0 |
| D | 0 | 53 | 0 |
| Mode SS | |||
|---|---|---|---|
| Quadrant | BADHDUFLAG | Total packets | Discarded packets |
| A | 0 | 316 | 0 |
| B | 0 | 316 | 0 |
| C | 0 | 316 | 0 |
| D | 0 | 316 | 0 |
| Quadrant | Total seconds | Saturated seconds | Saturation percentage |
|---|---|---|---|
| A | 15562 | 32 | 0.205629% |
| B | 15562 | 194 | 1.246626% |
| C | 15562 | 191 | 1.227349% |
| D | 15562 | 1868 | 12.003599% |
Noise dominated data is calculated using 1-second bins in cleaned event files. If a bin has >2000 counts, and if more than 50% of those come from <1% of pixels, then it is considered to be noise-dominated and hence unusable.
| Quadrant | # 1 sec bins | Bins with >0 counts | Bins with >2000 counts | High rate bins dominated by noise | Noise dominated (total time) | Noise dominated (detector-on time) | Marked lightcurve |
|---|---|---|---|---|---|---|---|
| A | 19800 | 15565 | 10 | 10 | 0.05% | 0.06% |  |
| B | 19800 | 15565 | 137 | 137 | 0.69% | 0.88% | 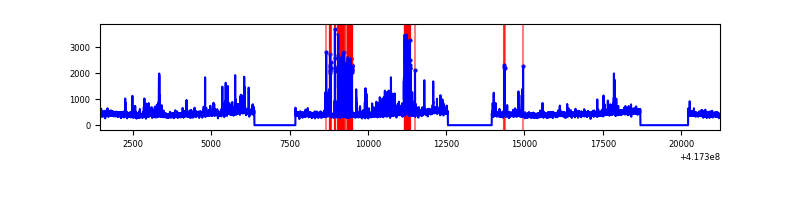 |
| C | 19800 | 15565 | 185 | 185 | 0.93% | 1.19% | 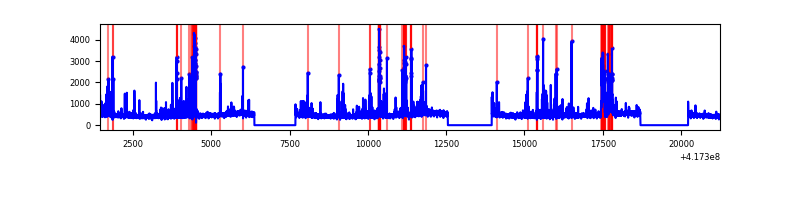 |
| D | 19800 | 15563 | 315 | 315 | 1.59% | 2.02% | 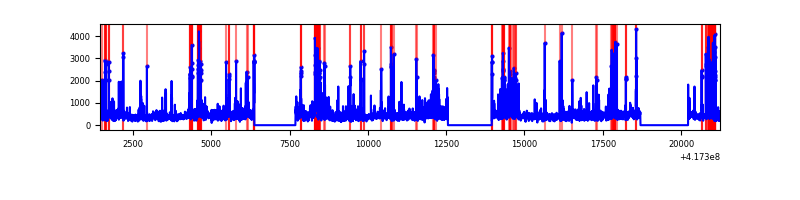 |
Top three noisy pixels from each quadrant. If the there are fewer than three noisy pixels in the level2.evt file, extra rows are filled as -1
| Pixel properties | Quadrant properties | ||||||
|---|---|---|---|---|---|---|---|
| Quadrant | DetID | PixID | Counts | Sigma | Mean | Median | Sigma |
| A | 10 | 83 | 1241199 | 3698.57 | 1651 | 1621 | 335.2 |
| A | 12 | 189 | 50971 | 147.25 | 1651 | 1621 | 335.2 |
| A | 7 | 3 | 26490 | 74.2 | 1651 | 1621 | 335.2 |
| B | 0 | 230 | 548896 | 1754.37 | 1635 | 1587 | 312.0 |
| B | 5 | 255 | 294824 | 939.95 | 1635 | 1587 | 312.0 |
| B | 4 | 170 | 204694 | 651.05 | 1635 | 1587 | 312.0 |
| C | 14 | 254 | 846145 | 2264.95 | 1605 | 1613 | 372.9 |
| C | 15 | 214 | 659802 | 1765.2 | 1605 | 1613 | 372.9 |
| C | 10 | 20 | 319136 | 851.56 | 1605 | 1613 | 372.9 |
| D | 13 | 171 | 748499 | 2047.87 | 1499 | 1456 | 364.8 |
| D | 12 | 128 | 573668 | 1568.61 | 1499 | 1456 | 364.8 |
| D | 12 | 191 | 463649 | 1267.01 | 1499 | 1456 | 364.8 |
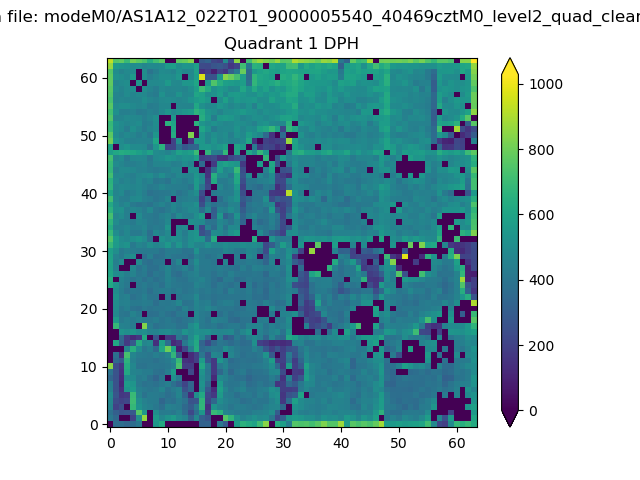
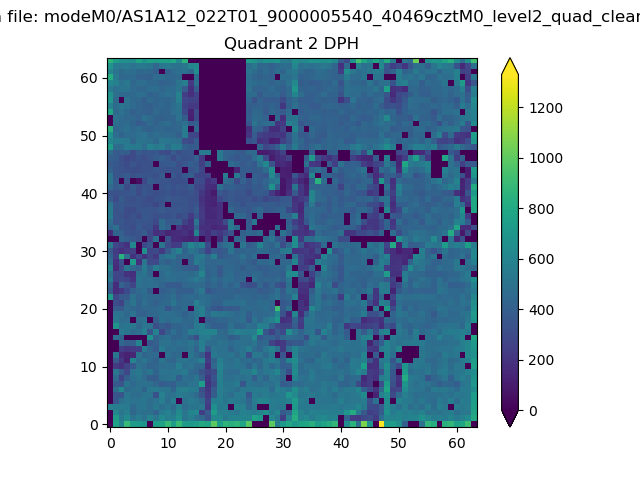
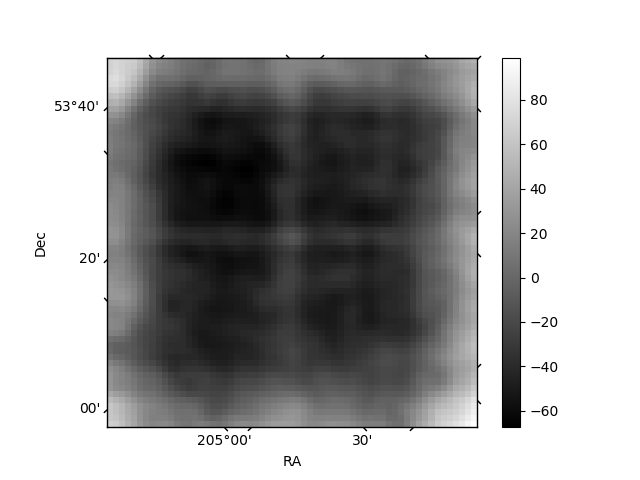
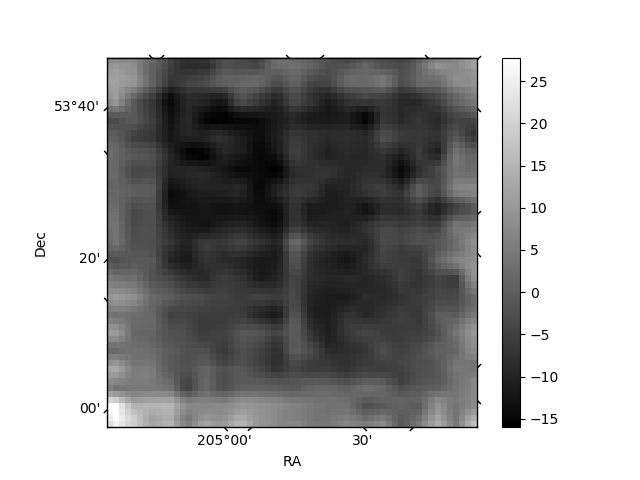
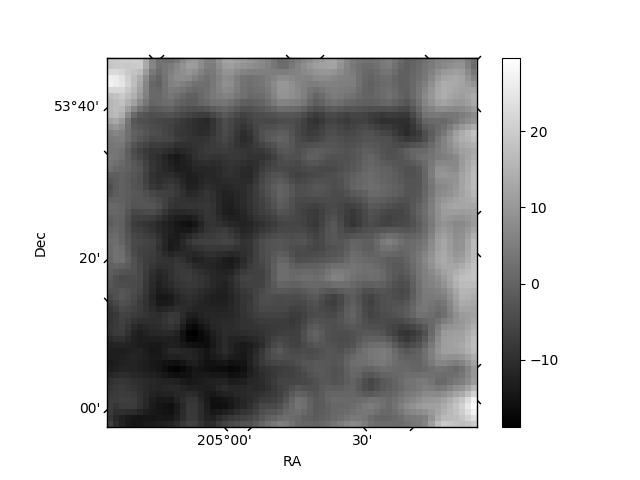
Histogram calculated using DETX and DETY for each event in the final _common_clean file
| Quadrant A | 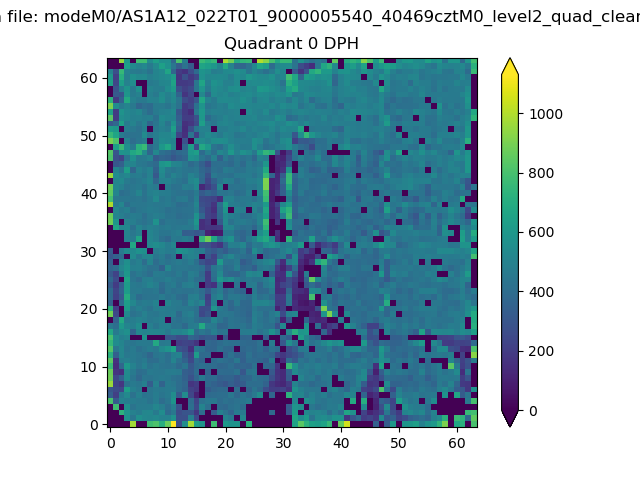 |
 |
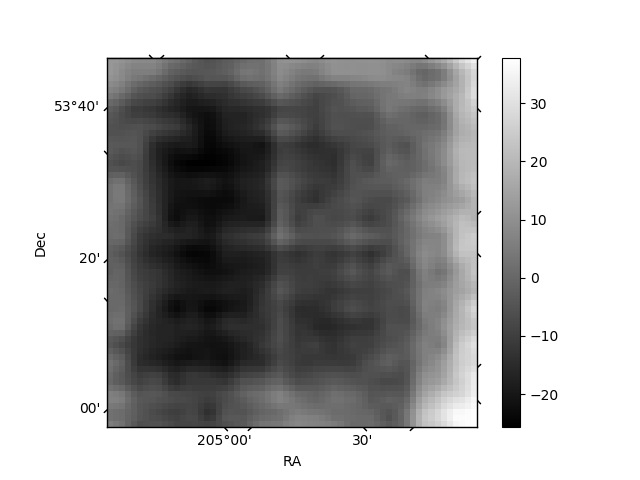
Quadrant B |
|---|---|---|---|
| Quadrant D | 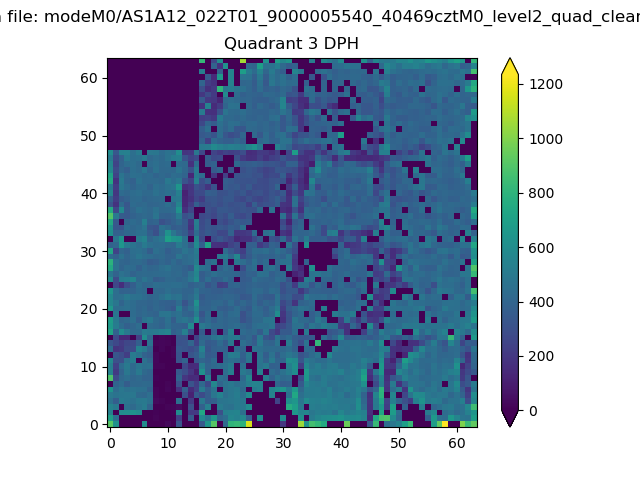 |
 |
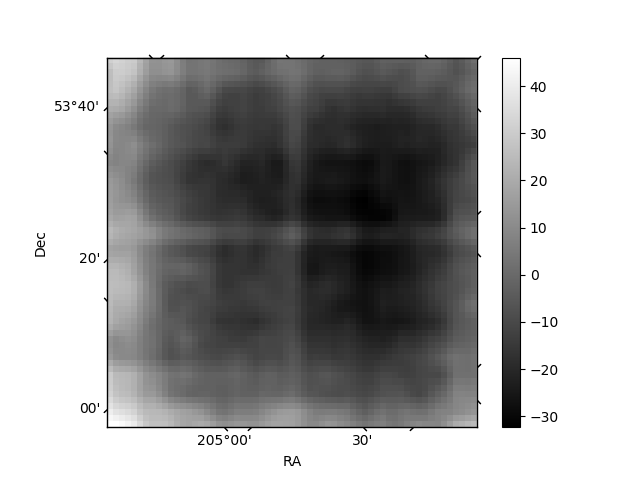
Quadrant C |
| Plot type | Count rate plots | Images |
|---|---|---|
| Comparison with Poisson distribution Blue bars denote a histogram of data divided into 1 sec bins. Red curve is a Poisson curve with rate = median count rate of data. |
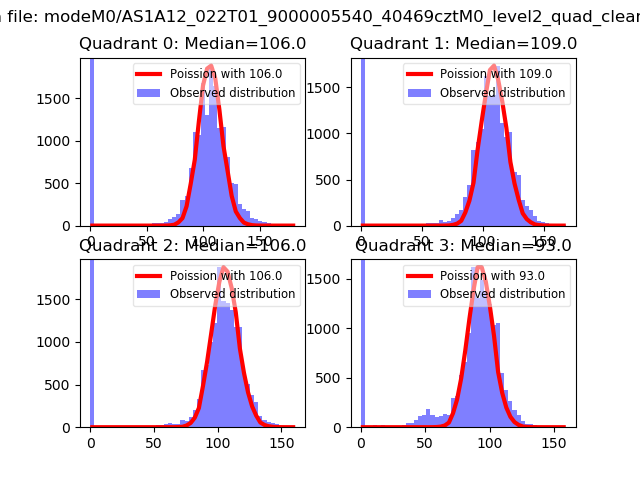 |
 |
| Quadrant-wise count rates Data is divided into 100 sec bins |
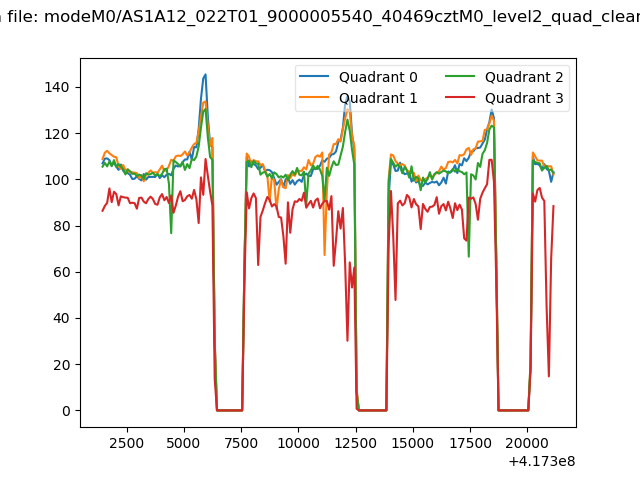 |
|
| Module-wise count rates for Quadrant A Data is divided into 100 sec bins |
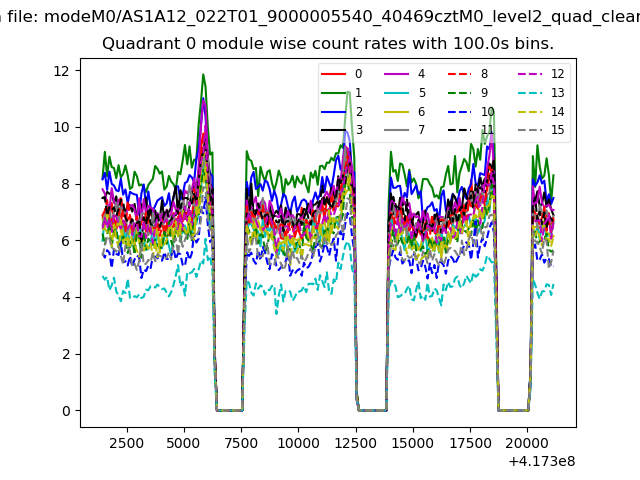 |
 |
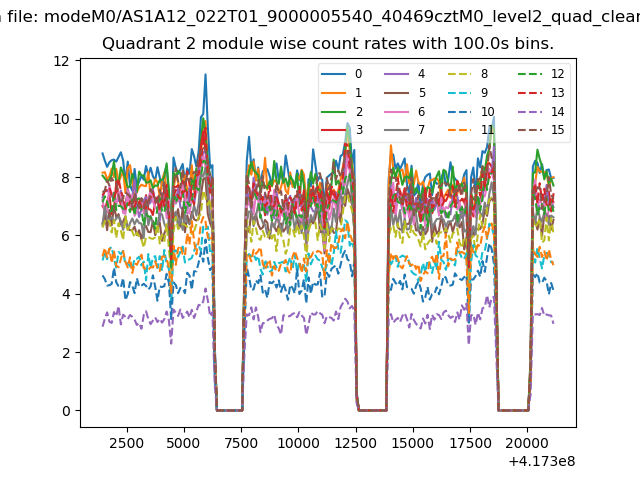
| Module-wise count rates for Quadrant B Data is divided into 100 sec bins |
 |
 |
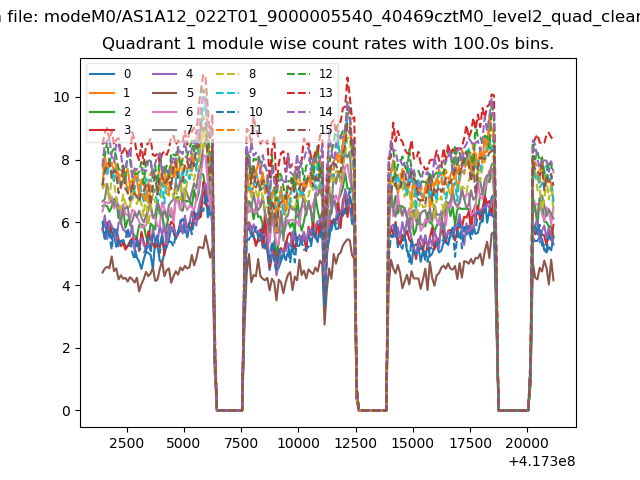
| Module-wise count rates for Quadrant C Data is divided into 100 sec bins |
 |
 |
| Module-wise count rates for Quadrant D Data is divided into 100 sec bins |
 |
 |
| Parameter | Plot |
|---|---|
| CZT HV Monitor | 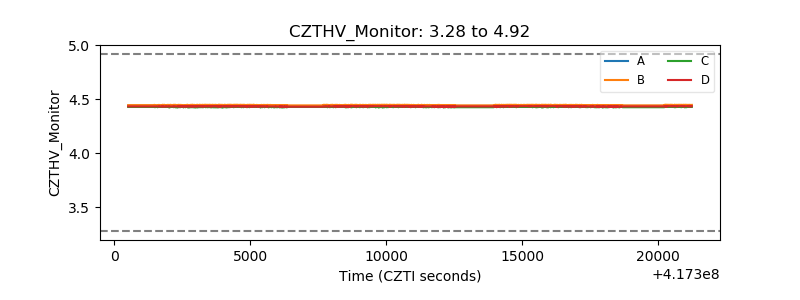 |
| D_VDD | 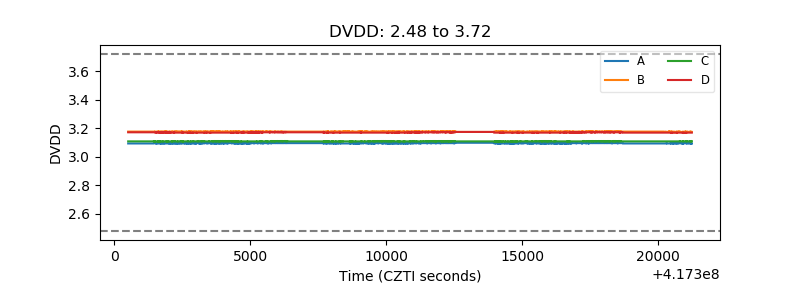 |
| Temperature 1 | 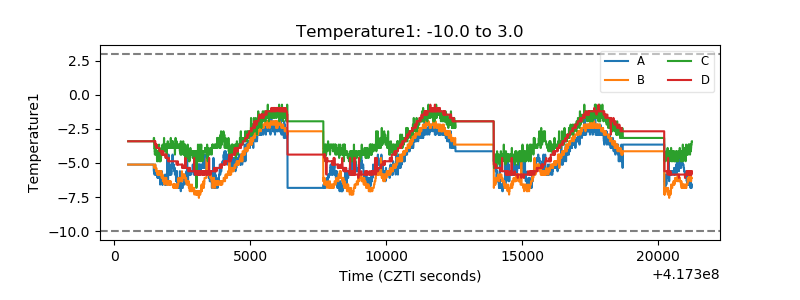 |
| Veto HV Monitor | 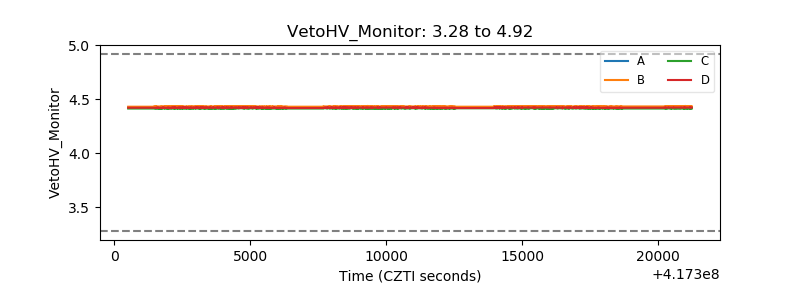 |
| Veto LLD | 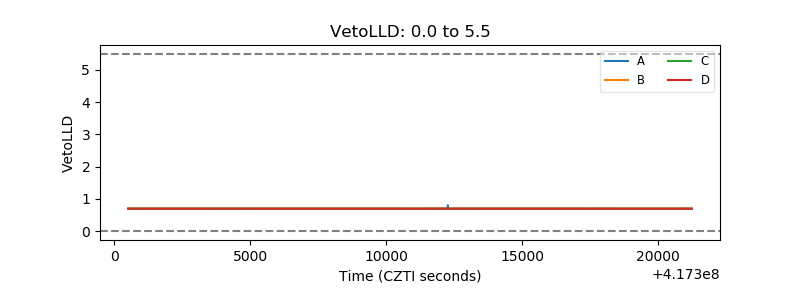 |
| Alpha Counter | 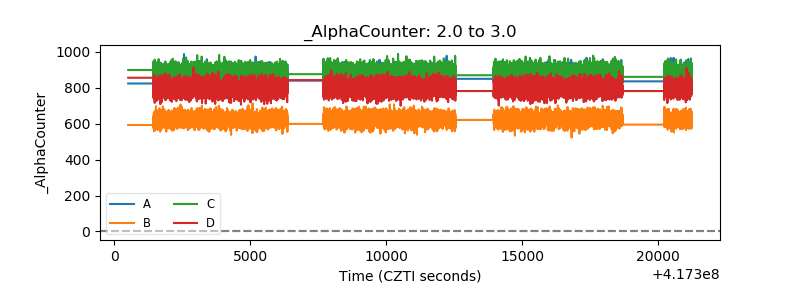 |
| _CPM_Rate | 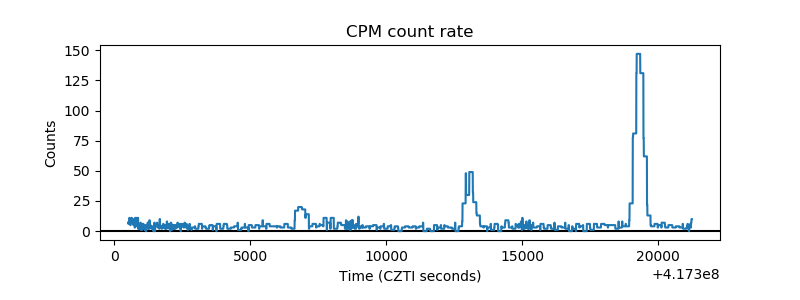 |
| CZT Counter | 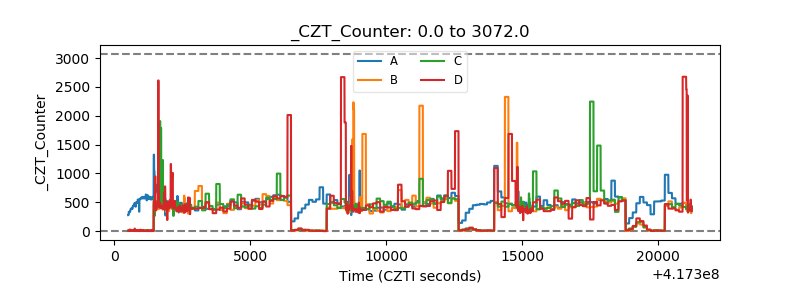 |
| +2.5 Volts monitor | 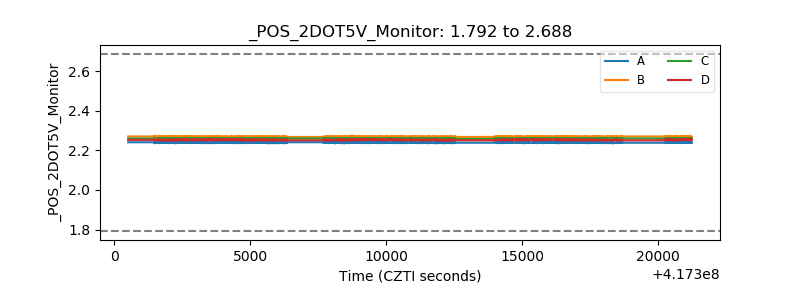 |
| +5 Volts monitor | 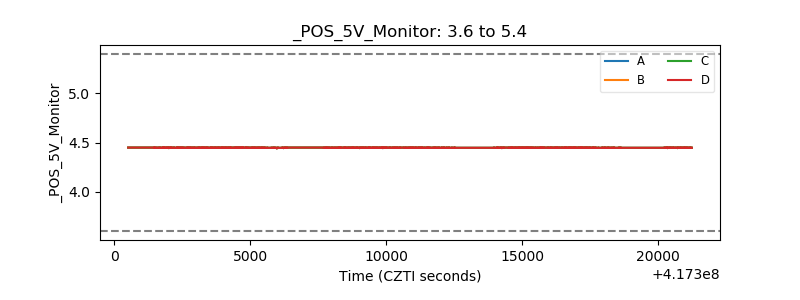 |
| _ROLL_ROT | 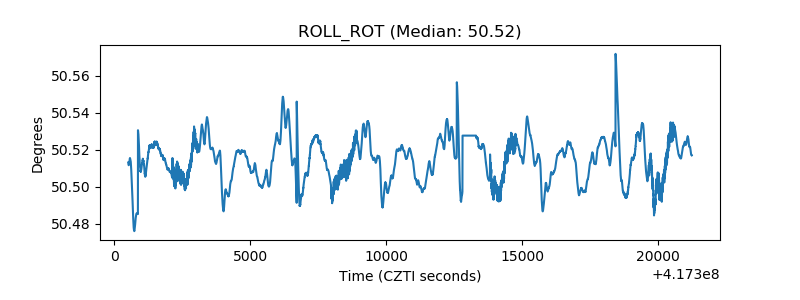 |
| _Roll_DEC | 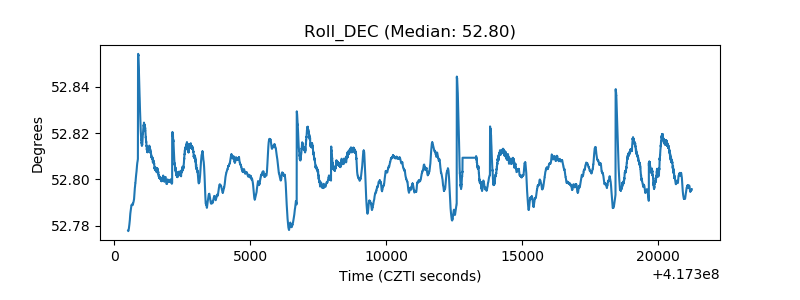 |
| _Roll_RA | 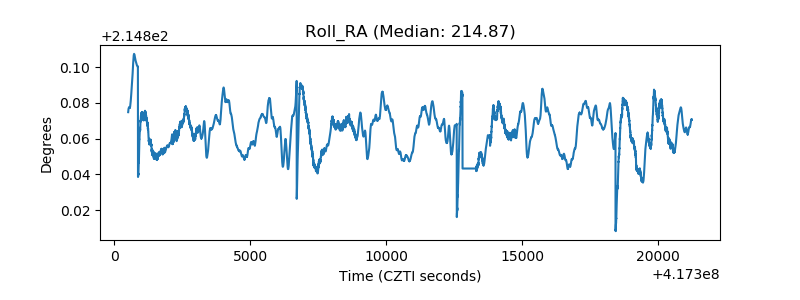 |
| Veto Counter | 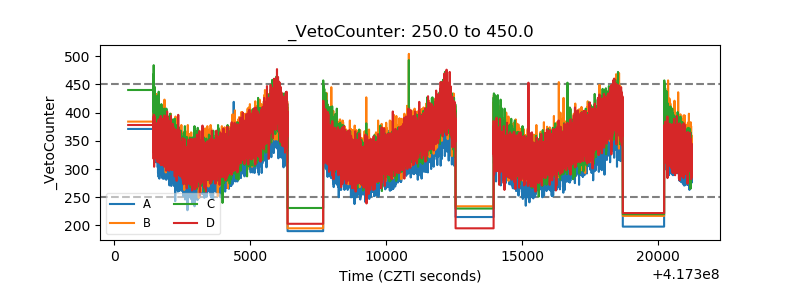 |