| Param | Original file | Final file |
|---|---|---|
| Filename | modeM0/AS1A12_022T01_9000005540_40470cztM0_level2.fits | modeM0/AS1A12_022T01_9000005540_40470cztM0_level2_quad_clean.evt |
| Size (bytes) | 320,492,160 | 89,752,320 |
| Size | 305.6 MB | 85.6 MB |
| Events in quadrant A | 2,851,674 | 608,719 |
| Events in quadrant B | 2,449,923 | 622,166 |
| Events in quadrant C | 2,723,654 | 598,820 |
| Events in quadrant D | 3,399,210 | 494,517 |
| Mode M0 | |||
|---|---|---|---|
| Quadrant | BADHDUFLAG | Total packets | Discarded packets |
| A | 0 | 11939 | 3 |
| B | 0 | 11330 | 2 |
| C | 0 | 11798 | 2 |
| D | 0 | 14233 | 2 |
| Mode M9 | |||
|---|---|---|---|
| Quadrant | BADHDUFLAG | Total packets | Discarded packets |
| A | 0 | 32 | 0 |
| B | 0 | 32 | 0 |
| C | 0 | 32 | 0 |
| D | 0 | 32 | 0 |
| Mode SS | |||
|---|---|---|---|
| Quadrant | BADHDUFLAG | Total packets | Discarded packets |
| A | 0 | 116 | 0 |
| B | 0 | 116 | 0 |
| C | 0 | 116 | 0 |
| D | 0 | 116 | 0 |
| Quadrant | Total seconds | Saturated seconds | Saturation percentage |
|---|---|---|---|
| A | 5623 | 7 | 0.124489% |
| B | 5623 | 7 | 0.124489% |
| C | 5623 | 14 | 0.248977% |
| D | 5623 | 710 | 12.626712% |
Noise dominated data is calculated using 1-second bins in cleaned event files. If a bin has >2000 counts, and if more than 50% of those come from <1% of pixels, then it is considered to be noise-dominated and hence unusable.
| Quadrant | # 1 sec bins | Bins with >0 counts | Bins with >2000 counts | High rate bins dominated by noise | Noise dominated (total time) | Noise dominated (detector-on time) | Marked lightcurve |
|---|---|---|---|---|---|---|---|
| A | 8790 | 5625 | 3 | 3 | 0.03% | 0.05% | 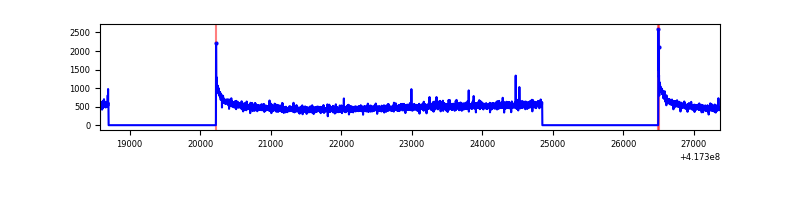 |
| B | 8790 | 5625 | 2 | 2 | 0.02% | 0.04% | 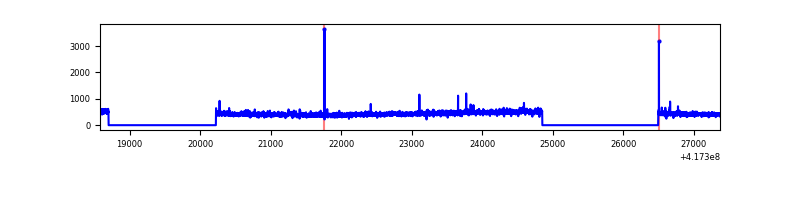 |
| C | 8790 | 5625 | 16 | 16 | 0.18% | 0.28% | 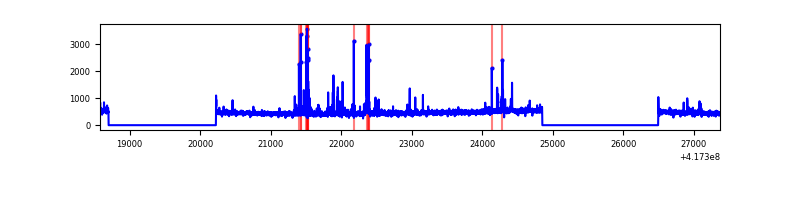 |
| D | 8790 | 5625 | 207 | 207 | 2.35% | 3.68% | 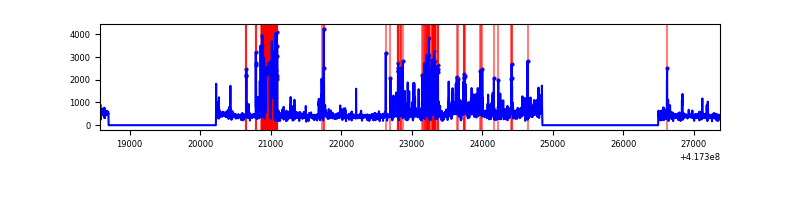 |
Top three noisy pixels from each quadrant. If the there are fewer than three noisy pixels in the level2.evt file, extra rows are filled as -1
| Pixel properties | Quadrant properties | ||||||
|---|---|---|---|---|---|---|---|
| Quadrant | DetID | PixID | Counts | Sigma | Mean | Median | Sigma |
| A | 10 | 83 | 504868 | 4131.2 | 600 | 588 | 122.1 |
| A | 3 | 1 | 13432 | 105.22 | 600 | 588 | 122.1 |
| A | 3 | 137 | 6730 | 50.31 | 600 | 588 | 122.1 |
| B | 0 | 230 | 32412 | 274.52 | 597 | 581 | 116.0 |
| B | 3 | 112 | 27531 | 232.43 | 597 | 581 | 116.0 |
| B | 5 | 255 | 18804 | 157.16 | 597 | 581 | 116.0 |
| C | 15 | 214 | 242923 | 1768.5 | 586 | 589 | 137.0 |
| C | 14 | 254 | 159927 | 1162.81 | 586 | 589 | 137.0 |
| C | 10 | 20 | 23402 | 166.48 | 586 | 589 | 137.0 |
| D | 2 | 250 | 508272 | 3756.08 | 546 | 529 | 135.2 |
| D | 13 | 171 | 464841 | 3434.79 | 546 | 529 | 135.2 |
| D | 12 | 191 | 154945 | 1142.31 | 546 | 529 | 135.2 |
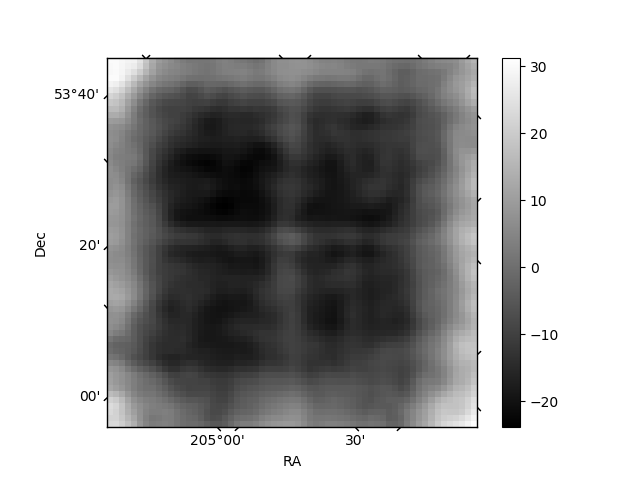
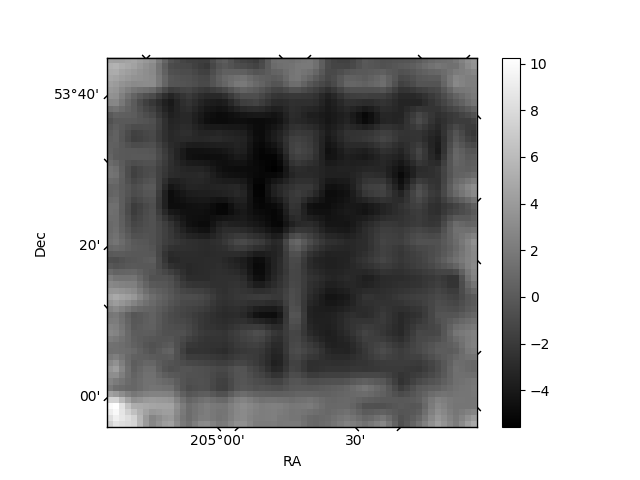
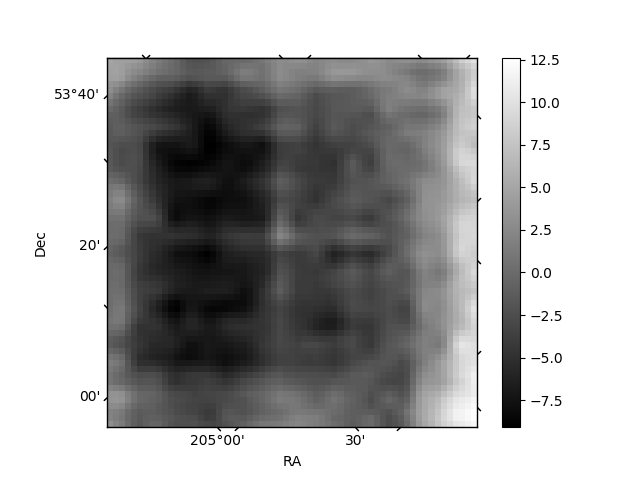
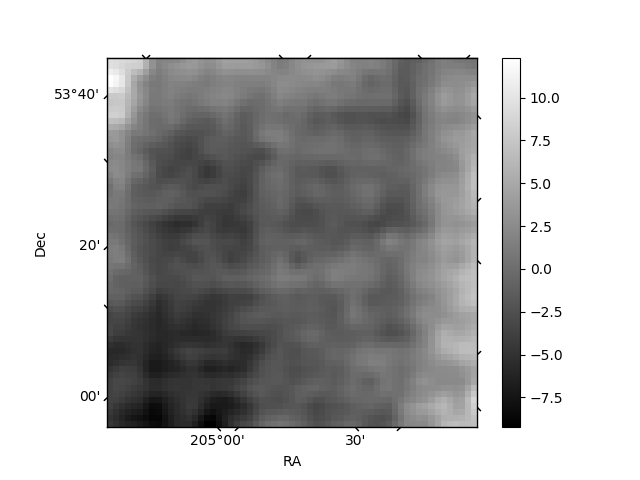
Histogram calculated using DETX and DETY for each event in the final _common_clean file
| Quadrant A | 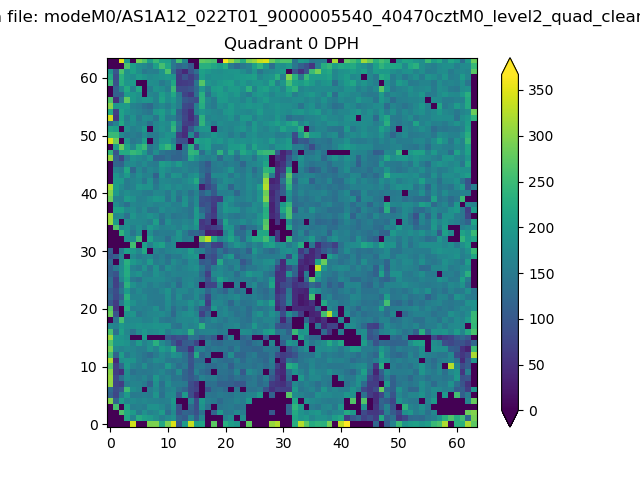 |
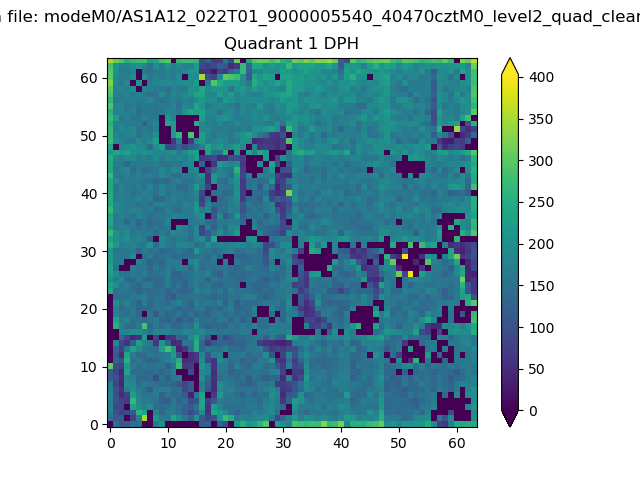 |
Quadrant B |
|---|---|---|---|
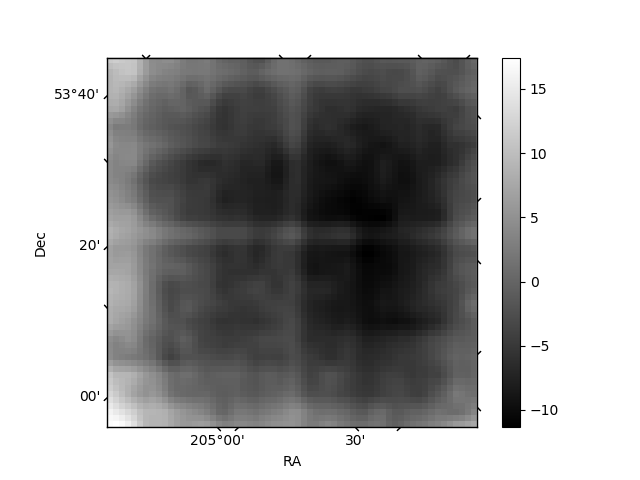
| Quadrant D | 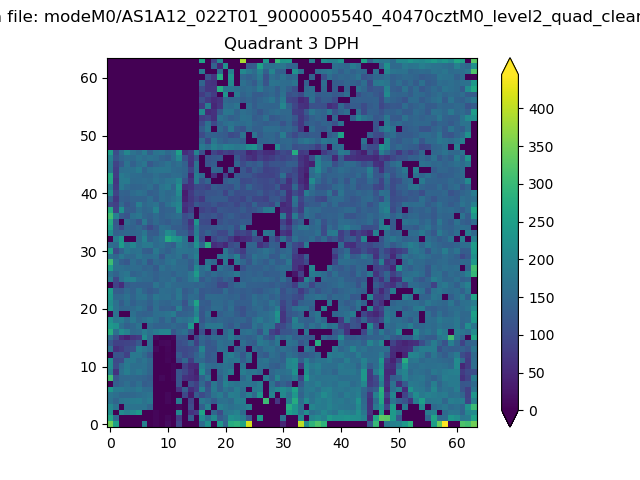 |
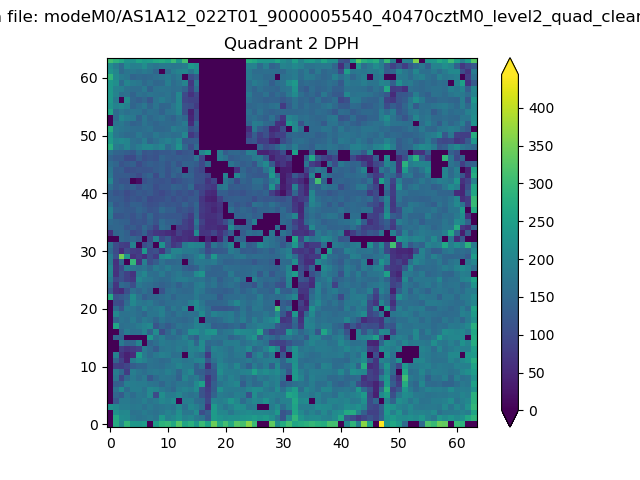 |
Quadrant C |
| Plot type | Count rate plots | Images |
|---|---|---|
| Comparison with Poisson distribution Blue bars denote a histogram of data divided into 1 sec bins. Red curve is a Poisson curve with rate = median count rate of data. |
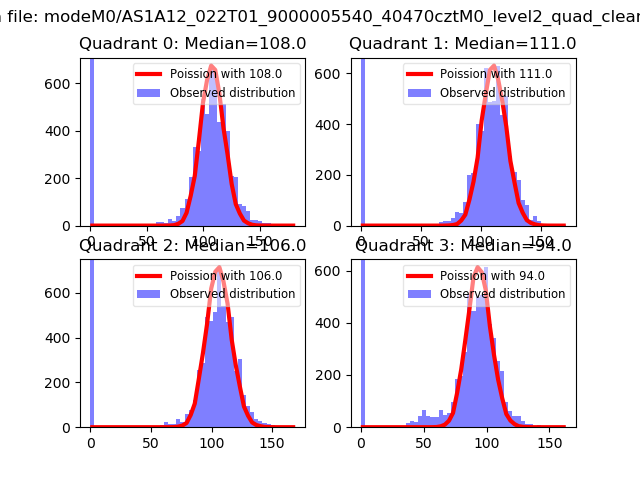 |
 |
| Quadrant-wise count rates Data is divided into 100 sec bins |
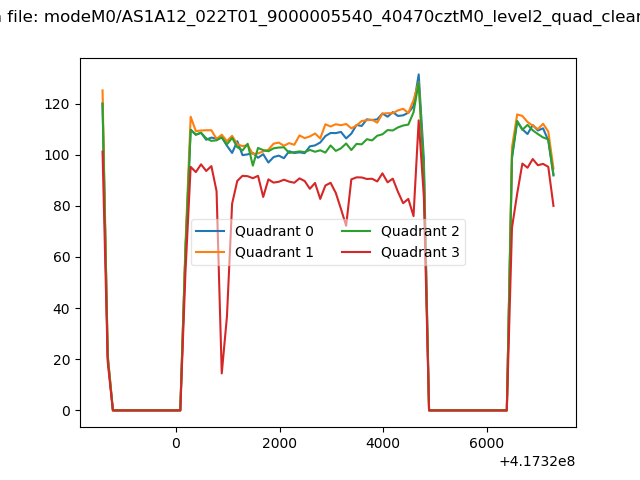 |
|
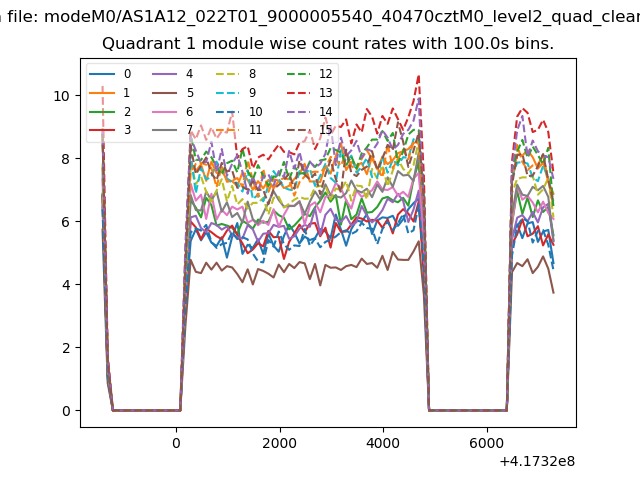
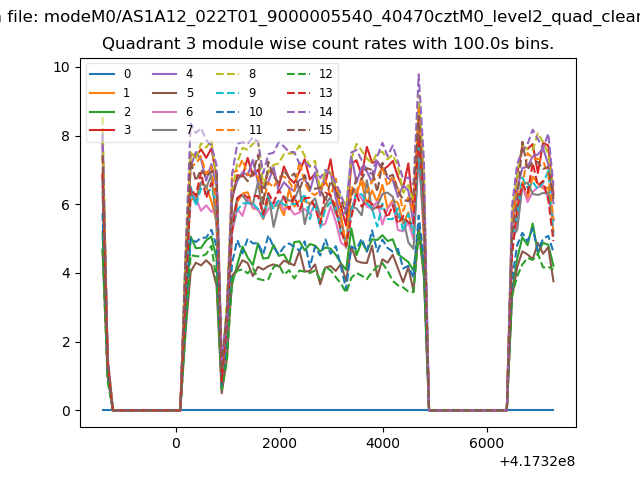
| Module-wise count rates for Quadrant A Data is divided into 100 sec bins |
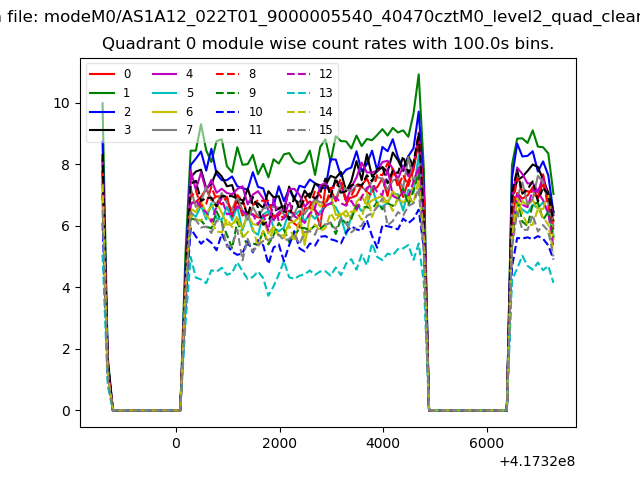 |
 |
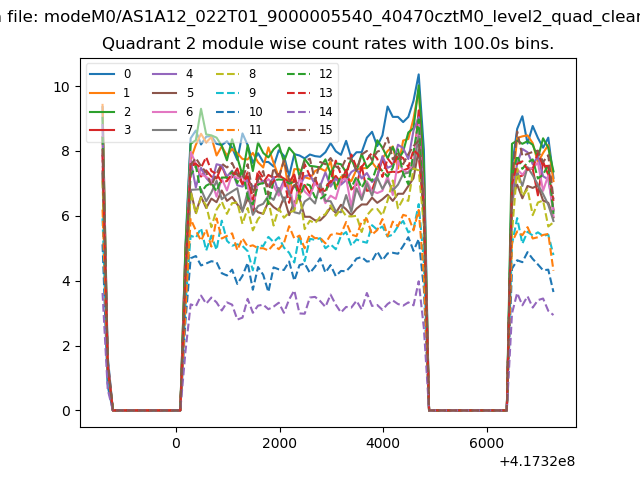
| Module-wise count rates for Quadrant B Data is divided into 100 sec bins |
 |
 |
| Module-wise count rates for Quadrant C Data is divided into 100 sec bins |
 |
 |
| Module-wise count rates for Quadrant D Data is divided into 100 sec bins |
 |
 |
| Parameter | Plot |
|---|---|
| CZT HV Monitor | 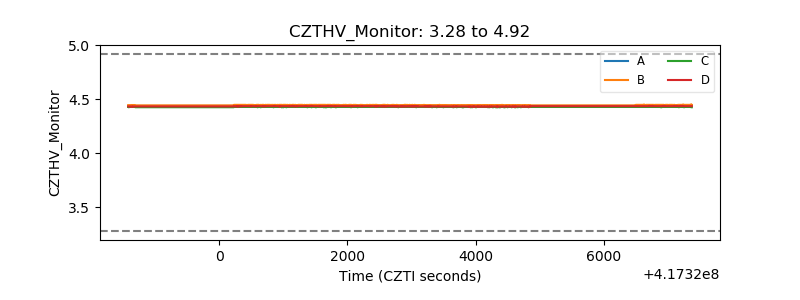 |
| D_VDD | 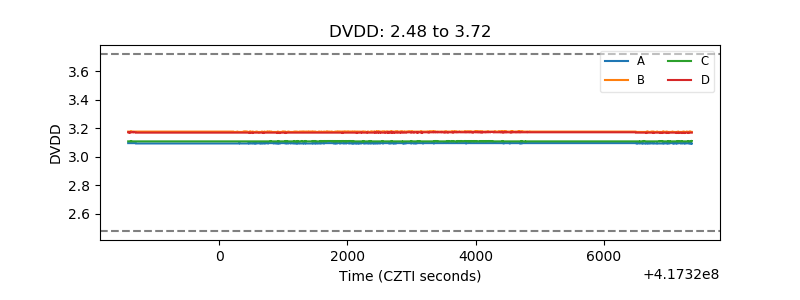 |
| Temperature 1 | 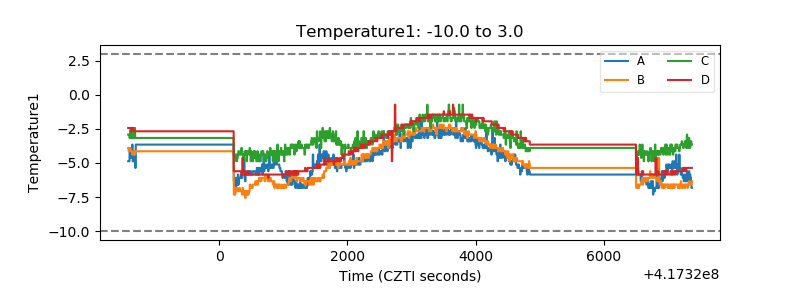 |
| Veto HV Monitor | 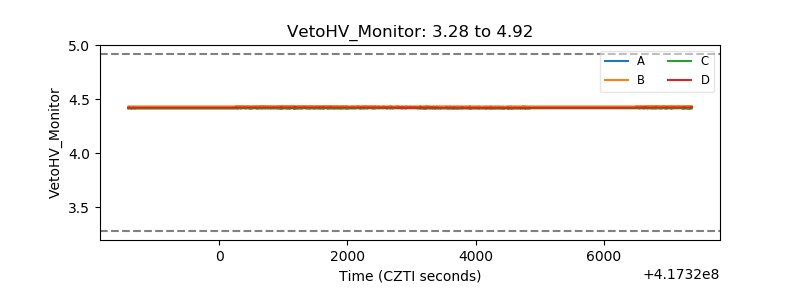 |
| Veto LLD | 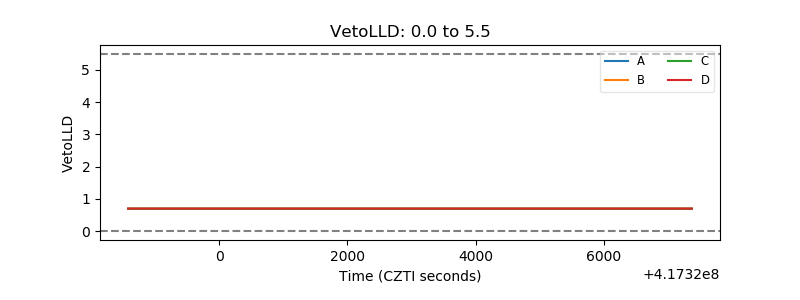 |
| Alpha Counter | 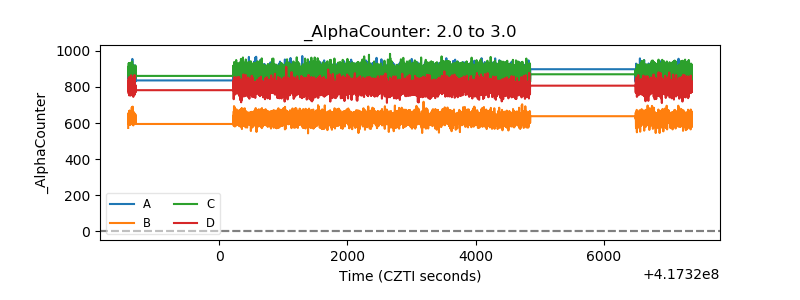 |
| _CPM_Rate | 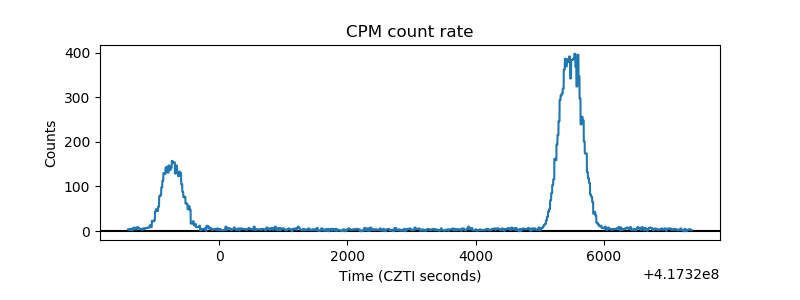 |
| CZT Counter | 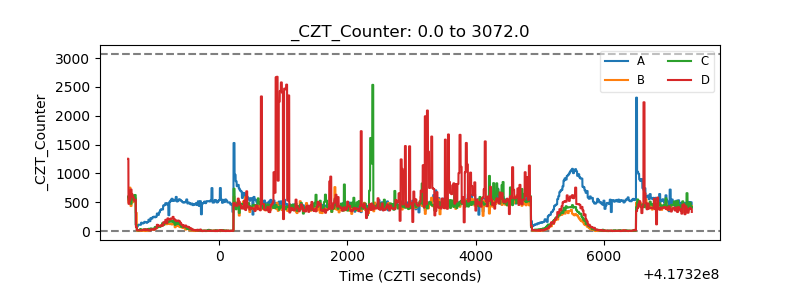 |
| +2.5 Volts monitor | 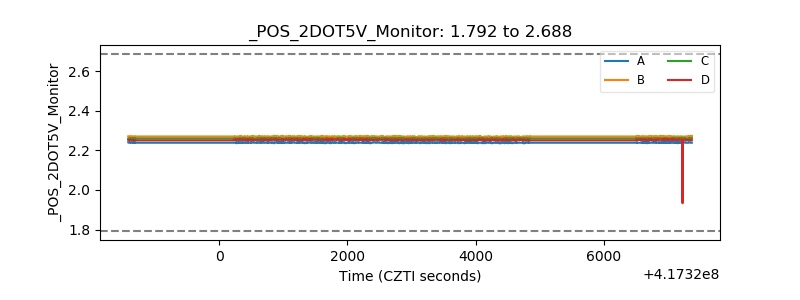 |
| +5 Volts monitor | 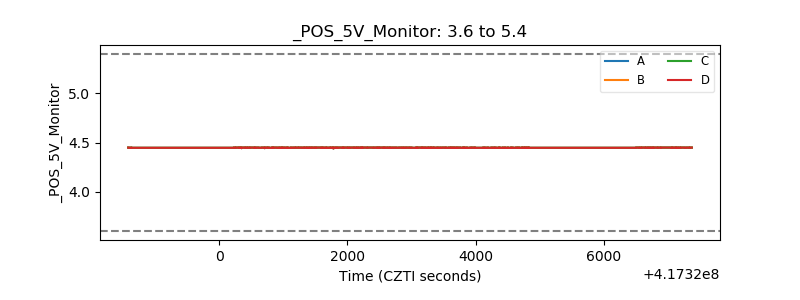 |
| _ROLL_ROT | 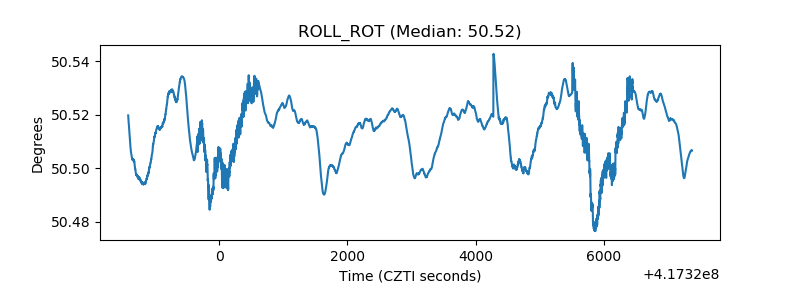 |
| _Roll_DEC | 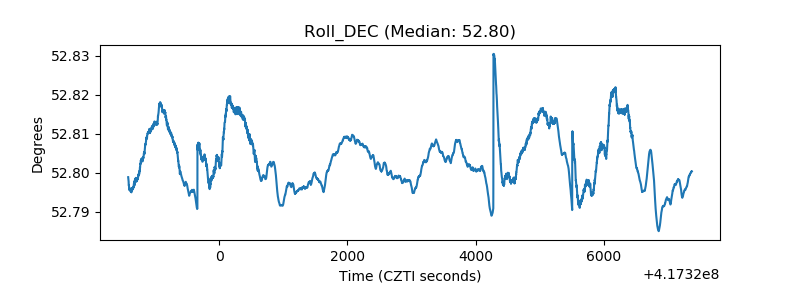 |
| _Roll_RA | 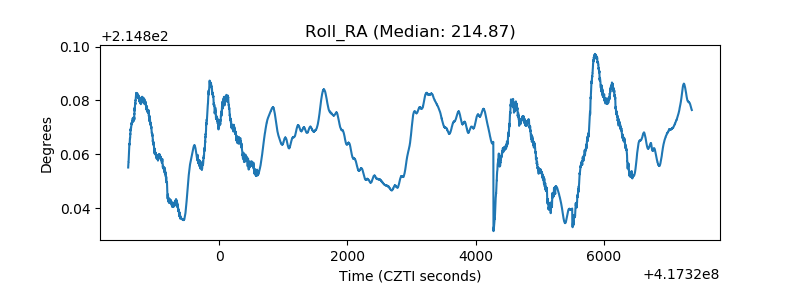 |
| Veto Counter |  |