| Param | Original file | Final file |
|---|---|---|
| Filename | modeM0/AS1A12_022T01_9000005540_40472cztM0_level2.fits | modeM0/AS1A12_022T01_9000005540_40472cztM0_level2_quad_clean.evt |
| Size (bytes) | 289,117,440 | 88,629,120 |
| Size | 275.7 MB | 84.5 MB |
| Events in quadrant A | 2,775,856 | 597,895 |
| Events in quadrant B | 2,365,789 | 613,573 |
| Events in quadrant C | 2,631,871 | 584,522 |
| Events in quadrant D | 2,503,302 | 506,214 |
| Mode M0 | |||
|---|---|---|---|
| Quadrant | BADHDUFLAG | Total packets | Discarded packets |
| A | 0 | 11617 | 3 |
| B | 0 | 10989 | 2 |
| C | 0 | 11337 | 2 |
| D | 0 | 11423 | 2 |
| Mode M9 | |||
|---|---|---|---|
| Quadrant | BADHDUFLAG | Total packets | Discarded packets |
| A | 0 | 27 | 0 |
| B | 0 | 27 | 0 |
| C | 0 | 27 | 0 |
| D | 0 | 28 | 0 |
| Mode SS | |||
|---|---|---|---|
| Quadrant | BADHDUFLAG | Total packets | Discarded packets |
| A | 0 | 112 | 0 |
| B | 0 | 112 | 0 |
| C | 0 | 112 | 0 |
| D | 0 | 112 | 0 |
| Quadrant | Total seconds | Saturated seconds | Saturation percentage |
|---|---|---|---|
| A | 5446 | 12 | 0.220345% |
| B | 5446 | 11 | 0.201983% |
| C | 5446 | 17 | 0.312156% |
| D | 5446 | 367 | 6.738891% |
Noise dominated data is calculated using 1-second bins in cleaned event files. If a bin has >2000 counts, and if more than 50% of those come from <1% of pixels, then it is considered to be noise-dominated and hence unusable.
| Quadrant | # 1 sec bins | Bins with >0 counts | Bins with >2000 counts | High rate bins dominated by noise | Noise dominated (total time) | Noise dominated (detector-on time) | Marked lightcurve |
|---|---|---|---|---|---|---|---|
| A | 7239 | 5447 | 3 | 3 | 0.04% | 0.06% | 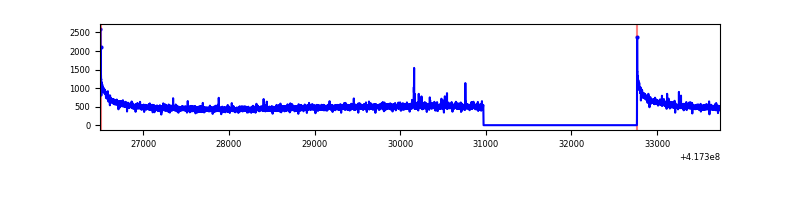 |
| B | 7239 | 5447 | 2 | 2 | 0.03% | 0.04% | 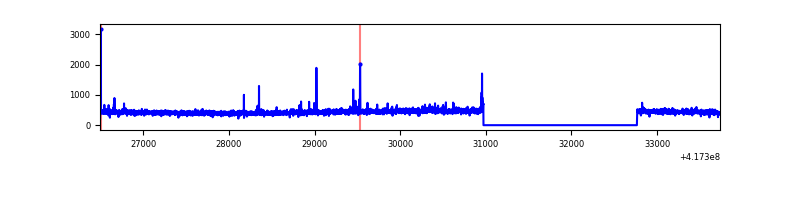 |
| C | 7239 | 5447 | 16 | 16 | 0.22% | 0.29% | 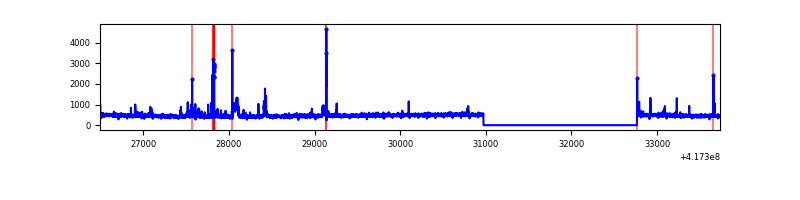 |
| D | 7239 | 5447 | 20 | 20 | 0.28% | 0.37% | 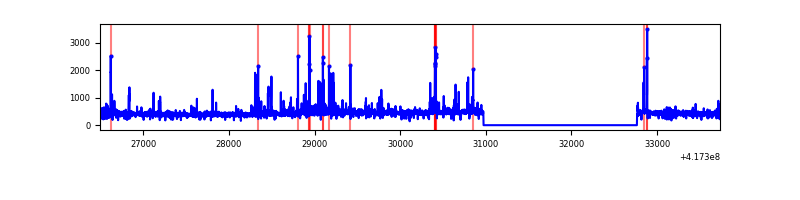 |
Top three noisy pixels from each quadrant. If the there are fewer than three noisy pixels in the level2.evt file, extra rows are filled as -1
| Pixel properties | Quadrant properties | ||||||
|---|---|---|---|---|---|---|---|
| Quadrant | DetID | PixID | Counts | Sigma | Mean | Median | Sigma |
| A | 10 | 83 | 477842 | 3995.07 | 587 | 575 | 119.5 |
| A | 3 | 1 | 12020 | 95.8 | 587 | 575 | 119.5 |
| A | 13 | 6 | 8423 | 65.69 | 587 | 575 | 119.5 |
| B | 3 | 112 | 26197 | 225.47 | 583 | 566 | 113.7 |
| B | 0 | 229 | 25955 | 223.34 | 583 | 566 | 113.7 |
| B | 12 | 111 | 14528 | 122.82 | 583 | 566 | 113.7 |
| C | 15 | 214 | 238092 | 1795.93 | 568 | 571 | 132.3 |
| C | 14 | 254 | 97255 | 731.04 | 568 | 571 | 132.3 |
| C | 10 | 20 | 68436 | 513.14 | 568 | 571 | 132.3 |
| D | 12 | 191 | 148538 | 1093.43 | 549 | 532 | 135.4 |
| D | 12 | 128 | 105527 | 775.68 | 549 | 532 | 135.4 |
| D | 2 | 250 | 75207 | 551.68 | 549 | 532 | 135.4 |
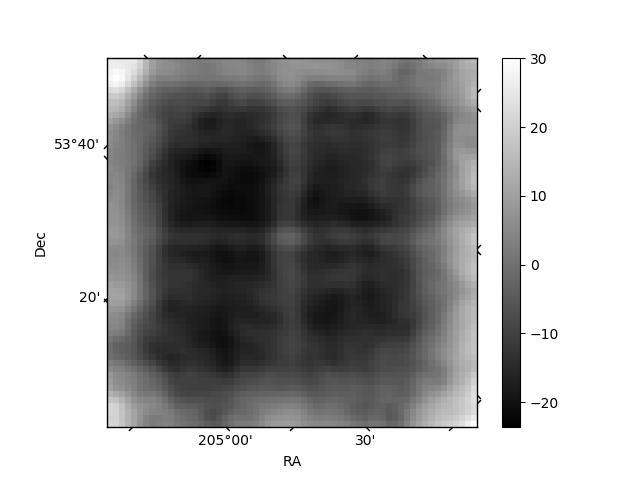
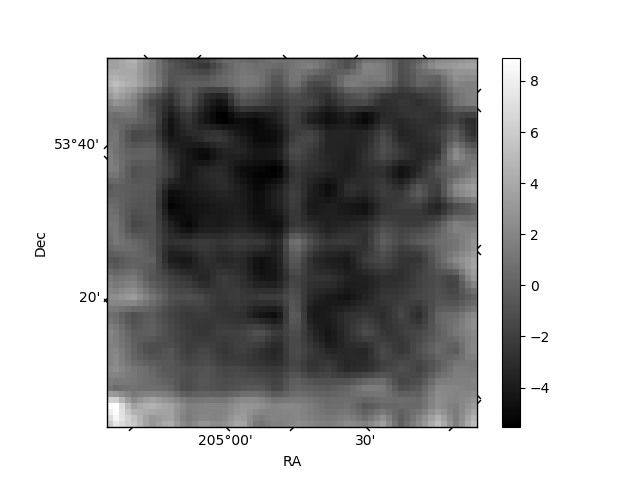
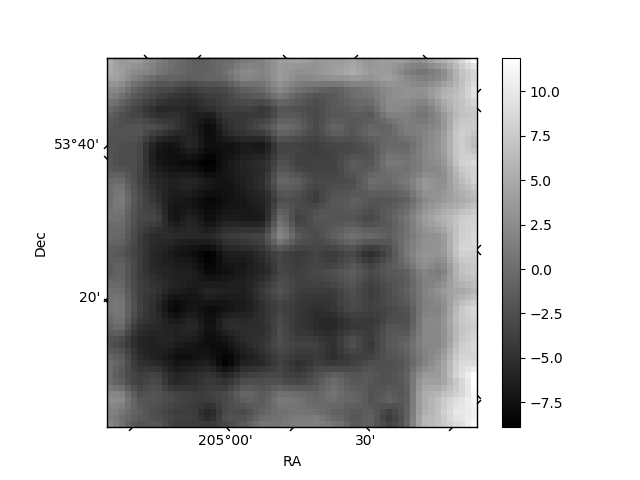
Histogram calculated using DETX and DETY for each event in the final _common_clean file
| Quadrant A | 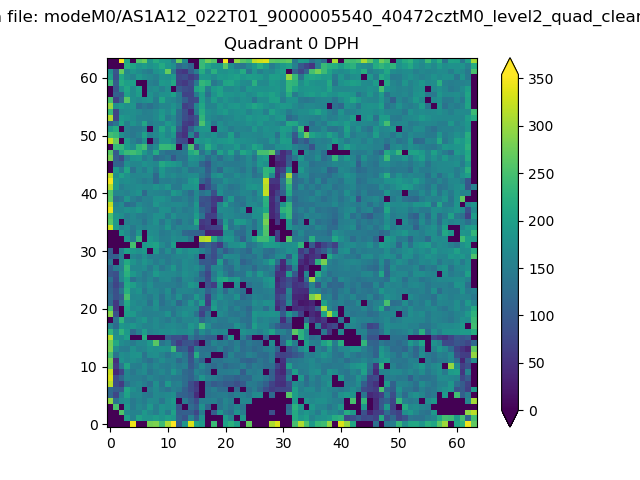 |
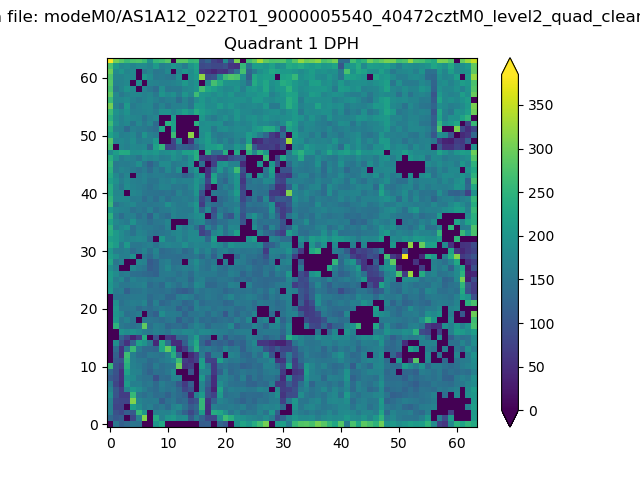 |
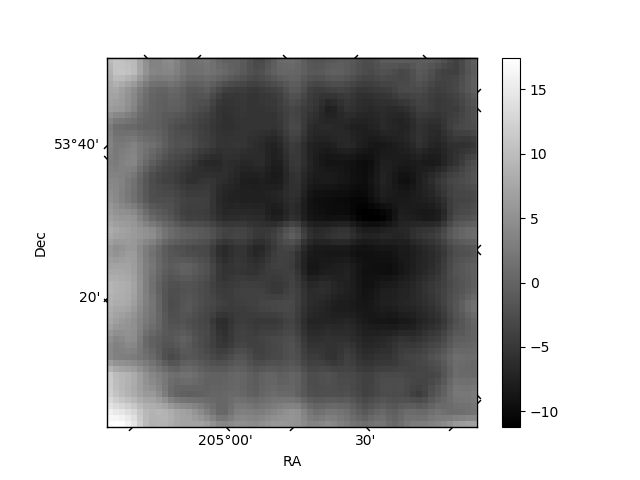
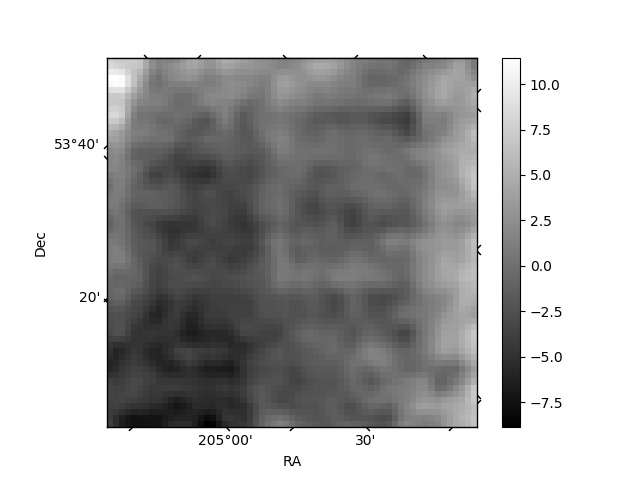
Quadrant B |
|---|---|---|---|
| Quadrant D | 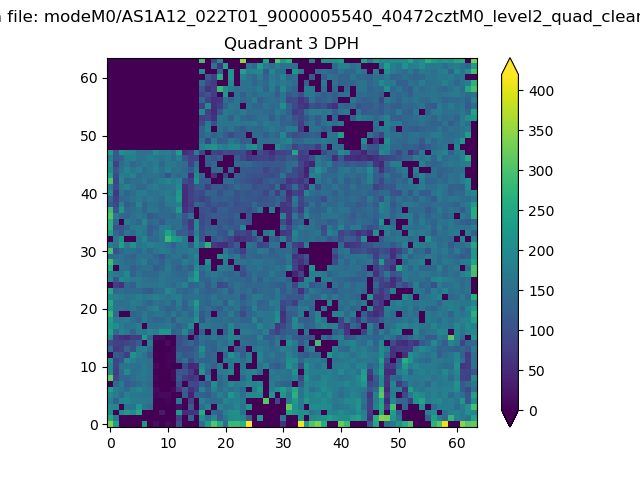 |
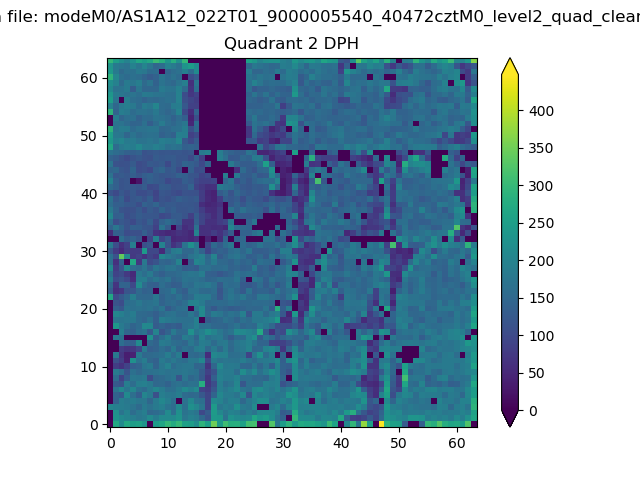 |
Quadrant C |
| Plot type | Count rate plots | Images |
|---|---|---|
| Comparison with Poisson distribution Blue bars denote a histogram of data divided into 1 sec bins. Red curve is a Poisson curve with rate = median count rate of data. |
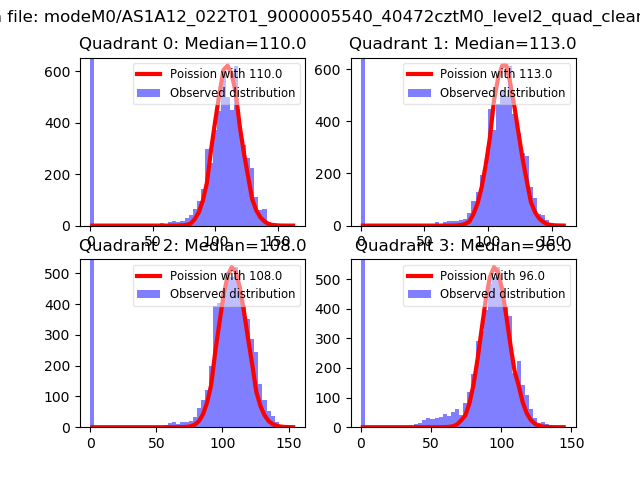 |
 |
| Quadrant-wise count rates Data is divided into 100 sec bins |
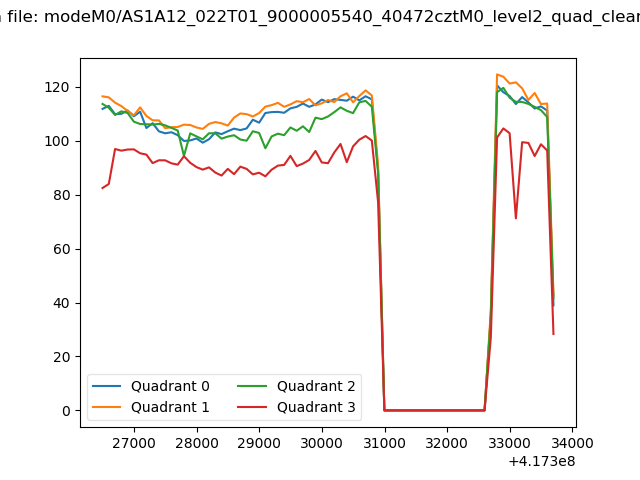 |
|
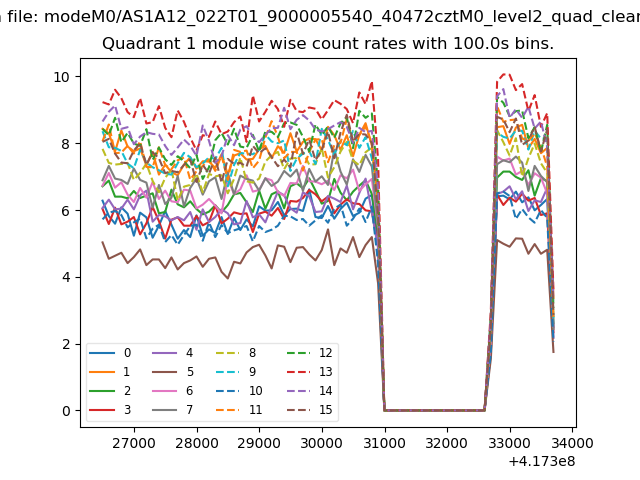
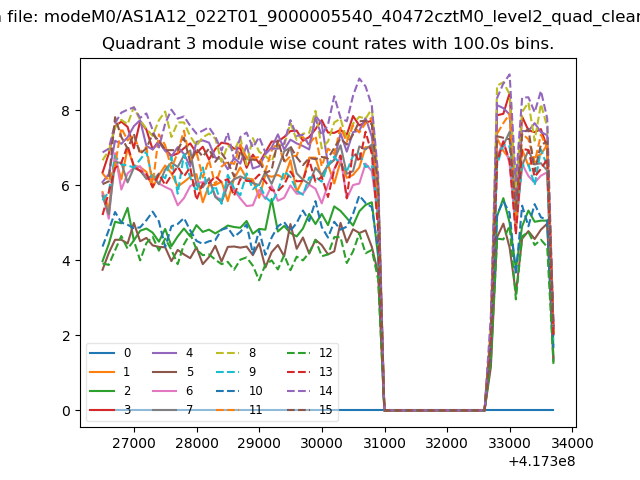
| Module-wise count rates for Quadrant A Data is divided into 100 sec bins |
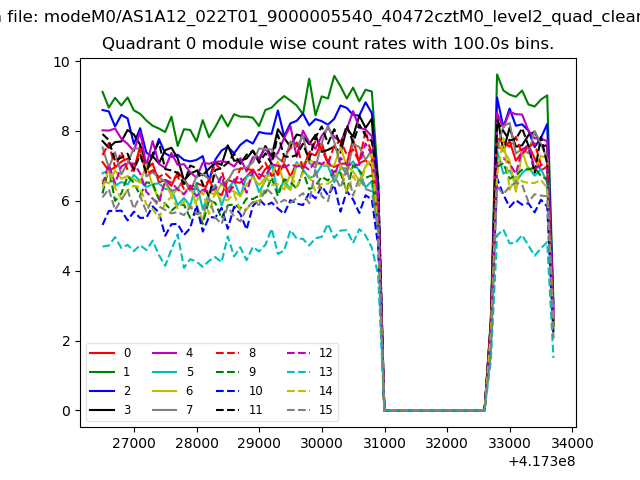 |
 |
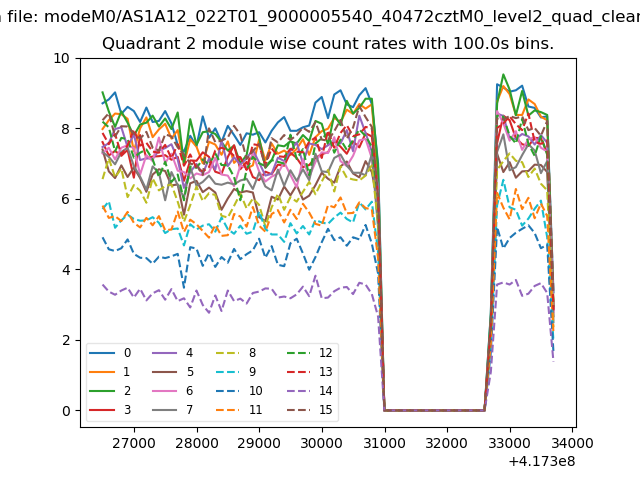
| Module-wise count rates for Quadrant B Data is divided into 100 sec bins |
 |
 |
| Module-wise count rates for Quadrant C Data is divided into 100 sec bins |
 |
 |
| Module-wise count rates for Quadrant D Data is divided into 100 sec bins |
 |
 |
| Parameter | Plot |
|---|---|
| CZT HV Monitor | 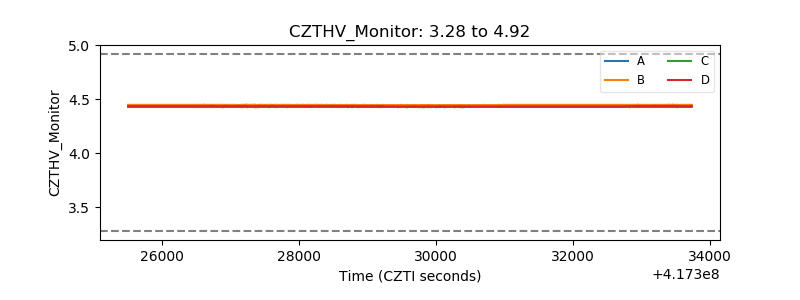 |
| D_VDD | 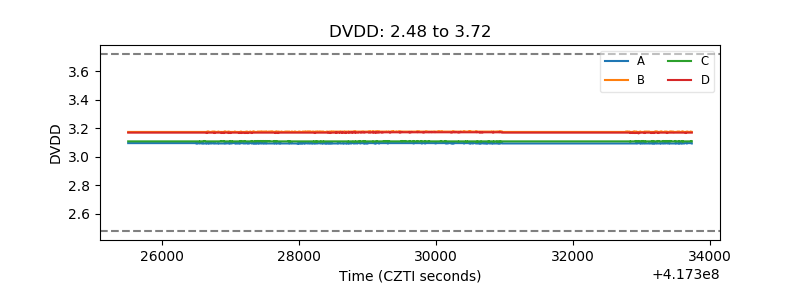 |
| Temperature 1 | 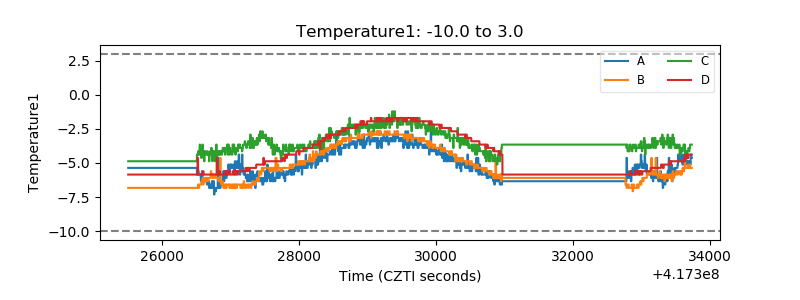 |
| Veto HV Monitor | 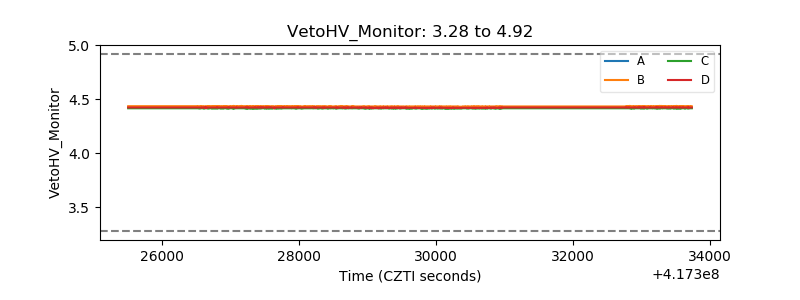 |
| Veto LLD | 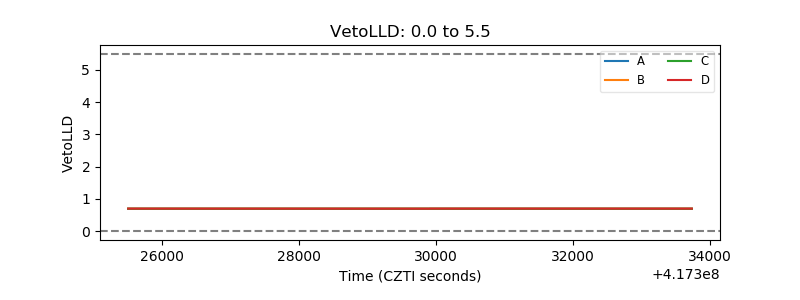 |
| Alpha Counter | 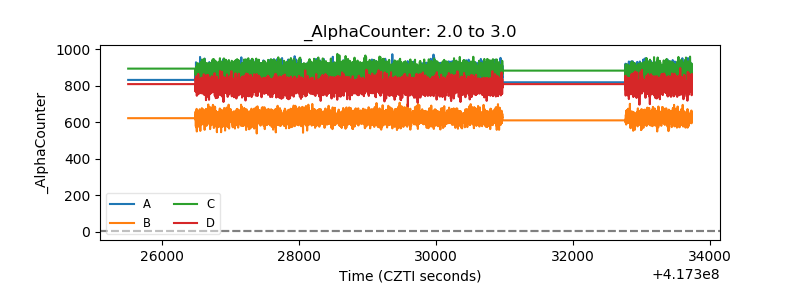 |
| _CPM_Rate | 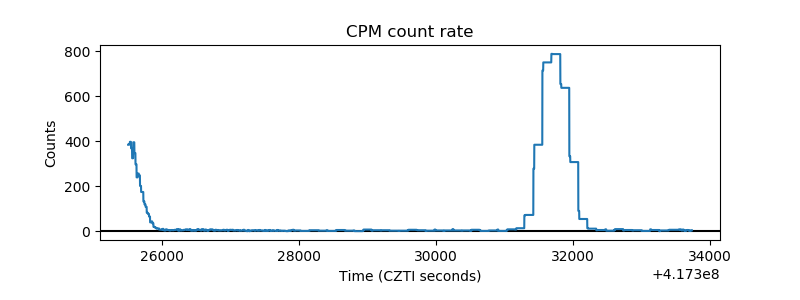 |
| CZT Counter | 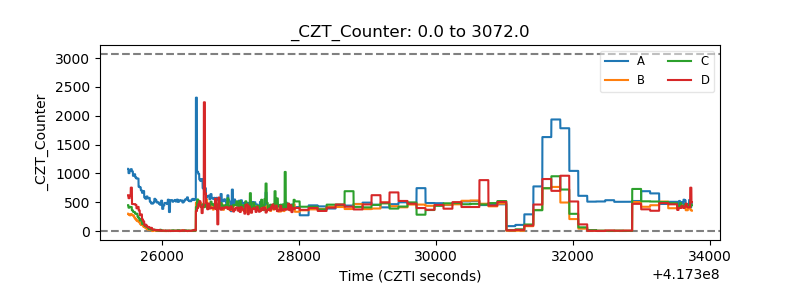 |
| +2.5 Volts monitor | 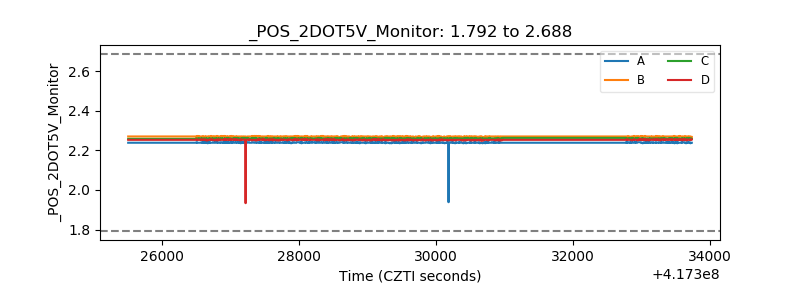 |
| +5 Volts monitor | 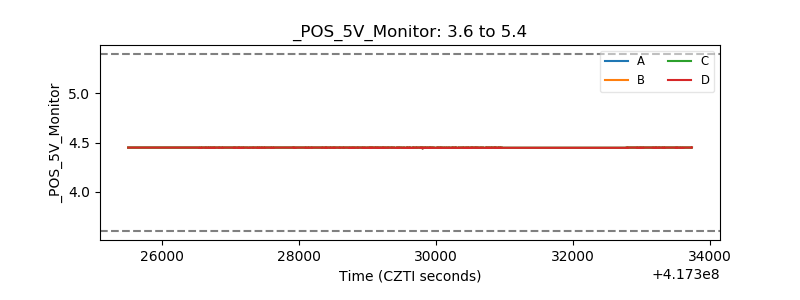 |
| _ROLL_ROT | 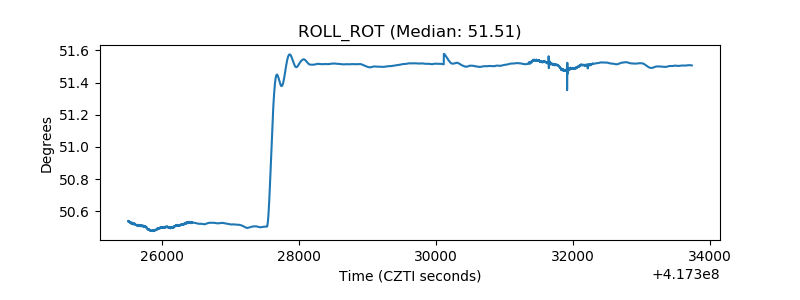 |
| _Roll_DEC | 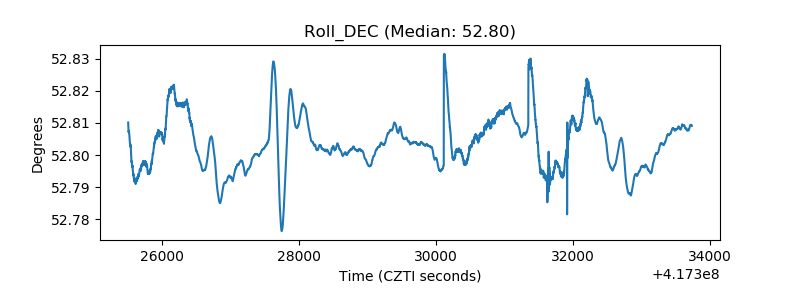 |
| _Roll_RA | 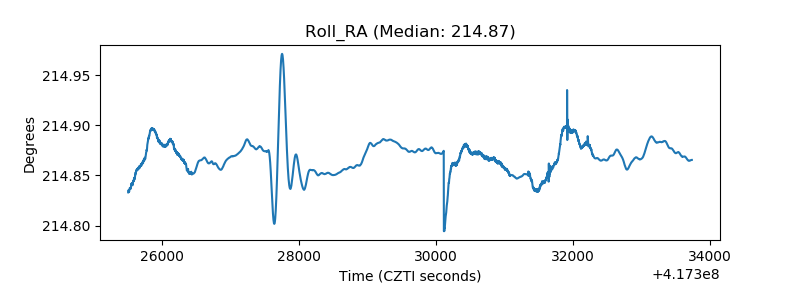 |
| Veto Counter | 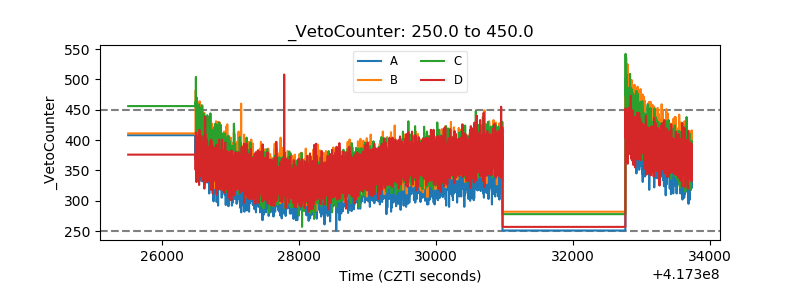 |