| Param | Original file | Final file |
|---|---|---|
| Filename | modeM0/AS1A12_022T01_9000005540_40474cztM0_level2.fits | modeM0/AS1A12_022T01_9000005540_40474cztM0_level2_quad_clean.evt |
| Size (bytes) | 282,481,920 | 87,762,240 |
| Size | 269.4 MB | 83.7 MB |
| Events in quadrant A | 2,718,246 | 607,733 |
| Events in quadrant B | 2,317,377 | 622,180 |
| Events in quadrant C | 2,510,450 | 582,680 |
| Events in quadrant D | 2,517,245 | 492,269 |
| Mode M0 | |||
|---|---|---|---|
| Quadrant | BADHDUFLAG | Total packets | Discarded packets |
| A | 0 | 11029 | 3 |
| B | 0 | 10158 | 6 |
| C | 0 | 10456 | 2 |
| D | 0 | 10811 | 3 |
| Mode M9 | |||
|---|---|---|---|
| Quadrant | BADHDUFLAG | Total packets | Discarded packets |
| A | 0 | 26 | 0 |
| B | 0 | 26 | 0 |
| C | 0 | 26 | 0 |
| D | 0 | 27 | 0 |
| Mode SS | |||
|---|---|---|---|
| Quadrant | BADHDUFLAG | Total packets | Discarded packets |
| A | 0 | 102 | 0 |
| B | 0 | 102 | 0 |
| C | 0 | 102 | 0 |
| D | 0 | 102 | 0 |
| Quadrant | Total seconds | Saturated seconds | Saturation percentage |
|---|---|---|---|
| A | 5032 | 9 | 0.178855% |
| B | 5029 | 4 | 0.079539% |
| C | 5032 | 8 | 0.158983% |
| D | 5031 | 549 | 10.912343% |
Noise dominated data is calculated using 1-second bins in cleaned event files. If a bin has >2000 counts, and if more than 50% of those come from <1% of pixels, then it is considered to be noise-dominated and hence unusable.
| Quadrant | # 1 sec bins | Bins with >0 counts | Bins with >2000 counts | High rate bins dominated by noise | Noise dominated (total time) | Noise dominated (detector-on time) | Marked lightcurve |
|---|---|---|---|---|---|---|---|
| A | 7034 | 5033 | 4 | 4 | 0.06% | 0.08% | 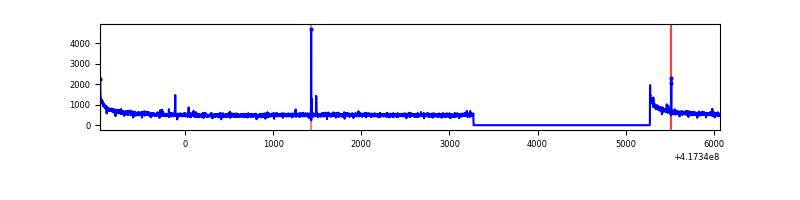 |
| B | 7034 | 5032 | 0 | 0 | 0.00% | 0.00% | 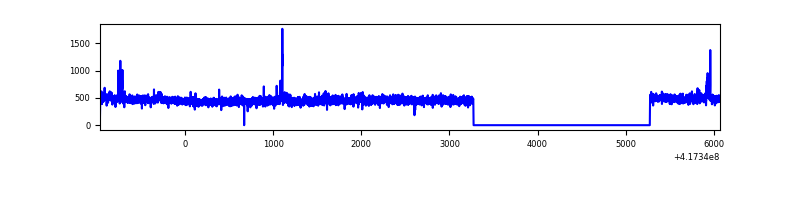 |
| C | 7034 | 5033 | 8 | 8 | 0.11% | 0.16% | 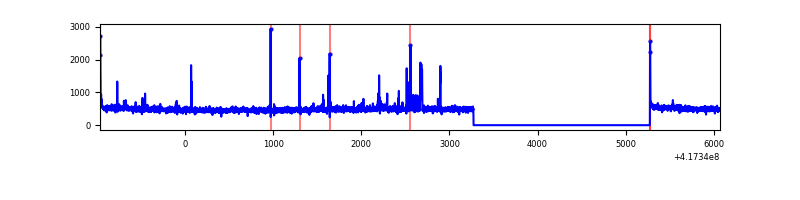 |
| D | 7034 | 5033 | 24 | 24 | 0.34% | 0.48% | 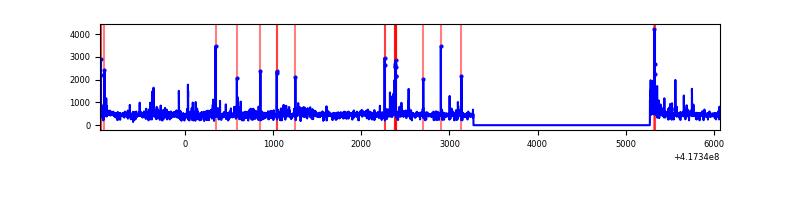 |
Top three noisy pixels from each quadrant. If the there are fewer than three noisy pixels in the level2.evt file, extra rows are filled as -1
| Pixel properties | Quadrant properties | ||||||
|---|---|---|---|---|---|---|---|
| Quadrant | DetID | PixID | Counts | Sigma | Mean | Median | Sigma |
| A | 10 | 83 | 447287 | 3788.9 | 579 | 568 | 117.9 |
| A | 7 | 3 | 23222 | 192.14 | 579 | 568 | 117.9 |
| A | 2 | 79 | 8261 | 65.25 | 579 | 568 | 117.9 |
| B | 0 | 230 | 26335 | 236.83 | 570 | 556 | 108.8 |
| B | 3 | 112 | 22861 | 204.92 | 570 | 556 | 108.8 |
| B | 12 | 111 | 13586 | 119.71 | 570 | 556 | 108.8 |
| C | 15 | 214 | 224671 | 1736.48 | 554 | 557 | 129.1 |
| C | 14 | 254 | 66464 | 510.66 | 554 | 557 | 129.1 |
| C | 10 | 20 | 32950 | 250.99 | 554 | 557 | 129.1 |
| D | 12 | 191 | 178360 | 1382.04 | 528 | 512 | 128.7 |
| D | 12 | 128 | 117922 | 912.38 | 528 | 512 | 128.7 |
| D | 1 | 47 | 62806 | 484.08 | 528 | 512 | 128.7 |
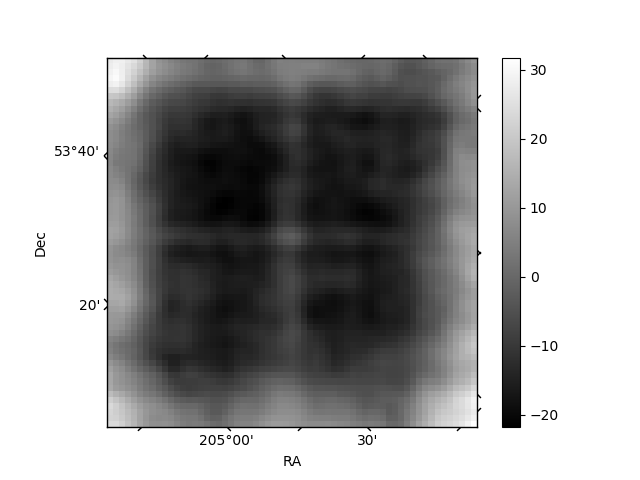
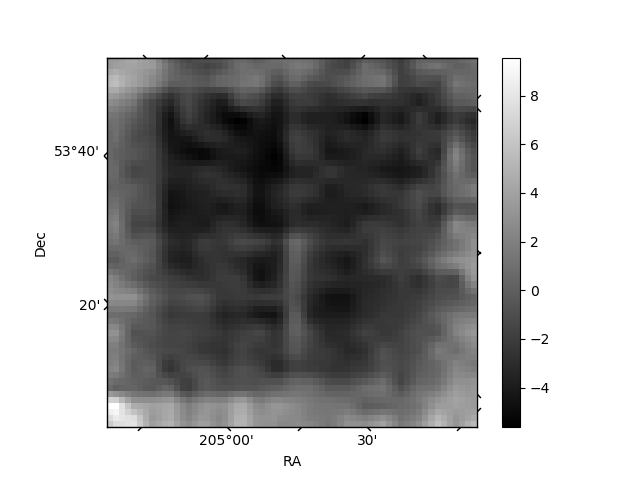
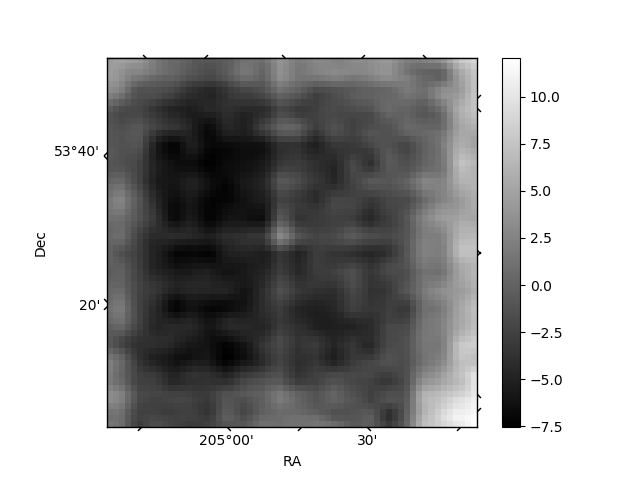
Histogram calculated using DETX and DETY for each event in the final _common_clean file
| Quadrant A | 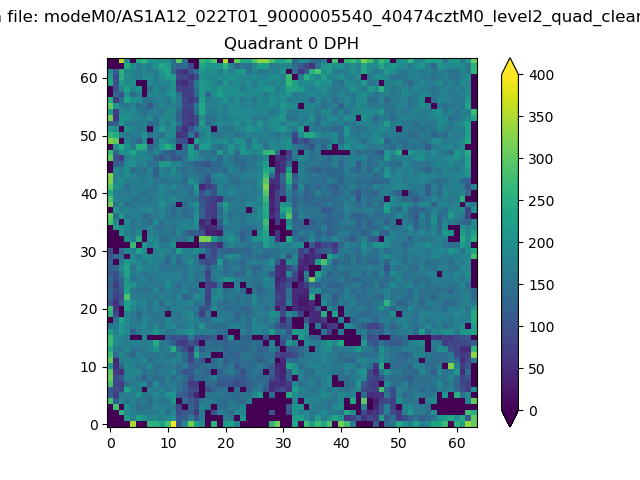 |
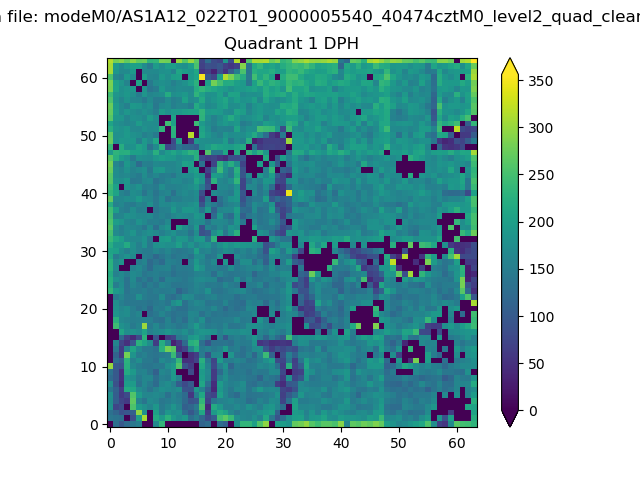 |
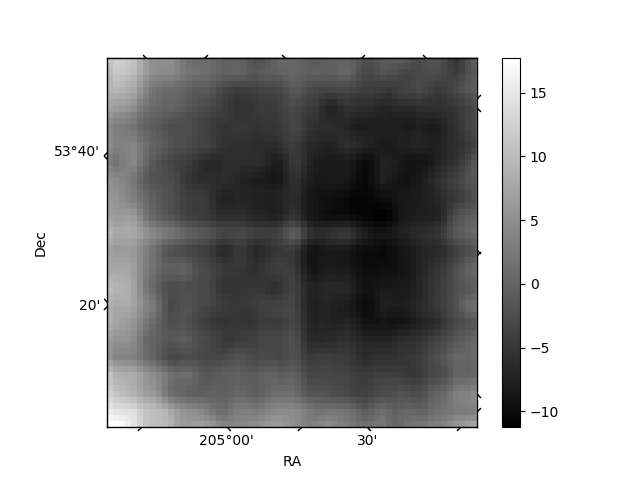
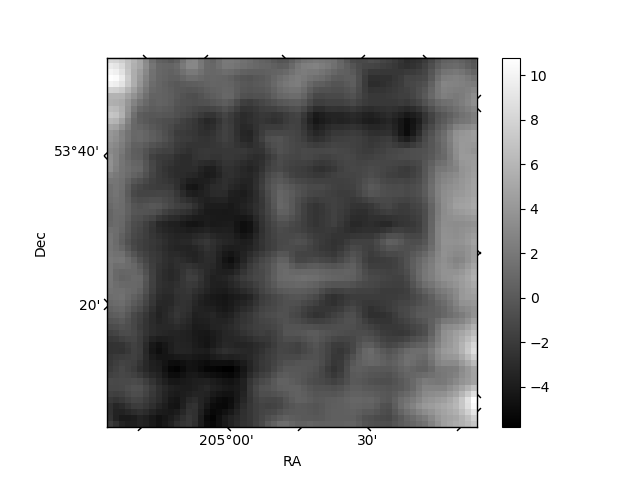
Quadrant B |
|---|---|---|---|
| Quadrant D | 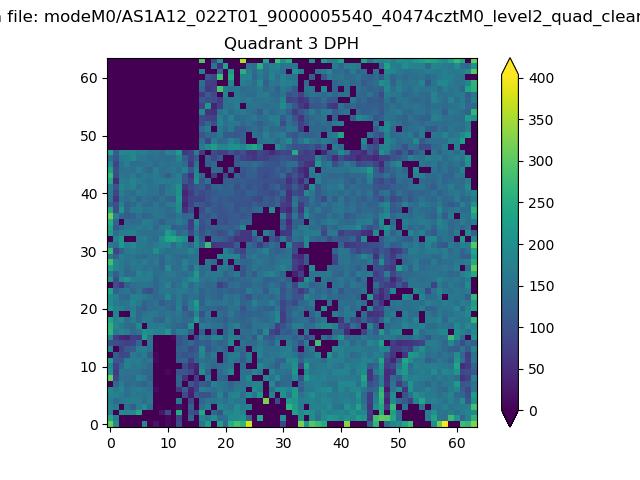 |
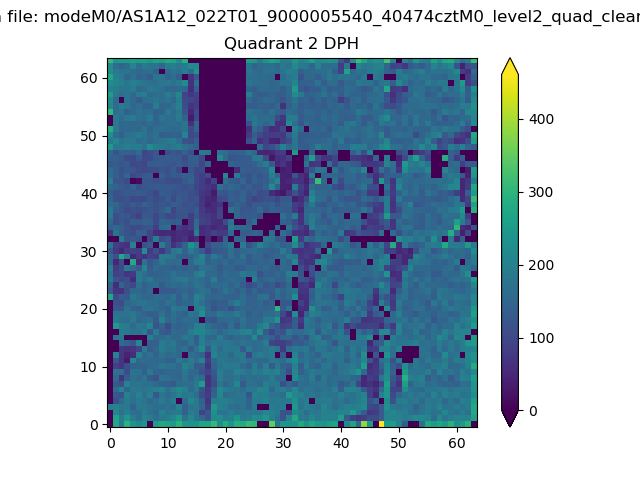 |
Quadrant C |
| Plot type | Count rate plots | Images |
|---|---|---|
| Comparison with Poisson distribution Blue bars denote a histogram of data divided into 1 sec bins. Red curve is a Poisson curve with rate = median count rate of data. |
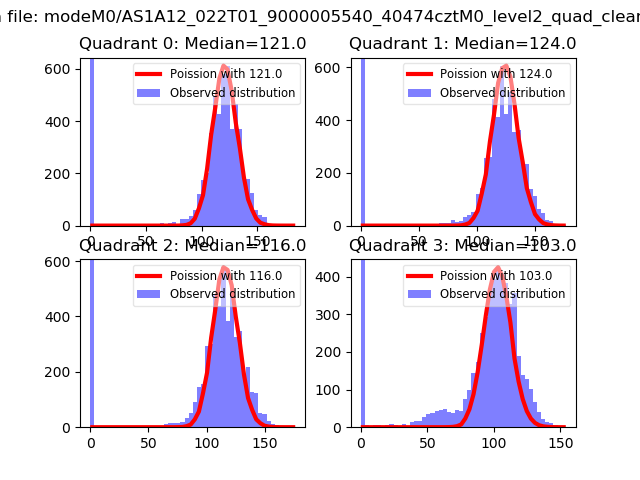 |
 |
| Quadrant-wise count rates Data is divided into 100 sec bins |
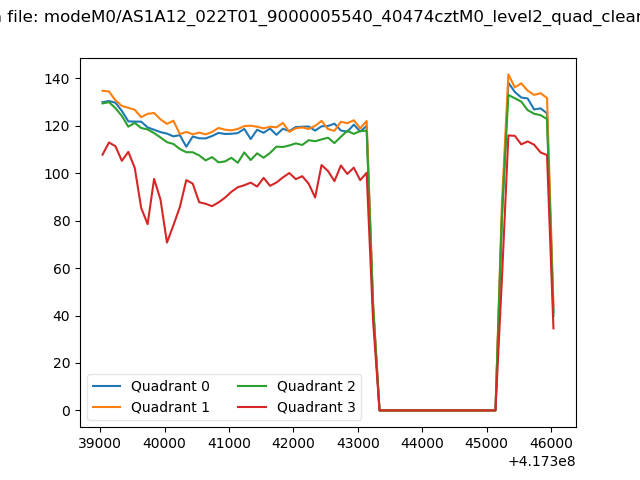 |
|
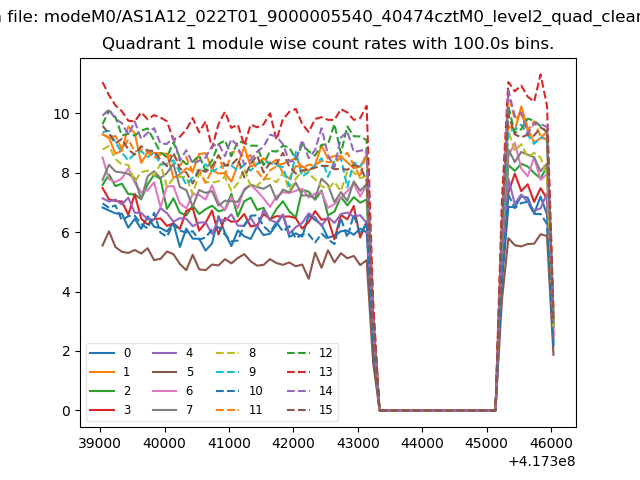
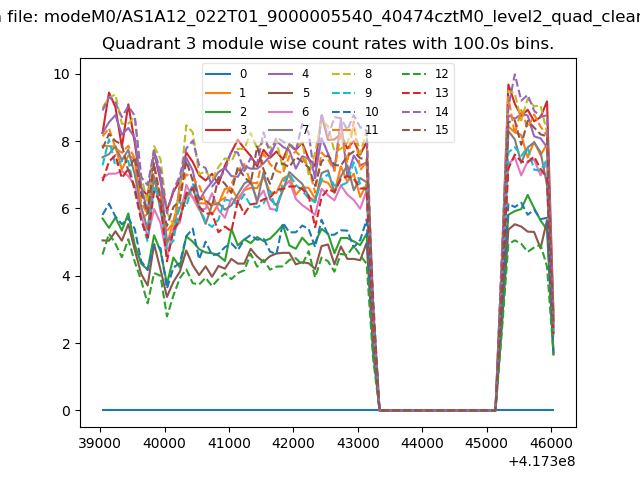
| Module-wise count rates for Quadrant A Data is divided into 100 sec bins |
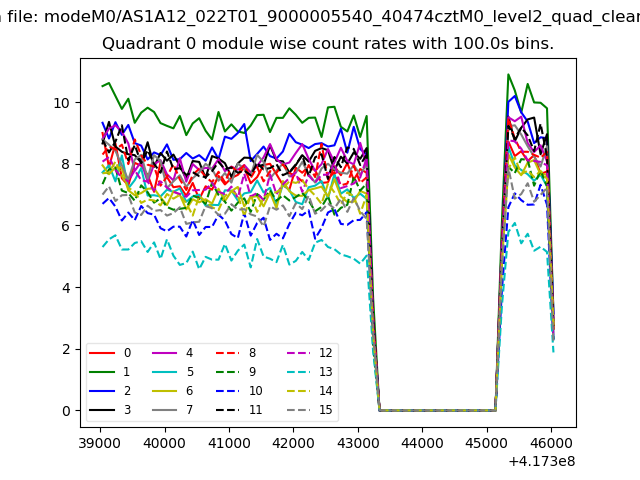 |
 |
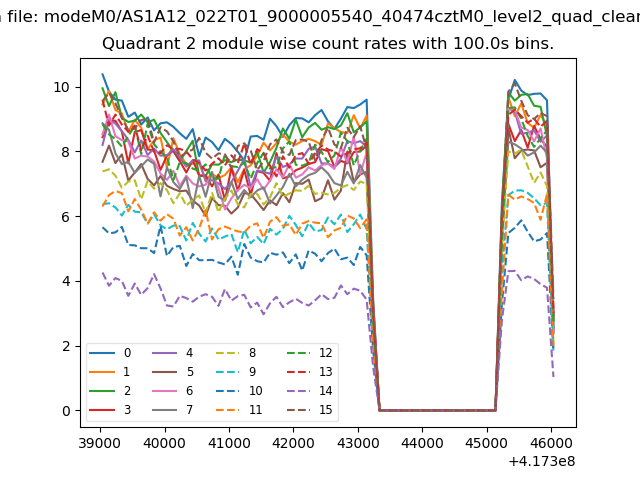
| Module-wise count rates for Quadrant B Data is divided into 100 sec bins |
 |
 |
| Module-wise count rates for Quadrant C Data is divided into 100 sec bins |
 |
 |
| Module-wise count rates for Quadrant D Data is divided into 100 sec bins |
 |
 |
| Parameter | Plot |
|---|---|
| CZT HV Monitor | 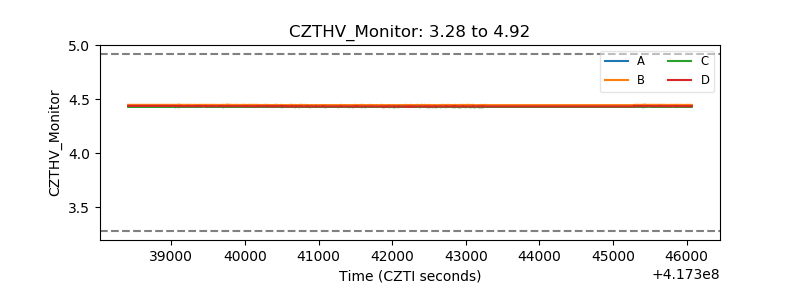 |
| D_VDD | 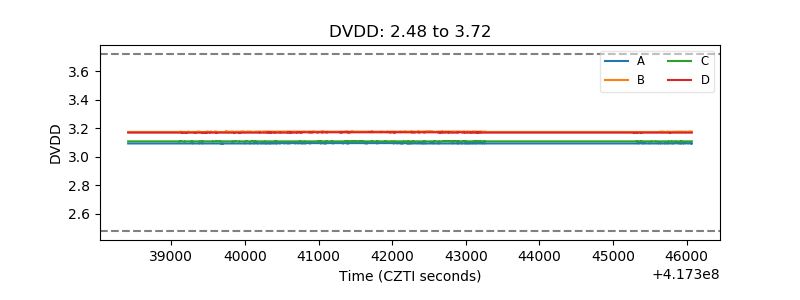 |
| Temperature 1 | 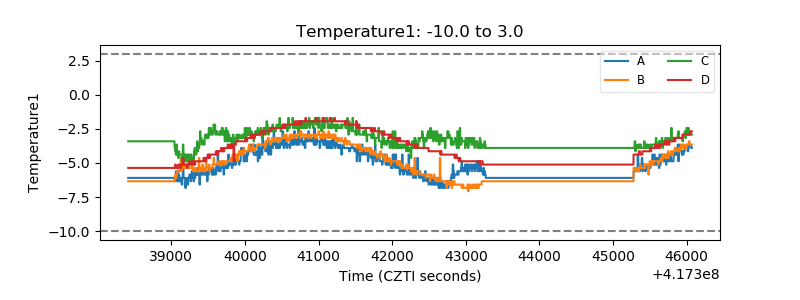 |
| Veto HV Monitor | 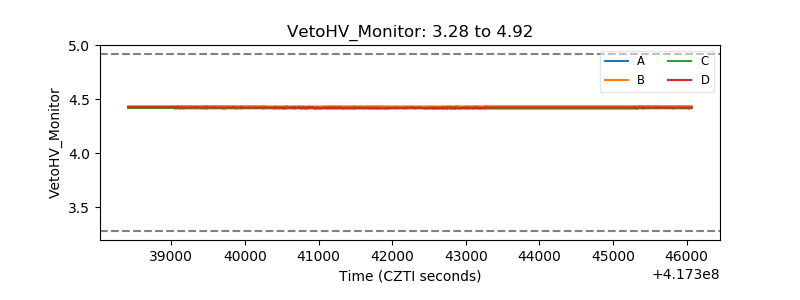 |
| Veto LLD |  |
| Alpha Counter | 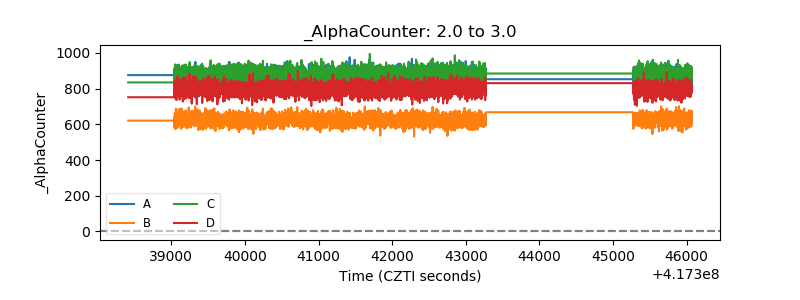 |
| _CPM_Rate | 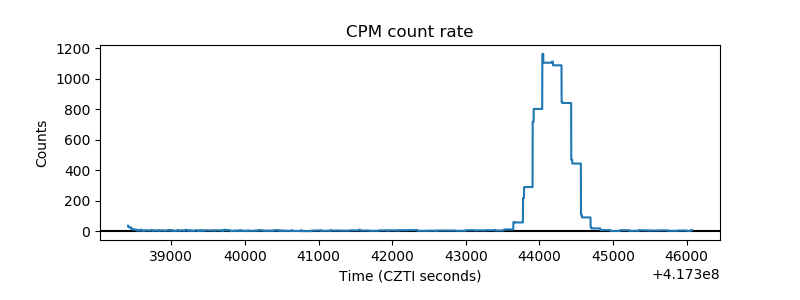 |
| CZT Counter | 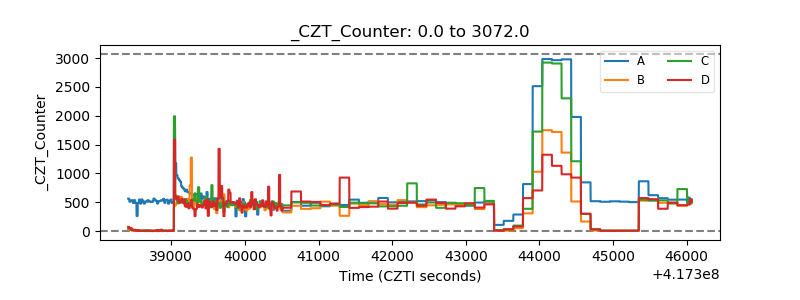 |
| +2.5 Volts monitor | 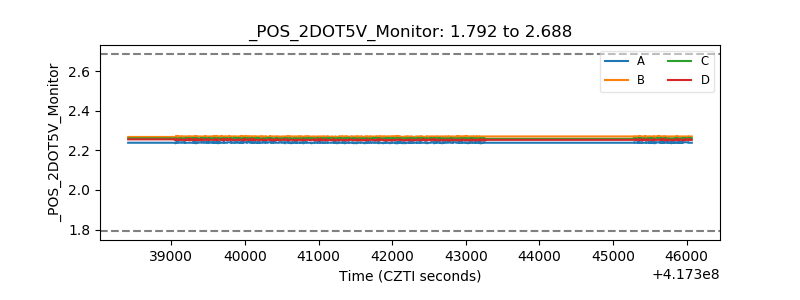 |
| +5 Volts monitor | 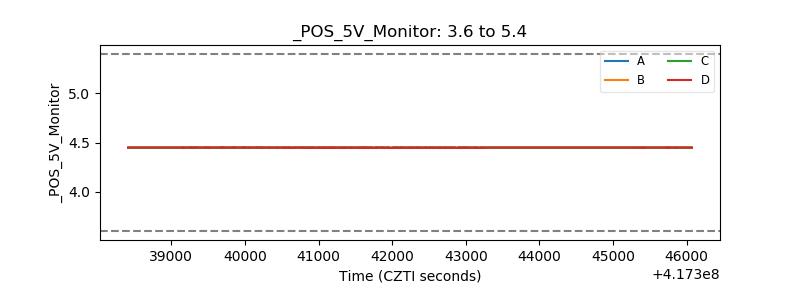 |
| _ROLL_ROT | 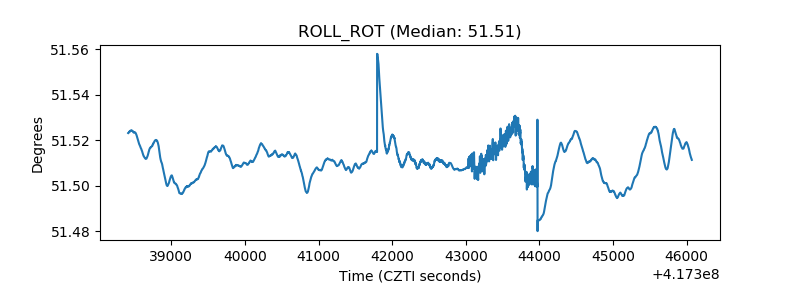 |
| _Roll_DEC | 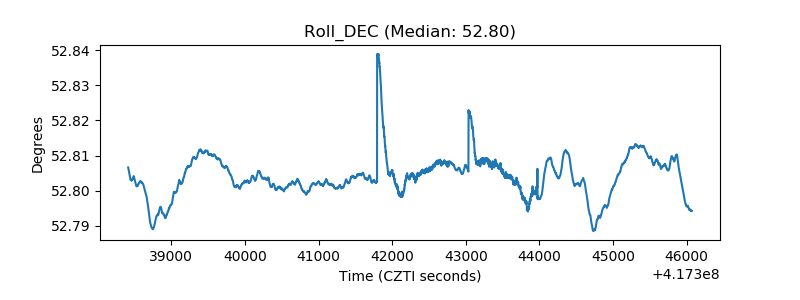 |
| _Roll_RA | 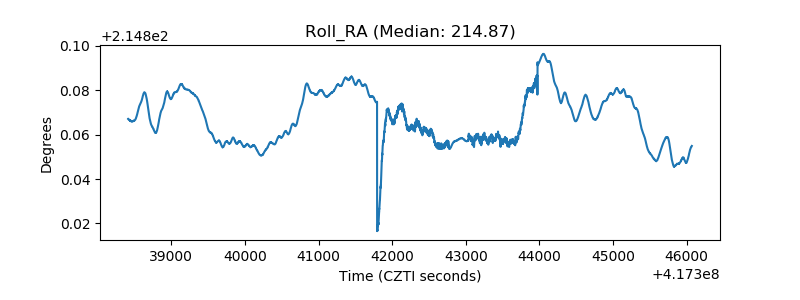 |
| Veto Counter | 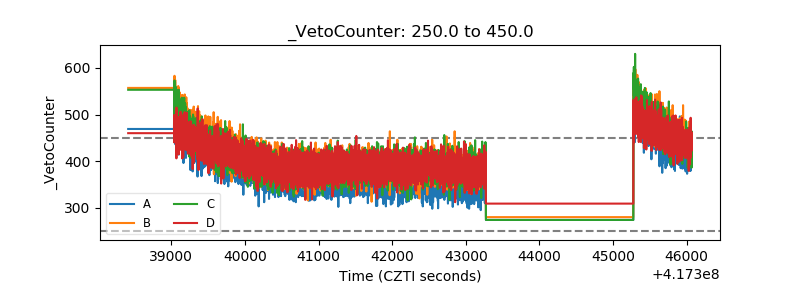 |