| Param | Original file | Final file |
|---|---|---|
| Filename | modeM0/AS1A12_022T01_9000005540_40475cztM0_level2.fits | modeM0/AS1A12_022T01_9000005540_40475cztM0_level2_quad_clean.evt |
| Size (bytes) | 300,493,440 | 91,468,800 |
| Size | 286.6 MB | 87.2 MB |
| Events in quadrant A | 2,796,608 | 632,565 |
| Events in quadrant B | 2,457,837 | 649,196 |
| Events in quadrant C | 2,701,443 | 600,816 |
| Events in quadrant D | 2,767,558 | 528,416 |
| Mode M0 | |||
|---|---|---|---|
| Quadrant | BADHDUFLAG | Total packets | Discarded packets |
| A | 0 | 11360 | 3 |
| B | 0 | 10476 | 2 |
| C | 0 | 11040 | 2 |
| D | 0 | 11382 | 2 |
| Mode M9 | |||
|---|---|---|---|
| Quadrant | BADHDUFLAG | Total packets | Discarded packets |
| A | 0 | 26 | 0 |
| B | 0 | 26 | 0 |
| C | 0 | 26 | 0 |
| D | 0 | 27 | 0 |
| Mode SS | |||
|---|---|---|---|
| Quadrant | BADHDUFLAG | Total packets | Discarded packets |
| A | 0 | 104 | 0 |
| B | 0 | 104 | 0 |
| C | 0 | 104 | 0 |
| D | 0 | 104 | 0 |
| Quadrant | Total seconds | Saturated seconds | Saturation percentage |
|---|---|---|---|
| A | 5122 | 11 | 0.214760% |
| B | 5122 | 18 | 0.351425% |
| C | 5122 | 46 | 0.898087% |
| D | 5122 | 345 | 6.735650% |
Noise dominated data is calculated using 1-second bins in cleaned event files. If a bin has >2000 counts, and if more than 50% of those come from <1% of pixels, then it is considered to be noise-dominated and hence unusable.
| Quadrant | # 1 sec bins | Bins with >0 counts | Bins with >2000 counts | High rate bins dominated by noise | Noise dominated (total time) | Noise dominated (detector-on time) | Marked lightcurve |
|---|---|---|---|---|---|---|---|
| A | 7215 | 5123 | 4 | 4 | 0.06% | 0.08% | 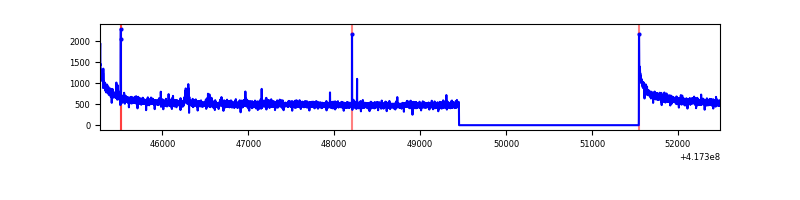 |
| B | 7215 | 5123 | 8 | 8 | 0.11% | 0.16% | 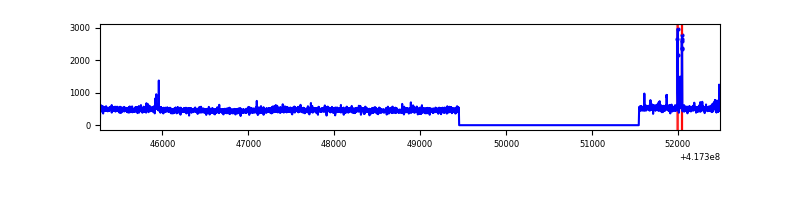 |
| C | 7215 | 5123 | 37 | 37 | 0.51% | 0.72% |  |
| D | 7215 | 5123 | 31 | 31 | 0.43% | 0.61% | 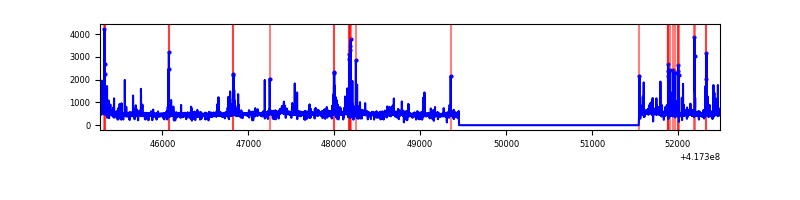 |
Top three noisy pixels from each quadrant. If the there are fewer than three noisy pixels in the level2.evt file, extra rows are filled as -1
| Pixel properties | Quadrant properties | ||||||
|---|---|---|---|---|---|---|---|
| Quadrant | DetID | PixID | Counts | Sigma | Mean | Median | Sigma |
| A | 10 | 83 | 465726 | 3860.13 | 593 | 583 | 120.5 |
| A | 9 | 191 | 18313 | 147.14 | 593 | 583 | 120.5 |
| A | 7 | 3 | 15209 | 121.38 | 593 | 583 | 120.5 |
| B | 3 | 112 | 57372 | 512.28 | 586 | 571 | 110.9 |
| B | 0 | 230 | 49743 | 443.47 | 586 | 571 | 110.9 |
| B | 5 | 255 | 42401 | 377.26 | 586 | 571 | 110.9 |
| C | 14 | 254 | 232587 | 1769.72 | 568 | 572 | 131.1 |
| C | 15 | 214 | 225552 | 1716.06 | 568 | 572 | 131.1 |
| C | 0 | 10 | 15818 | 116.29 | 568 | 572 | 131.1 |
| D | 1 | 47 | 158109 | 1157.95 | 555 | 540 | 136.1 |
| D | 12 | 191 | 139534 | 1021.45 | 555 | 540 | 136.1 |
| D | 2 | 69 | 119625 | 875.14 | 555 | 540 | 136.1 |
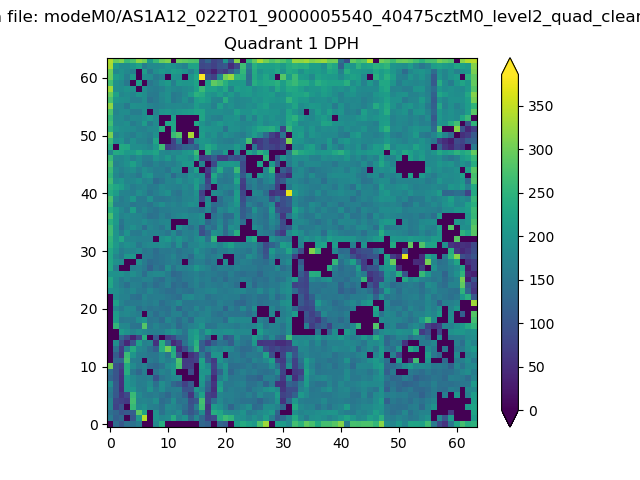
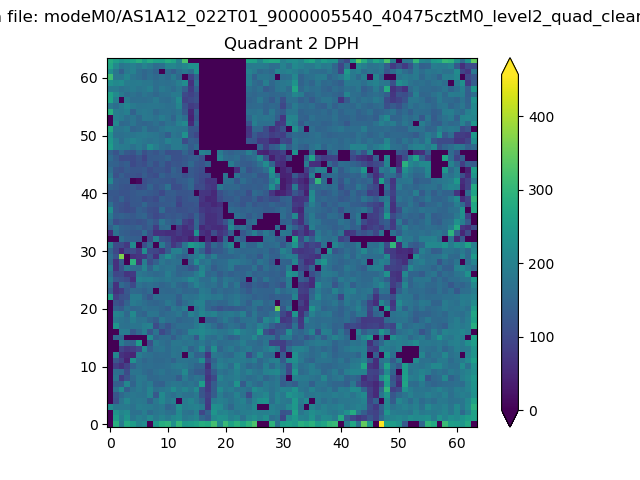
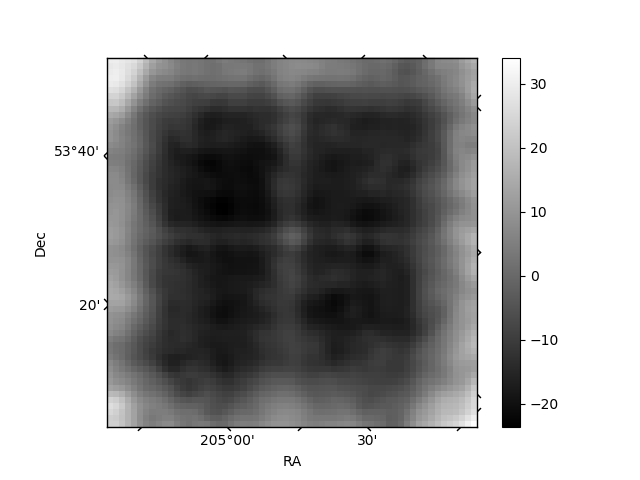
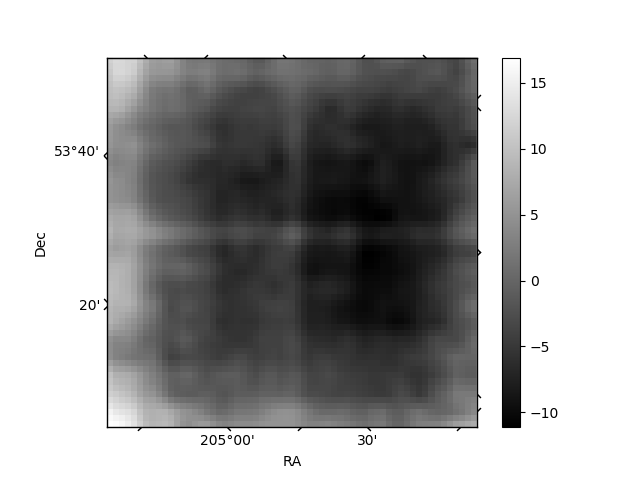
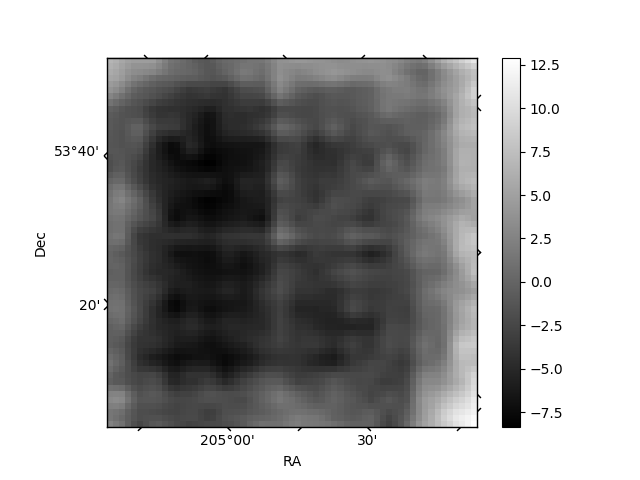
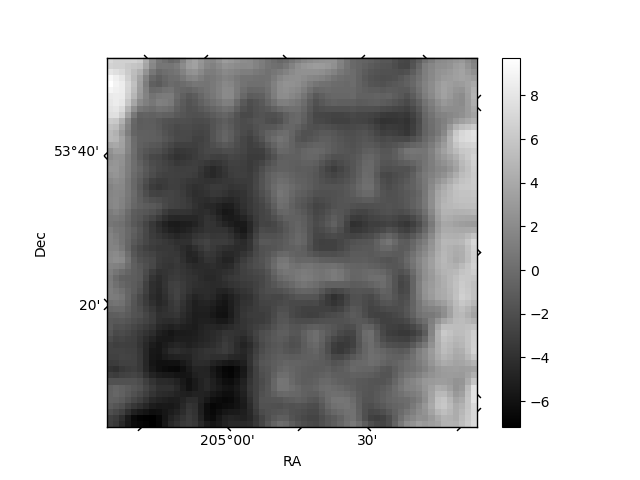
Histogram calculated using DETX and DETY for each event in the final _common_clean file
| Quadrant A | 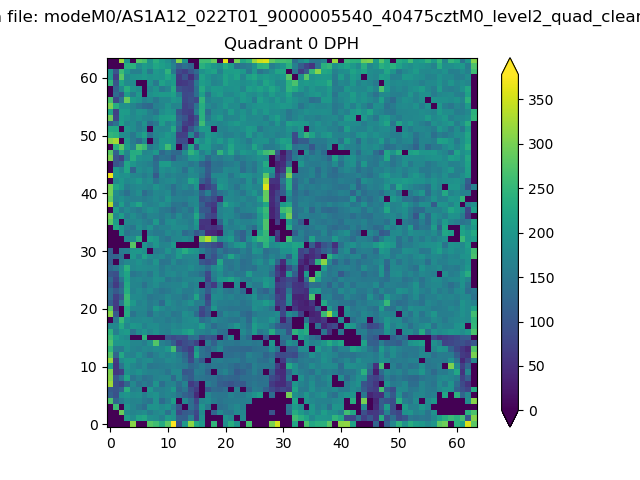 |
 |
Quadrant B |
|---|---|---|---|
| Quadrant D | 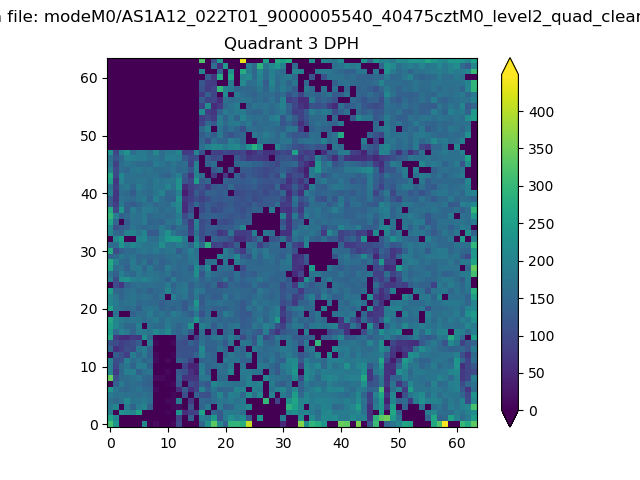 |
 |
Quadrant C |
| Plot type | Count rate plots | Images |
|---|---|---|
| Comparison with Poisson distribution Blue bars denote a histogram of data divided into 1 sec bins. Red curve is a Poisson curve with rate = median count rate of data. |
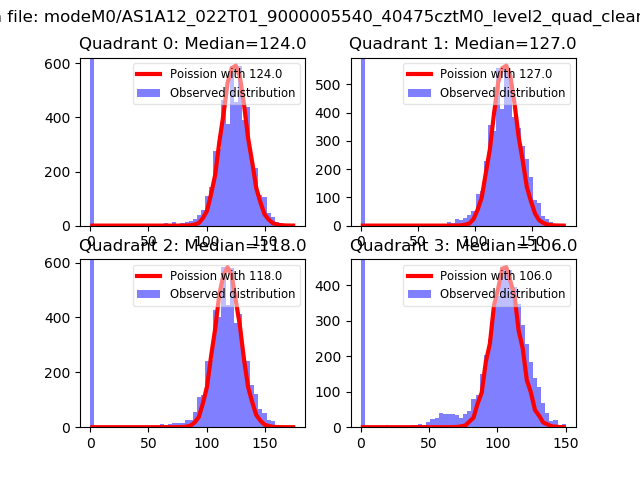 |
 |
| Quadrant-wise count rates Data is divided into 100 sec bins |
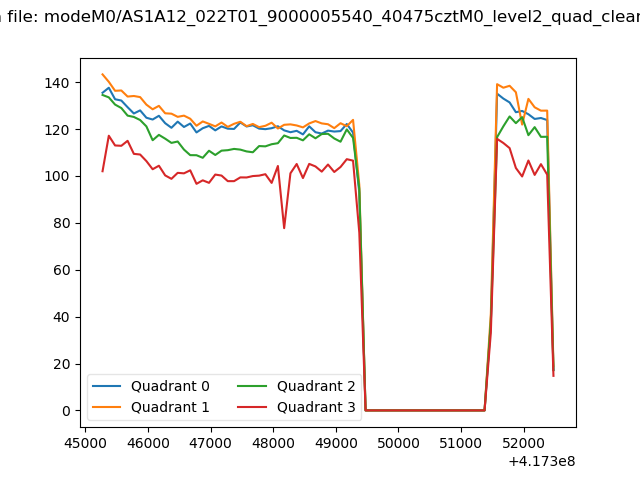 |
|
| Module-wise count rates for Quadrant A Data is divided into 100 sec bins |
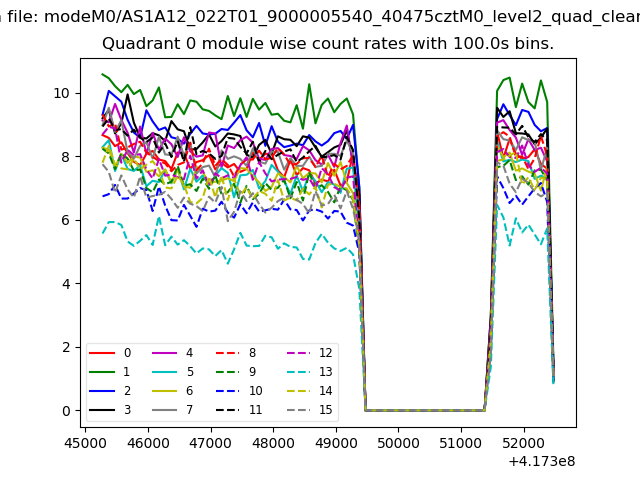 |
 |
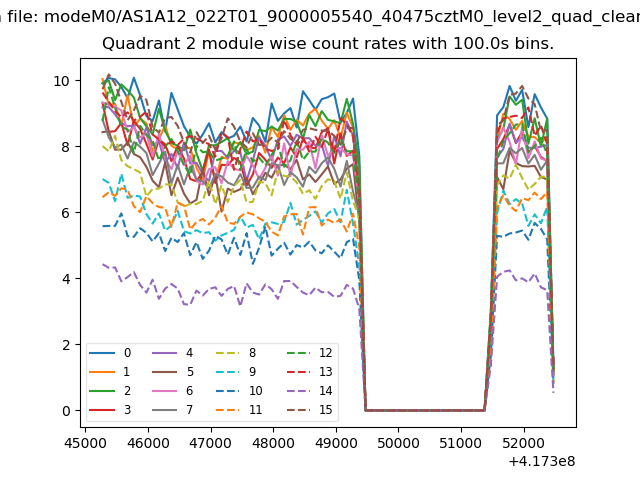
| Module-wise count rates for Quadrant B Data is divided into 100 sec bins |
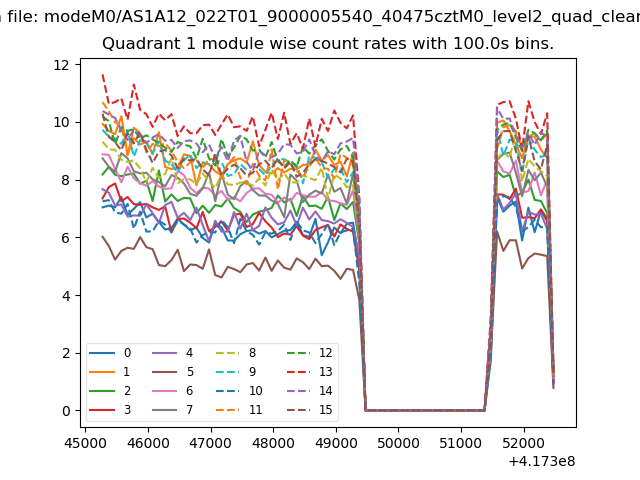 |
 |
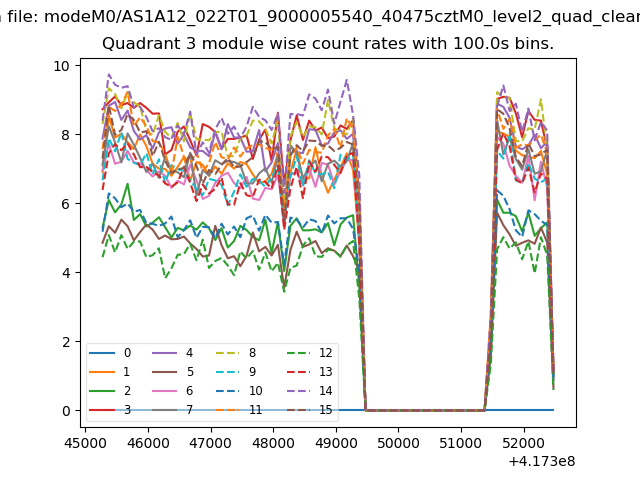
| Module-wise count rates for Quadrant C Data is divided into 100 sec bins |
 |
 |
| Module-wise count rates for Quadrant D Data is divided into 100 sec bins |
 |
 |
| Parameter | Plot |
|---|---|
| CZT HV Monitor | 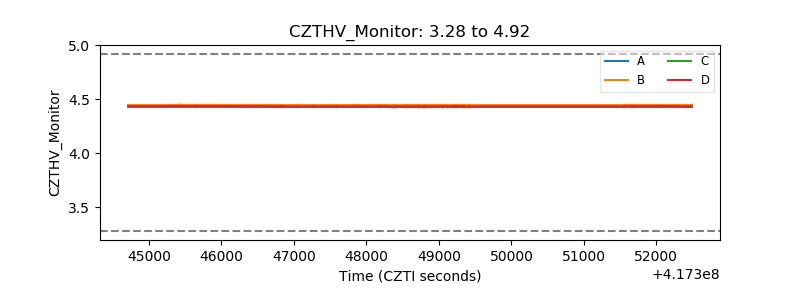 |
| D_VDD | 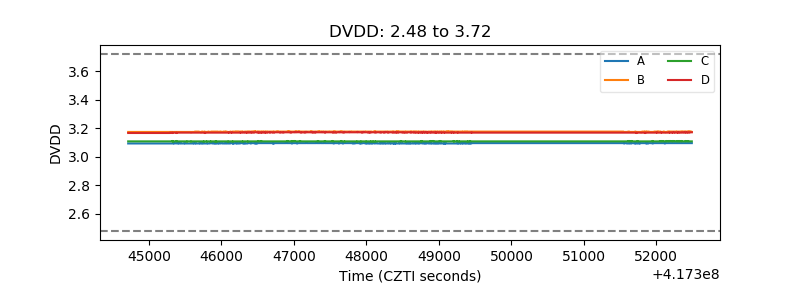 |
| Temperature 1 | 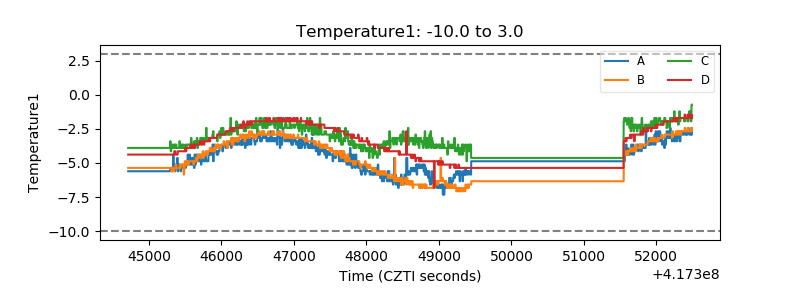 |
| Veto HV Monitor | 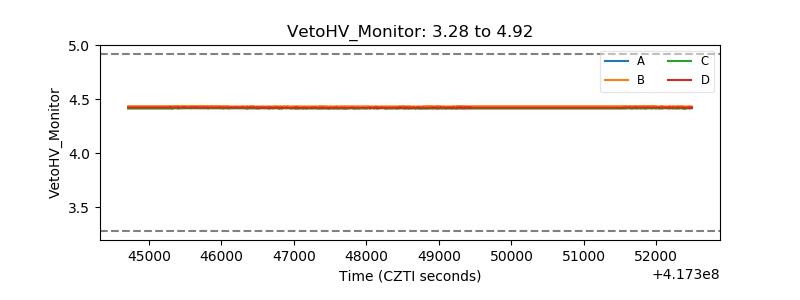 |
| Veto LLD | 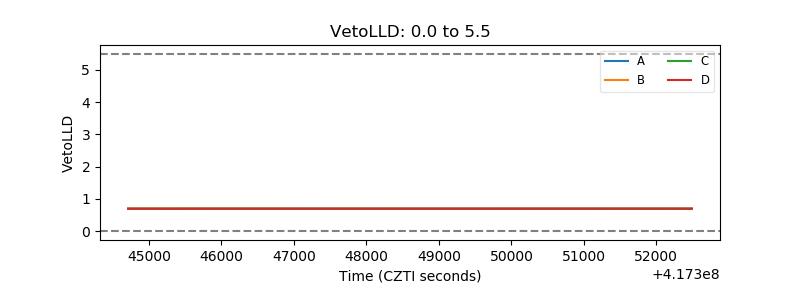 |
| Alpha Counter | 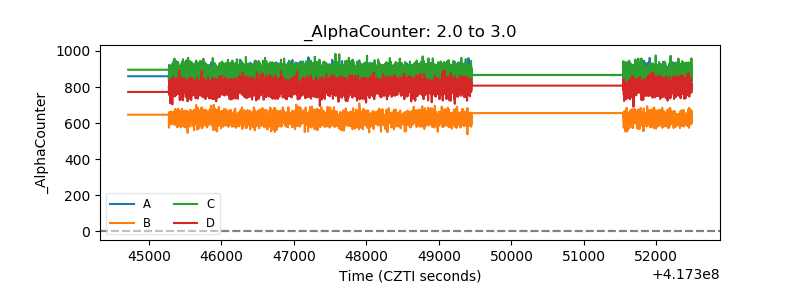 |
| _CPM_Rate | 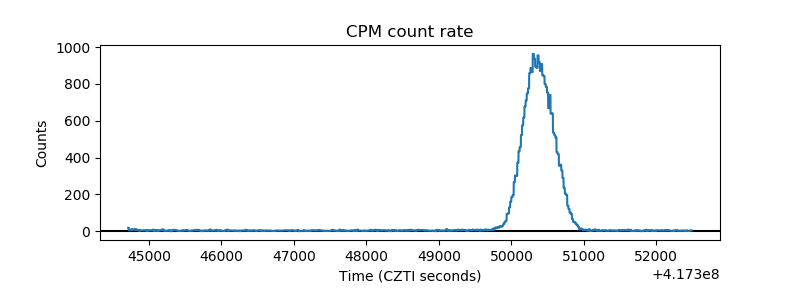 |
| CZT Counter | 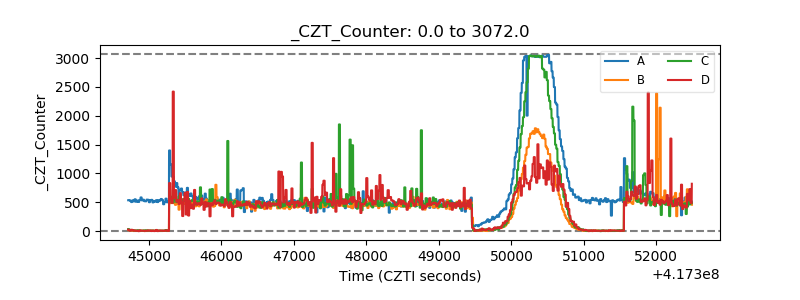 |
| +2.5 Volts monitor | 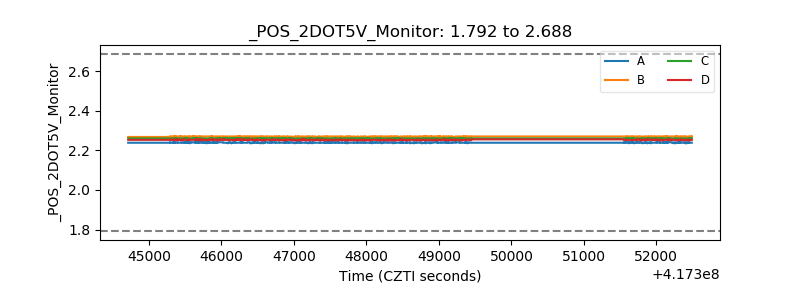 |
| +5 Volts monitor | 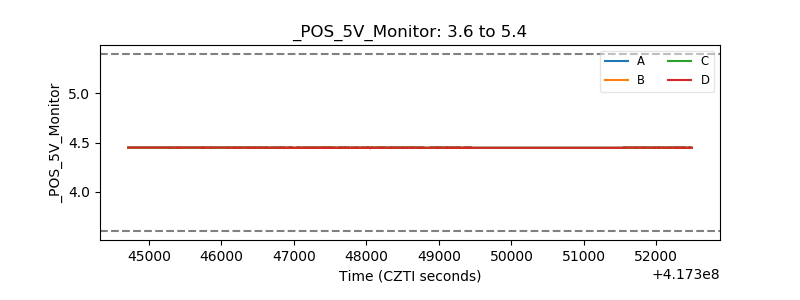 |
| _ROLL_ROT | 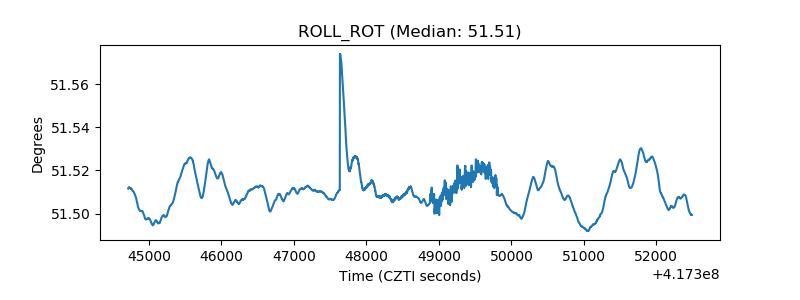 |
| _Roll_DEC | 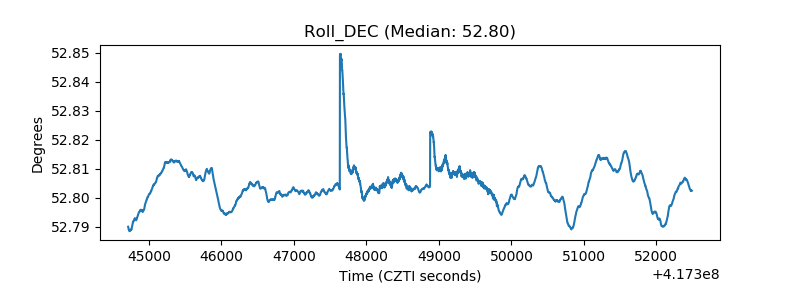 |
| _Roll_RA | 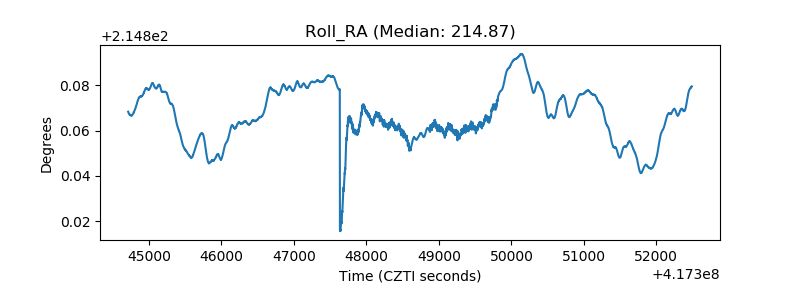 |
| Veto Counter | 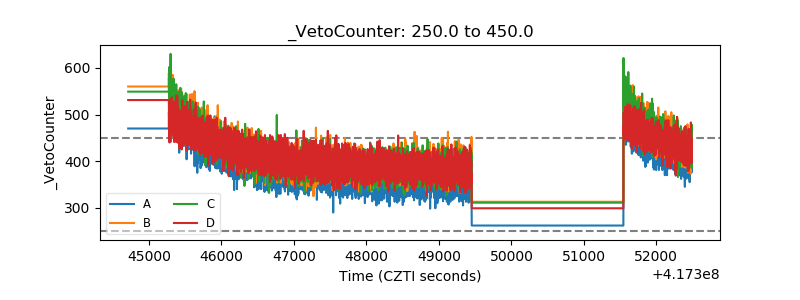 |