| Param | Original file | Final file |
|---|---|---|
| Filename | modeM0/AS1A12_022T01_9000005540_40477cztM0_level2.fits | modeM0/AS1A12_022T01_9000005540_40477cztM0_level2_quad_clean.evt |
| Size (bytes) | 297,077,760 | 85,150,080 |
| Size | 283.3 MB | 81.2 MB |
| Events in quadrant A | 3,051,583 | 588,687 |
| Events in quadrant B | 2,289,118 | 600,766 |
| Events in quadrant C | 2,460,471 | 563,870 |
| Events in quadrant D | 2,798,179 | 468,156 |
| Mode M0 | |||
|---|---|---|---|
| Quadrant | BADHDUFLAG | Total packets | Discarded packets |
| A | 0 | 12405 | 3 |
| B | 0 | 10296 | 2 |
| C | 0 | 10529 | 2 |
| D | 0 | 11785 | 2 |
| Mode M9 | |||
|---|---|---|---|
| Quadrant | BADHDUFLAG | Total packets | Discarded packets |
| A | 0 | 31 | 0 |
| B | 0 | 31 | 0 |
| C | 0 | 31 | 0 |
| D | 0 | 32 | 0 |
| Mode SS | |||
|---|---|---|---|
| Quadrant | BADHDUFLAG | Total packets | Discarded packets |
| A | 0 | 104 | 0 |
| B | 0 | 104 | 0 |
| C | 0 | 104 | 0 |
| D | 0 | 104 | 0 |
| Quadrant | Total seconds | Saturated seconds | Saturation percentage |
|---|---|---|---|
| A | 5090 | 36 | 0.707269% |
| B | 5090 | 6 | 0.117878% |
| C | 5090 | 32 | 0.628684% |
| D | 5090 | 675 | 13.261297% |
Noise dominated data is calculated using 1-second bins in cleaned event files. If a bin has >2000 counts, and if more than 50% of those come from <1% of pixels, then it is considered to be noise-dominated and hence unusable.
| Quadrant | # 1 sec bins | Bins with >0 counts | Bins with >2000 counts | High rate bins dominated by noise | Noise dominated (total time) | Noise dominated (detector-on time) | Marked lightcurve |
|---|---|---|---|---|---|---|---|
| A | 7151 | 5091 | 15 | 15 | 0.21% | 0.29% | 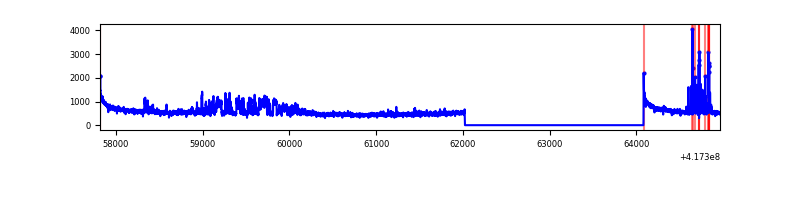 |
| B | 7151 | 5091 | 4 | 4 | 0.06% | 0.08% | 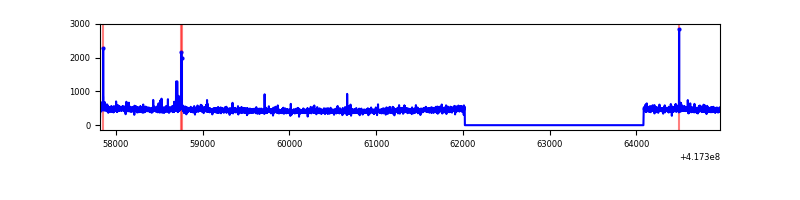 |
| C | 7151 | 5091 | 28 | 28 | 0.39% | 0.55% | 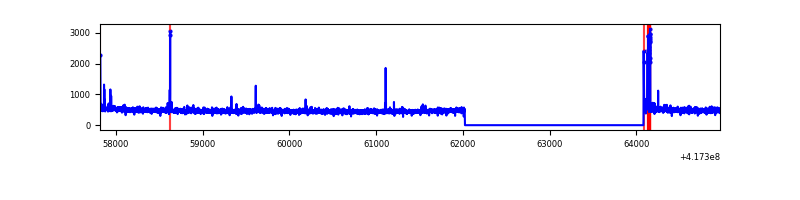 |
| D | 7151 | 5091 | 86 | 86 | 1.20% | 1.69% | 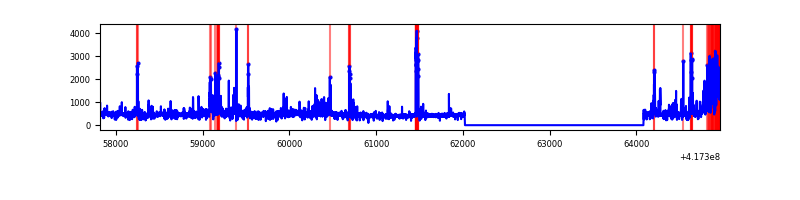 |
Top three noisy pixels from each quadrant. If the there are fewer than three noisy pixels in the level2.evt file, extra rows are filled as -1
| Pixel properties | Quadrant properties | ||||||
|---|---|---|---|---|---|---|---|
| Quadrant | DetID | PixID | Counts | Sigma | Mean | Median | Sigma |
| A | 10 | 83 | 480748 | 4263.27 | 557 | 547 | 112.6 |
| A | 9 | 191 | 313306 | 2776.71 | 557 | 547 | 112.6 |
| A | 13 | 248 | 95257 | 840.84 | 557 | 547 | 112.6 |
| B | 3 | 112 | 72639 | 671.6 | 554 | 536 | 107.4 |
| B | 15 | 201 | 24398 | 222.26 | 554 | 536 | 107.4 |
| B | 12 | 111 | 13191 | 117.87 | 554 | 536 | 107.4 |
| C | 15 | 214 | 220910 | 1736.27 | 544 | 548 | 126.9 |
| C | 14 | 254 | 93083 | 729.1 | 544 | 548 | 126.9 |
| C | 0 | 10 | 15752 | 119.8 | 544 | 548 | 126.9 |
| D | 2 | 250 | 456155 | 3608.49 | 512 | 498 | 126.3 |
| D | 12 | 191 | 180999 | 1429.45 | 512 | 498 | 126.3 |
| D | 9 | 19 | 57196 | 449.01 | 512 | 498 | 126.3 |
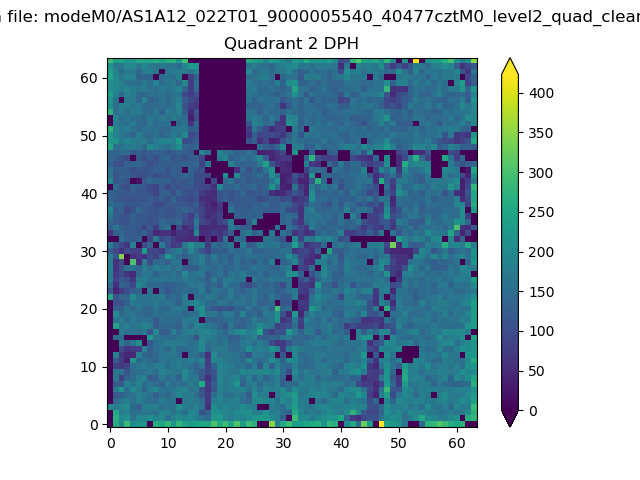
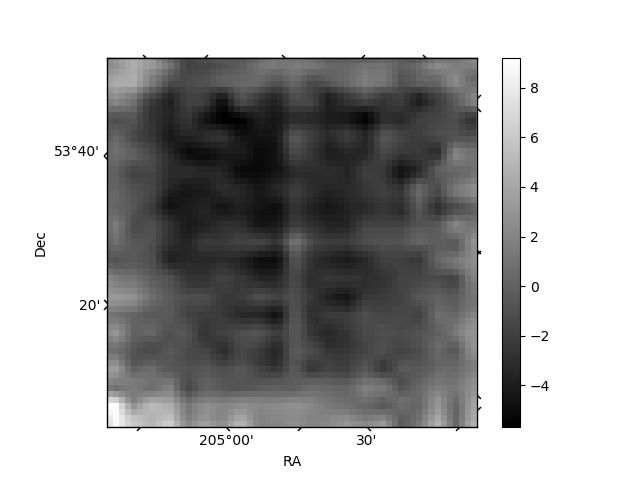
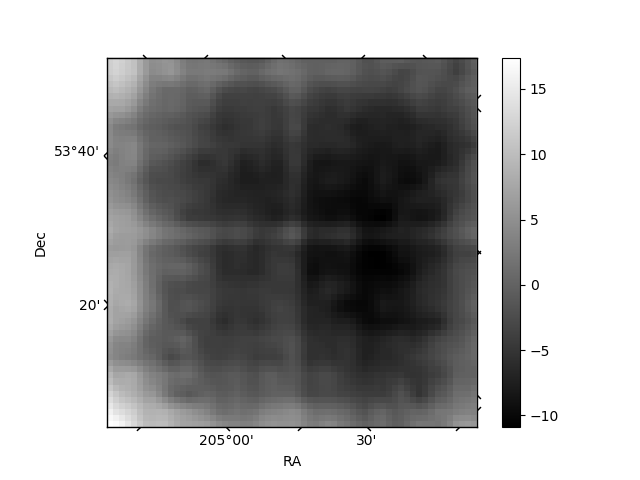
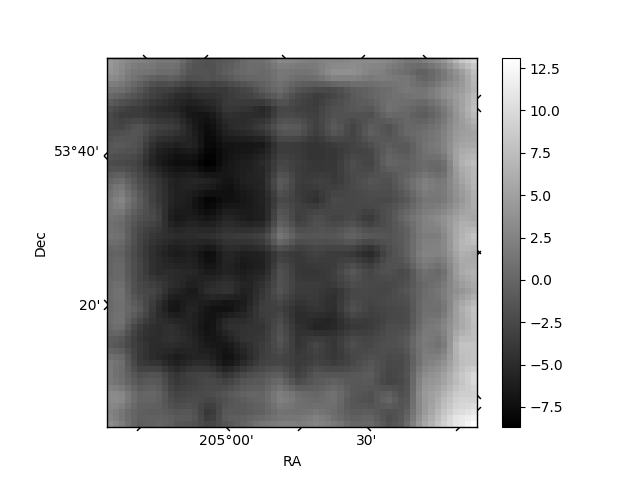
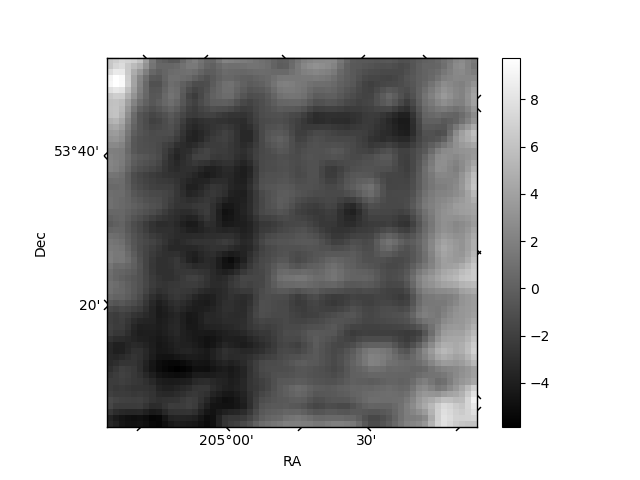
Histogram calculated using DETX and DETY for each event in the final _common_clean file
| Quadrant A | 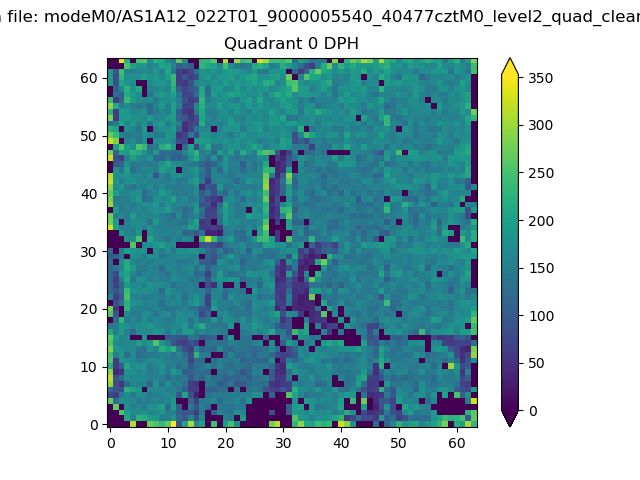 |
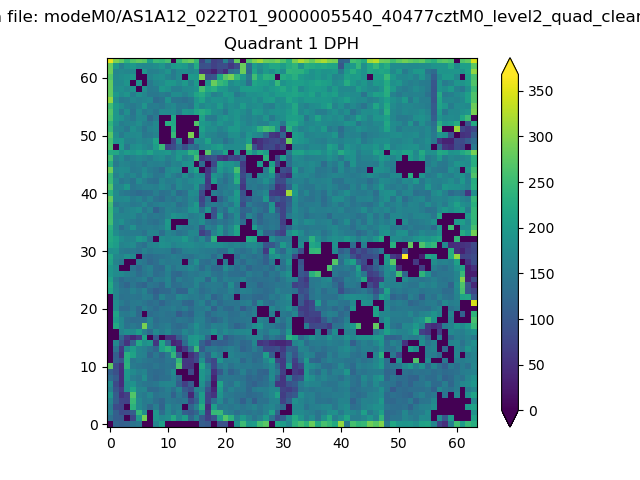 |
Quadrant B |
|---|---|---|---|
| Quadrant D | 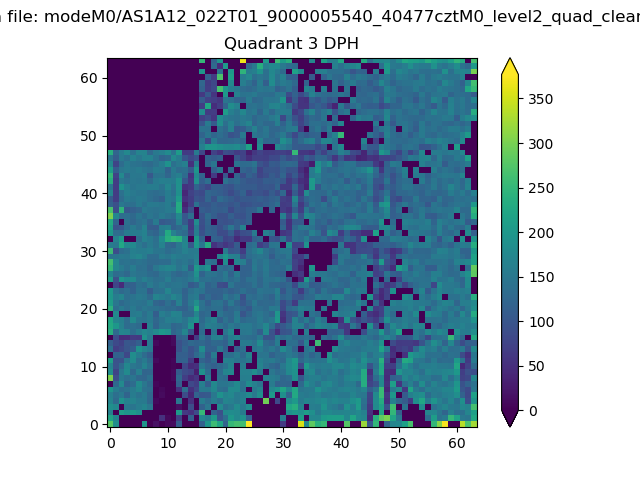 |
 |
Quadrant C |
| Plot type | Count rate plots | Images |
|---|---|---|
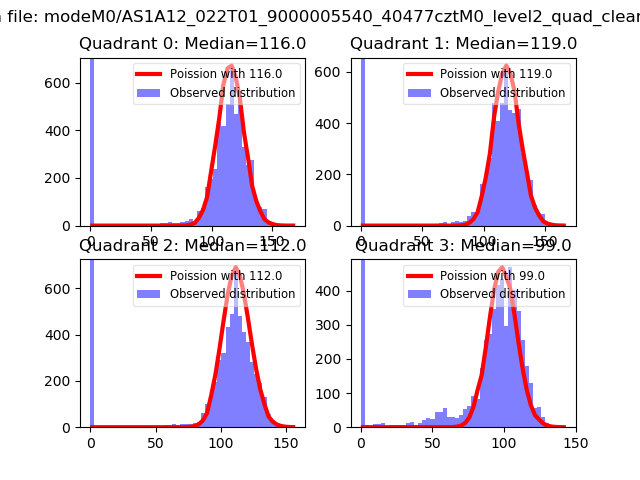
| Comparison with Poisson distribution Blue bars denote a histogram of data divided into 1 sec bins. Red curve is a Poisson curve with rate = median count rate of data. |
 |
 |
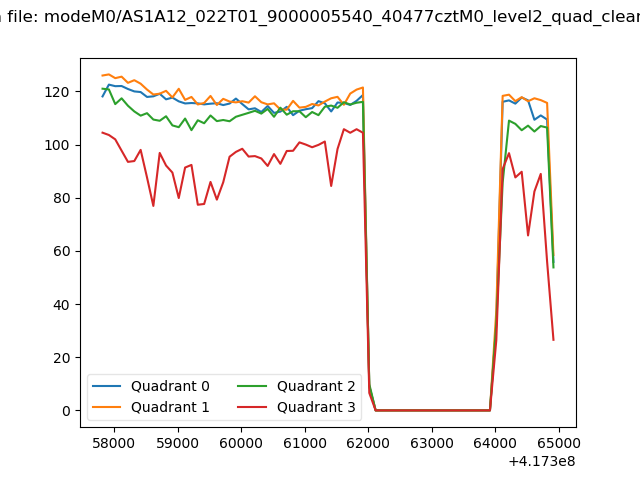
| Quadrant-wise count rates Data is divided into 100 sec bins |
 |
|
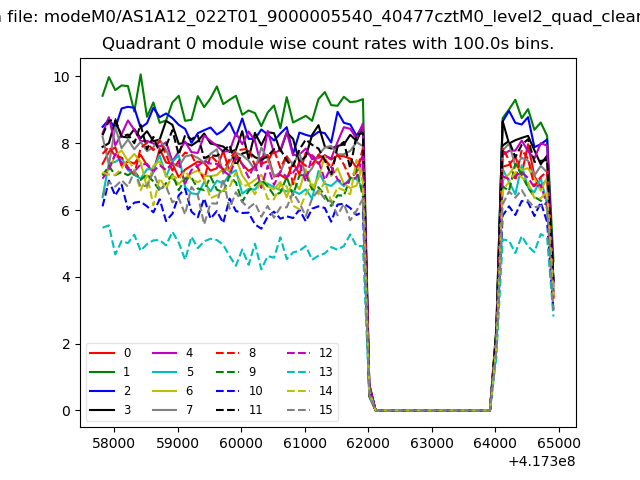
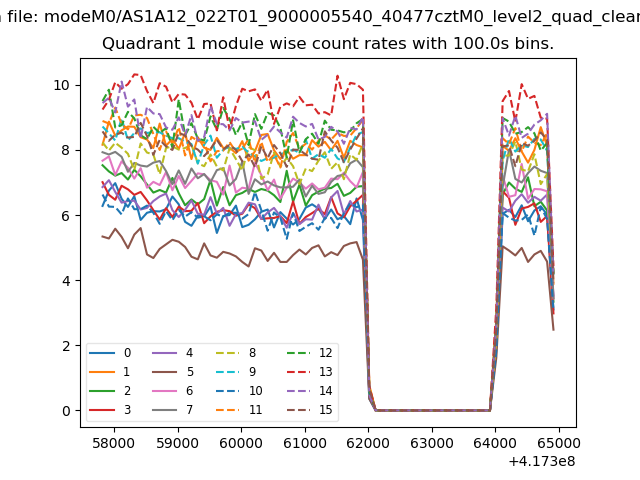
| Module-wise count rates for Quadrant A Data is divided into 100 sec bins |
 |
 |
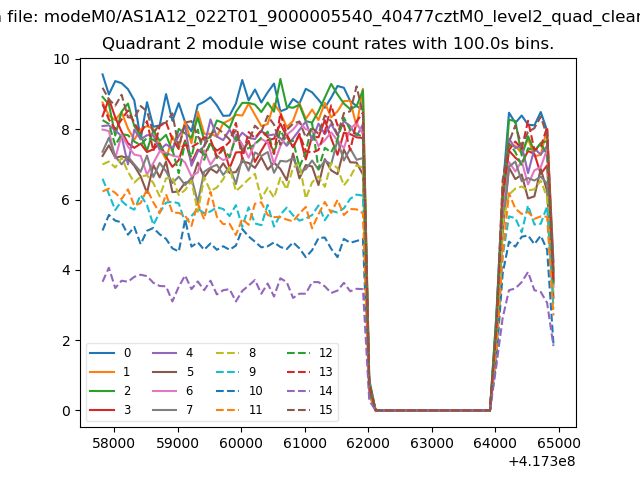
| Module-wise count rates for Quadrant B Data is divided into 100 sec bins |
 |
 |
| Module-wise count rates for Quadrant C Data is divided into 100 sec bins |
 |
 |
| Module-wise count rates for Quadrant D Data is divided into 100 sec bins |
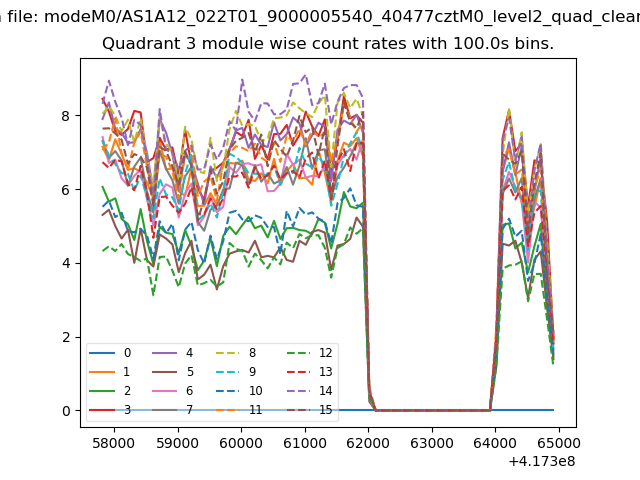 |
 |
| Parameter | Plot |
|---|---|
| CZT HV Monitor | 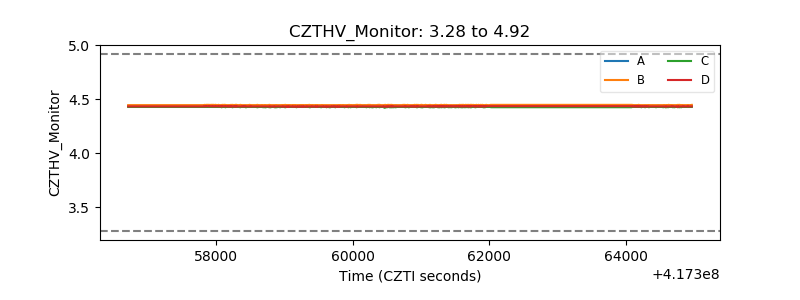 |
| D_VDD | 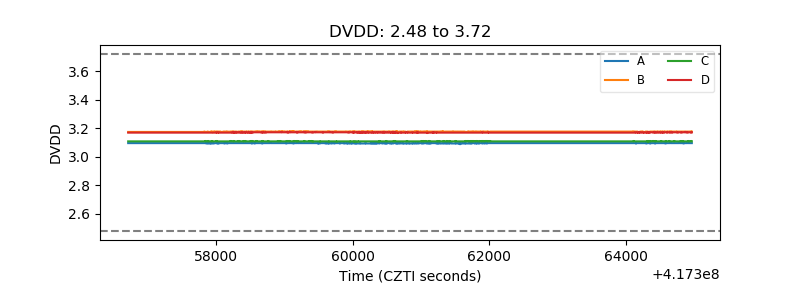 |
| Temperature 1 |  |
| Veto HV Monitor | 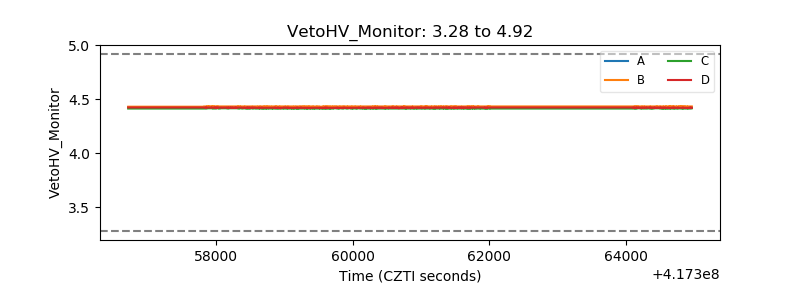 |
| Veto LLD | 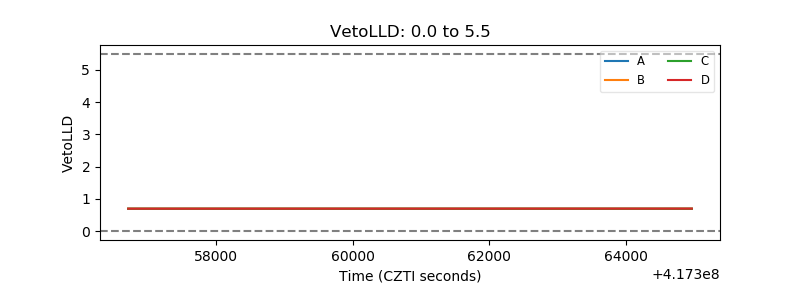 |
| Alpha Counter | 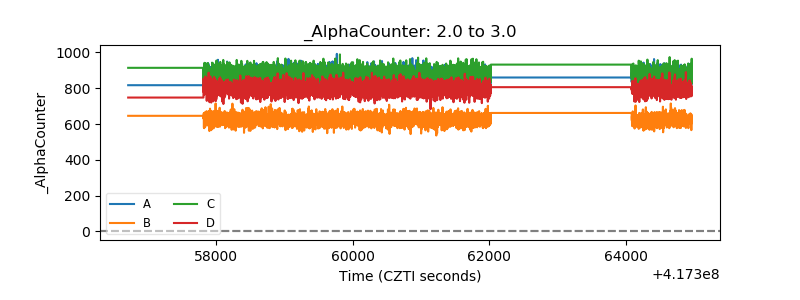 |
| _CPM_Rate | 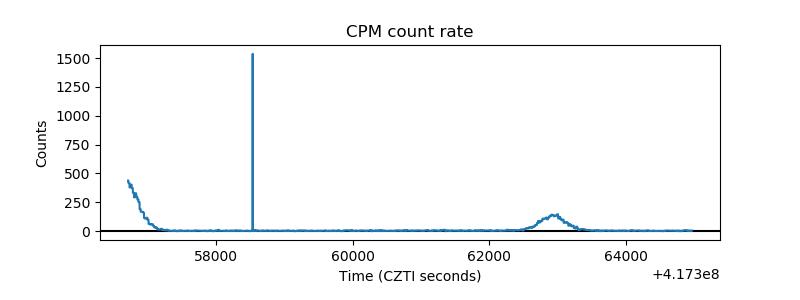 |
| CZT Counter | 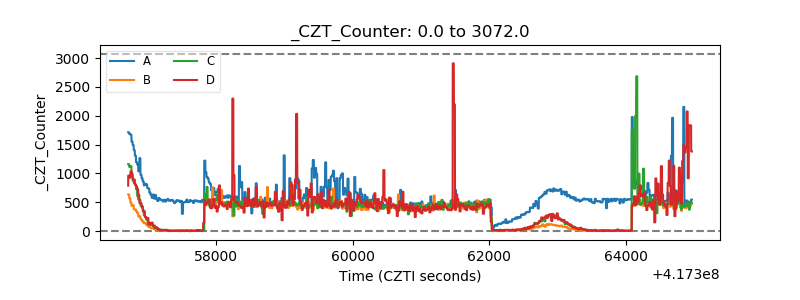 |
| +2.5 Volts monitor | 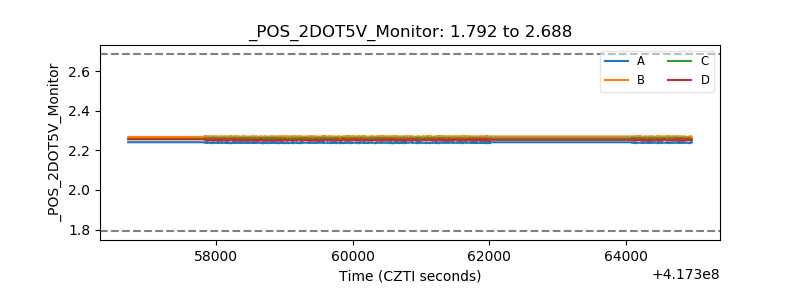 |
| +5 Volts monitor |  |
| _ROLL_ROT | 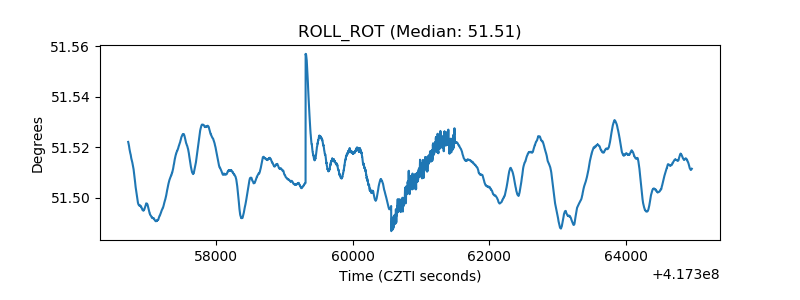 |
| _Roll_DEC | 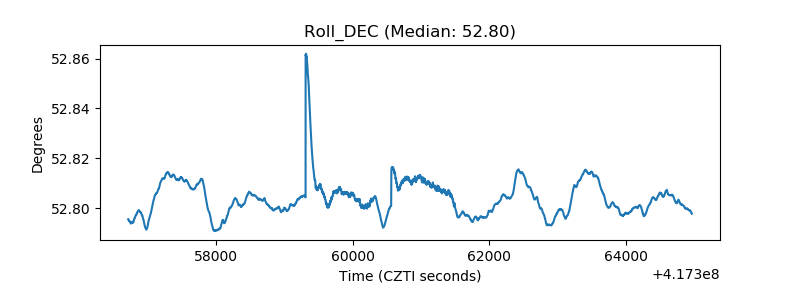 |
| _Roll_RA | 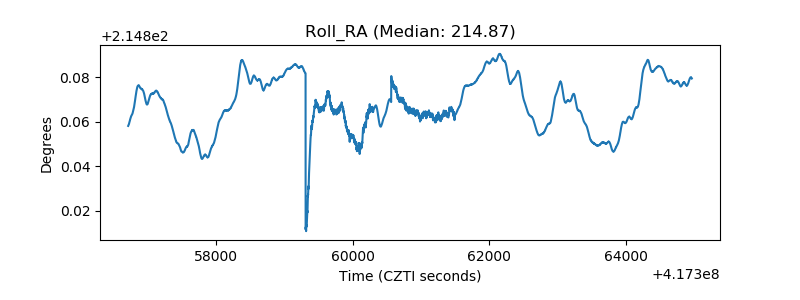 |
| Veto Counter | 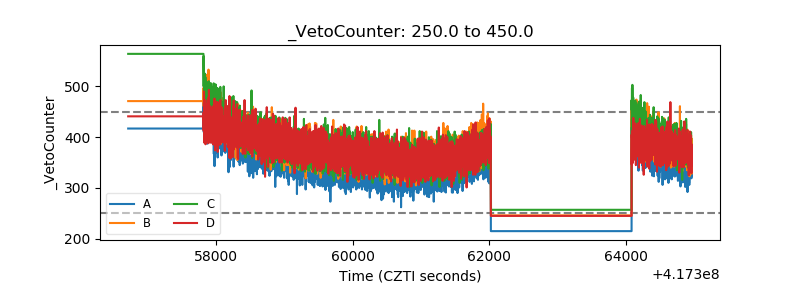 |