| Param | Original file | Final file |
|---|---|---|
| Filename | modeM0/AS1A12_022T01_9000005540_40478cztM0_level2.fits | modeM0/AS1A12_022T01_9000005540_40478cztM0_level2_quad_clean.evt |
| Size (bytes) | 300,185,280 | 84,896,640 |
| Size | 286.3 MB | 81.0 MB |
| Events in quadrant A | 2,846,951 | 581,833 |
| Events in quadrant B | 2,366,781 | 592,544 |
| Events in quadrant C | 2,607,728 | 558,723 |
| Events in quadrant D | 2,881,111 | 470,174 |
| Mode M0 | |||
|---|---|---|---|
| Quadrant | BADHDUFLAG | Total packets | Discarded packets |
| A | 0 | 11836 | 3 |
| B | 0 | 10744 | 2 |
| C | 0 | 11143 | 2 |
| D | 0 | 12282 | 2 |
| Mode M9 | |||
|---|---|---|---|
| Quadrant | BADHDUFLAG | Total packets | Discarded packets |
| A | 0 | 20 | 0 |
| B | 0 | 20 | 0 |
| C | 0 | 20 | 0 |
| D | 0 | 21 | 0 |
| Mode SS | |||
|---|---|---|---|
| Quadrant | BADHDUFLAG | Total packets | Discarded packets |
| A | 0 | 108 | 0 |
| B | 0 | 108 | 0 |
| C | 0 | 108 | 0 |
| D | 0 | 108 | 0 |
| Quadrant | Total seconds | Saturated seconds | Saturation percentage |
|---|---|---|---|
| A | 5239 | 37 | 0.706242% |
| B | 5239 | 10 | 0.190876% |
| C | 5239 | 45 | 0.858943% |
| D | 5239 | 628 | 11.987020% |
Noise dominated data is calculated using 1-second bins in cleaned event files. If a bin has >2000 counts, and if more than 50% of those come from <1% of pixels, then it is considered to be noise-dominated and hence unusable.
| Quadrant | # 1 sec bins | Bins with >0 counts | Bins with >2000 counts | High rate bins dominated by noise | Noise dominated (total time) | Noise dominated (detector-on time) | Marked lightcurve |
|---|---|---|---|---|---|---|---|
| A | 7063 | 5240 | 15 | 15 | 0.21% | 0.29% | 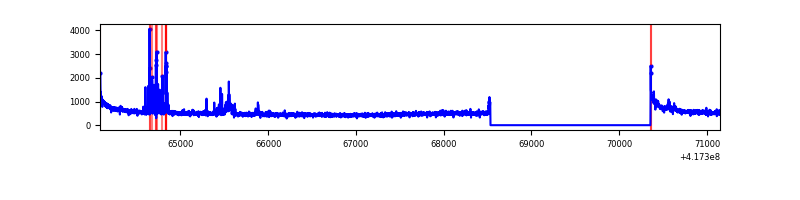 |
| B | 7063 | 5240 | 3 | 3 | 0.04% | 0.06% |  |
| C | 7063 | 5240 | 39 | 39 | 0.55% | 0.74% | 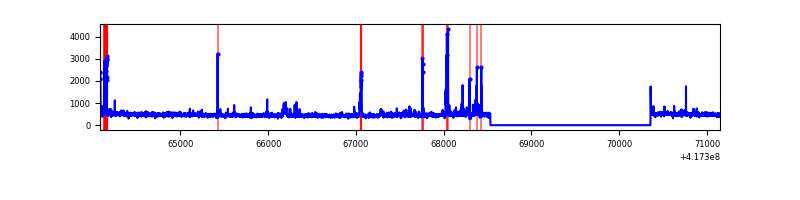 |
| D | 7063 | 5240 | 113 | 113 | 1.60% | 2.16% | 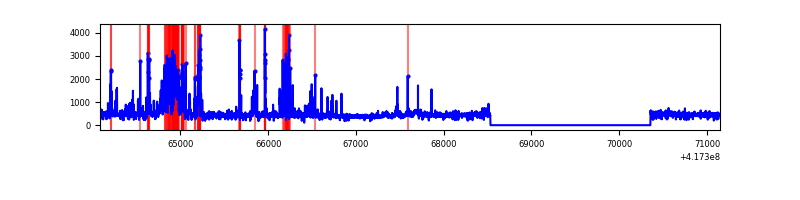 |
Top three noisy pixels from each quadrant. If the there are fewer than three noisy pixels in the level2.evt file, extra rows are filled as -1
| Pixel properties | Quadrant properties | ||||||
|---|---|---|---|---|---|---|---|
| Quadrant | DetID | PixID | Counts | Sigma | Mean | Median | Sigma |
| A | 10 | 83 | 490616 | 4297.5 | 558 | 547 | 114.0 |
| A | 13 | 248 | 110676 | 965.74 | 558 | 547 | 114.0 |
| A | 12 | 189 | 66429 | 577.73 | 558 | 547 | 114.0 |
| B | 3 | 112 | 137845 | 1268.99 | 555 | 539 | 108.2 |
| B | 5 | 255 | 20206 | 181.76 | 555 | 539 | 108.2 |
| B | 12 | 111 | 13457 | 119.39 | 555 | 539 | 108.2 |
| C | 15 | 214 | 227507 | 1769.44 | 546 | 548 | 128.3 |
| C | 14 | 254 | 226163 | 1758.96 | 546 | 548 | 128.3 |
| C | 0 | 10 | 13782 | 103.18 | 546 | 548 | 128.3 |
| D | 2 | 250 | 527178 | 4102.86 | 514 | 498 | 128.4 |
| D | 12 | 191 | 169212 | 1314.29 | 514 | 498 | 128.4 |
| D | 12 | 227 | 81386 | 630.12 | 514 | 498 | 128.4 |
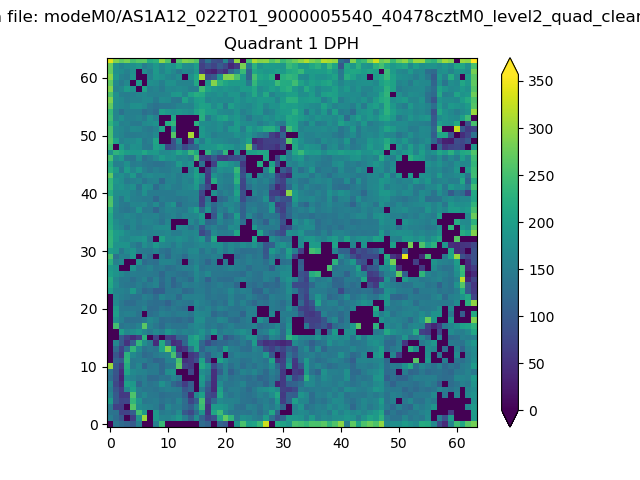
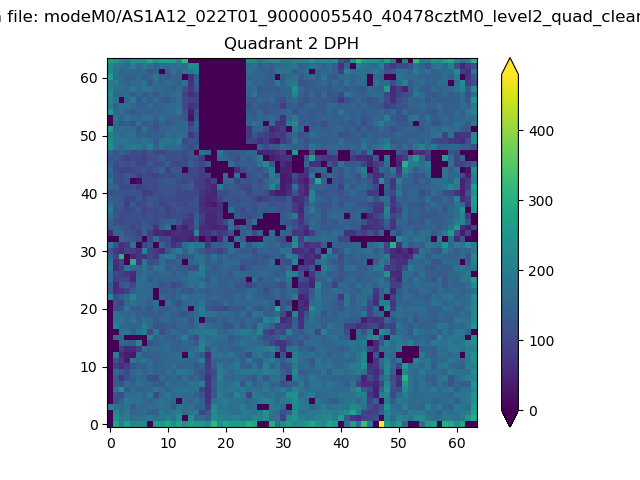
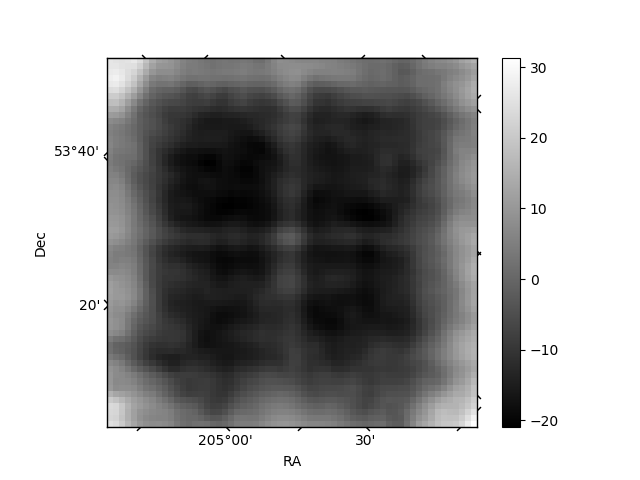
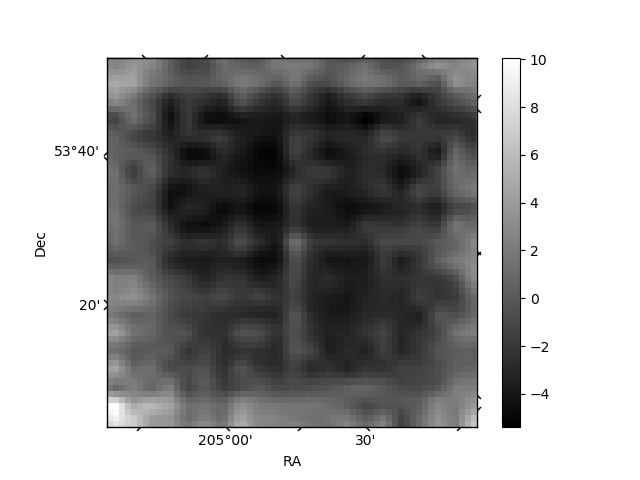
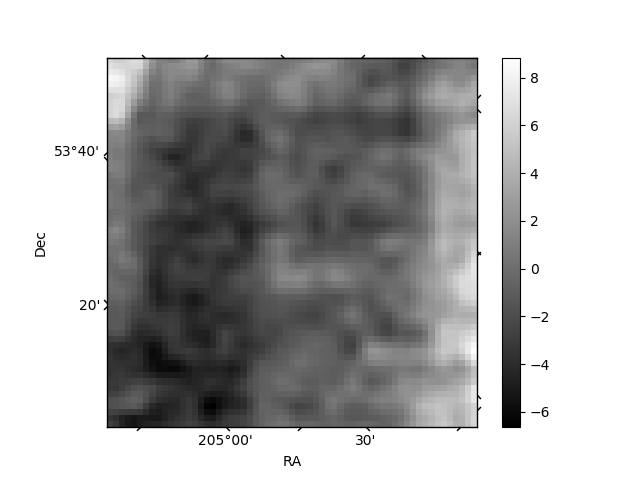
Histogram calculated using DETX and DETY for each event in the final _common_clean file
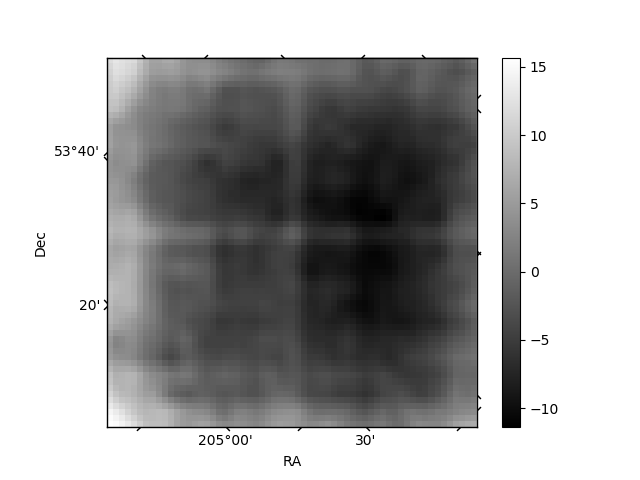
| Quadrant A | 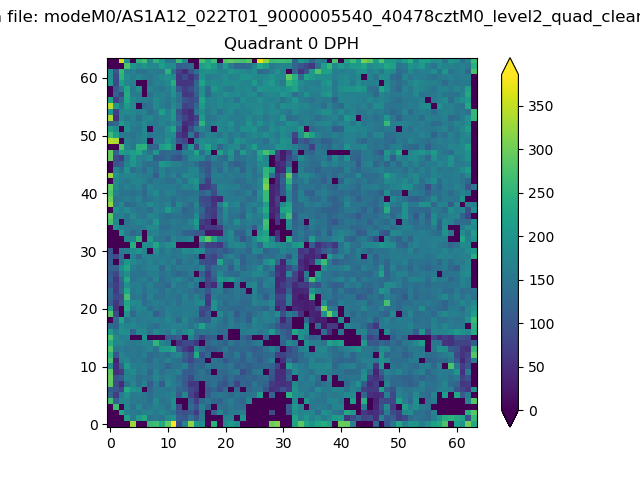 |
 |
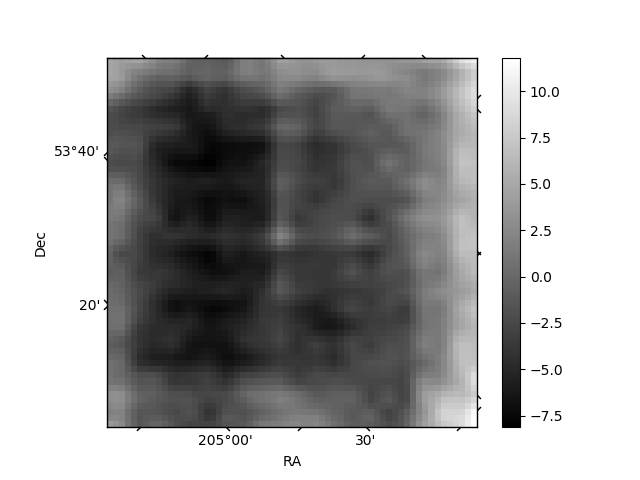
Quadrant B |
|---|---|---|---|
| Quadrant D | 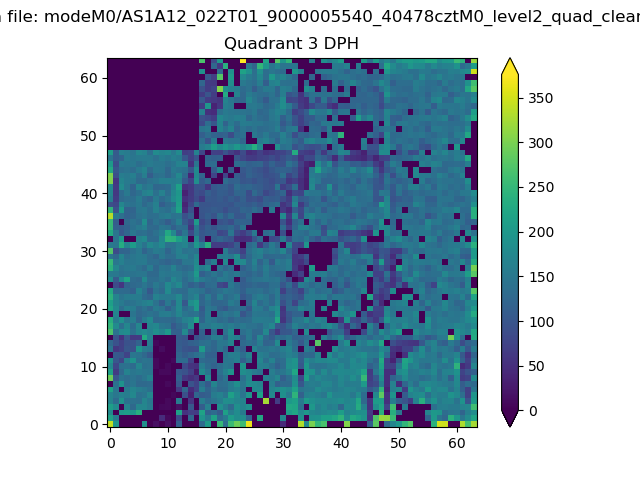 |
 |
Quadrant C |
| Plot type | Count rate plots | Images |
|---|---|---|
| Comparison with Poisson distribution Blue bars denote a histogram of data divided into 1 sec bins. Red curve is a Poisson curve with rate = median count rate of data. |
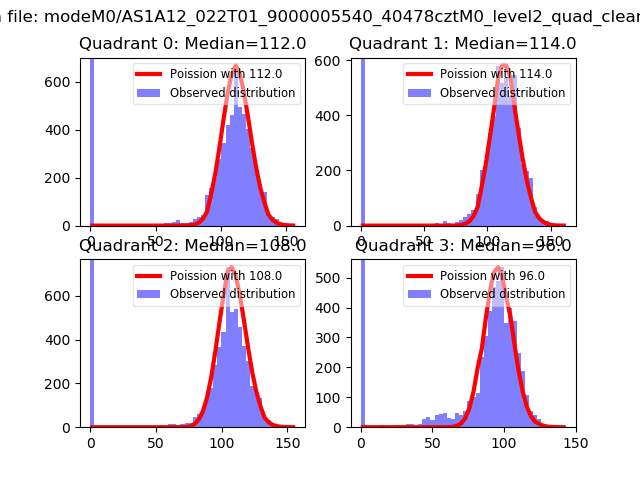 |
 |
| Quadrant-wise count rates Data is divided into 100 sec bins |
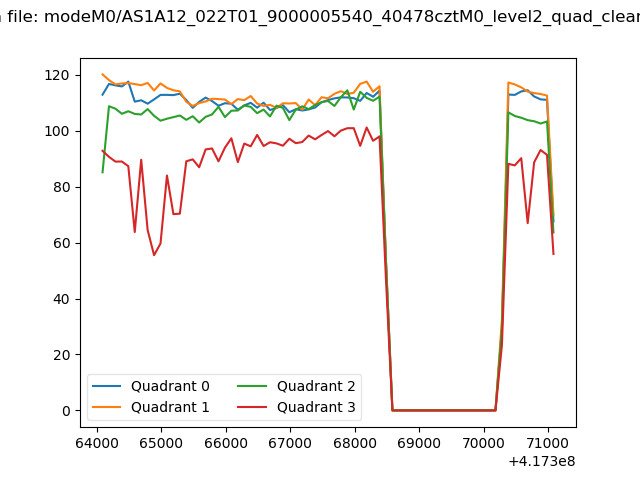 |
|
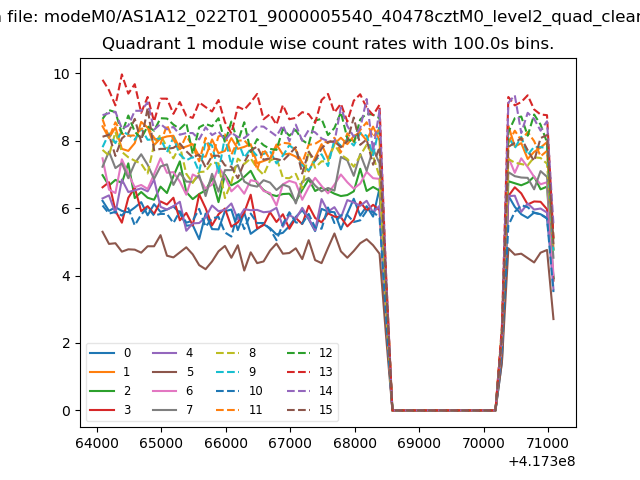
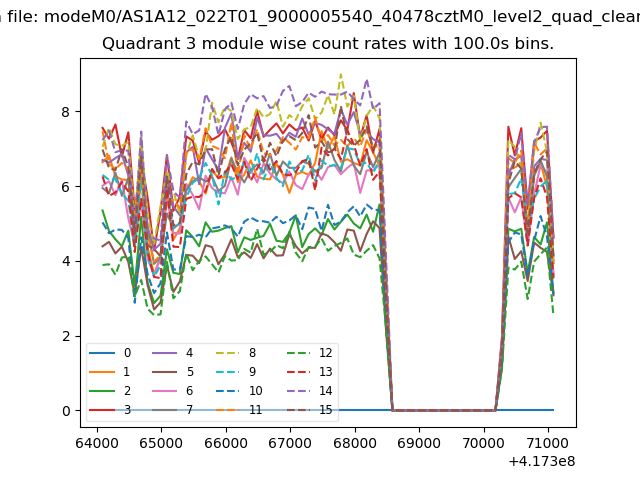
| Module-wise count rates for Quadrant A Data is divided into 100 sec bins |
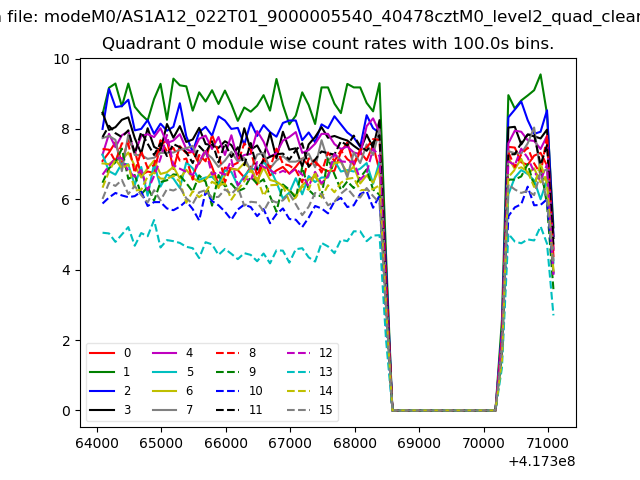 |
 |
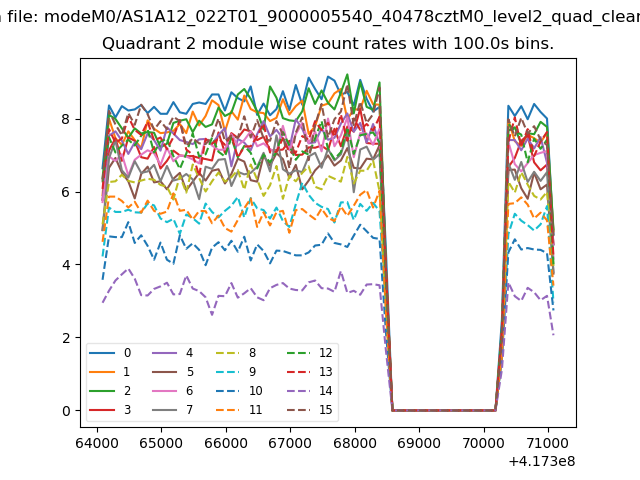
| Module-wise count rates for Quadrant B Data is divided into 100 sec bins |
 |
 |
| Module-wise count rates for Quadrant C Data is divided into 100 sec bins |
 |
 |
| Module-wise count rates for Quadrant D Data is divided into 100 sec bins |
 |
 |
| Parameter | Plot |
|---|---|
| CZT HV Monitor | 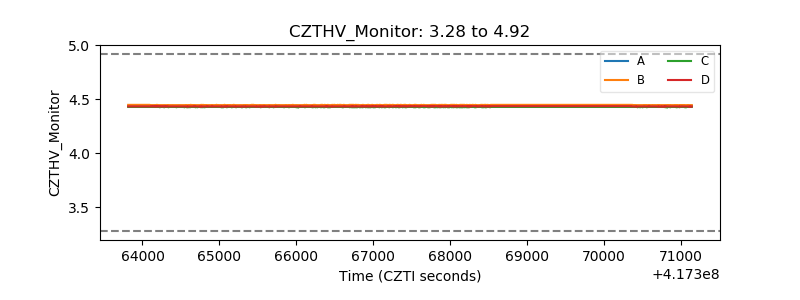 |
| D_VDD | 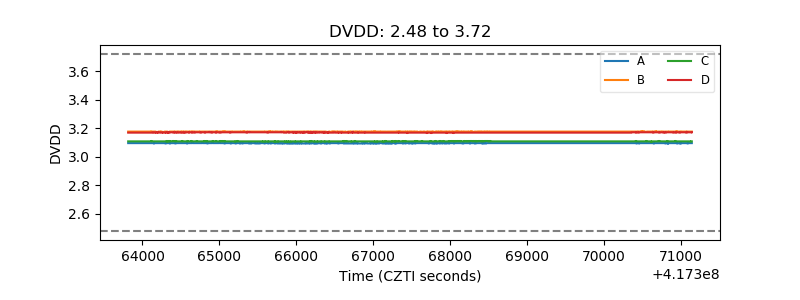 |
| Temperature 1 | 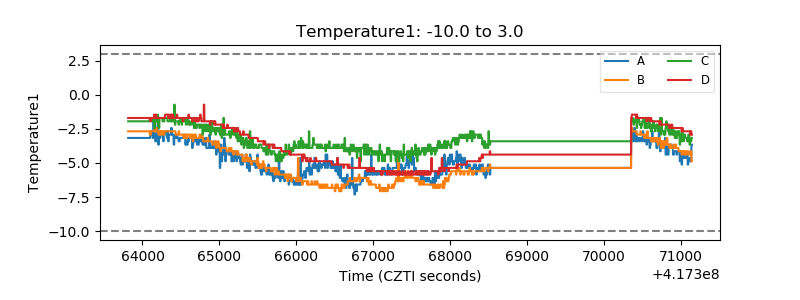 |
| Veto HV Monitor | 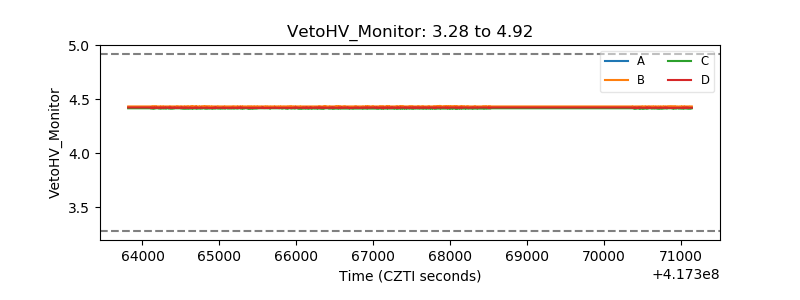 |
| Veto LLD | 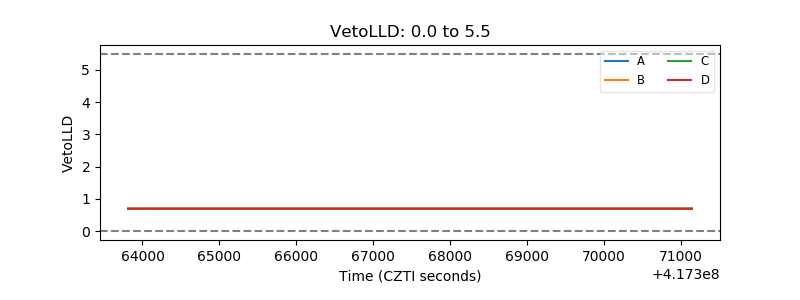 |
| Alpha Counter | 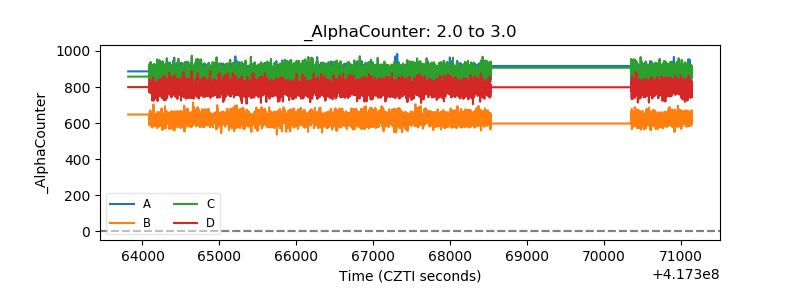 |
| _CPM_Rate | 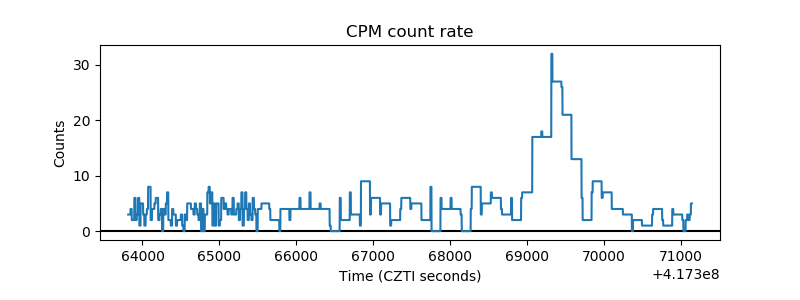 |
| CZT Counter | 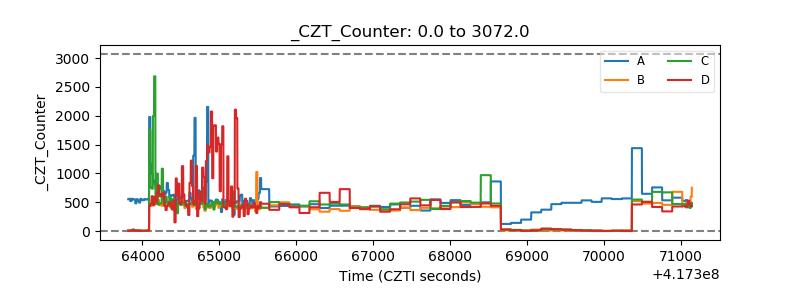 |
| +2.5 Volts monitor | 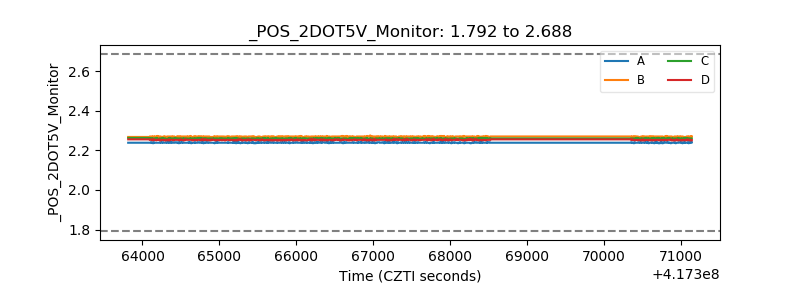 |
| +5 Volts monitor | 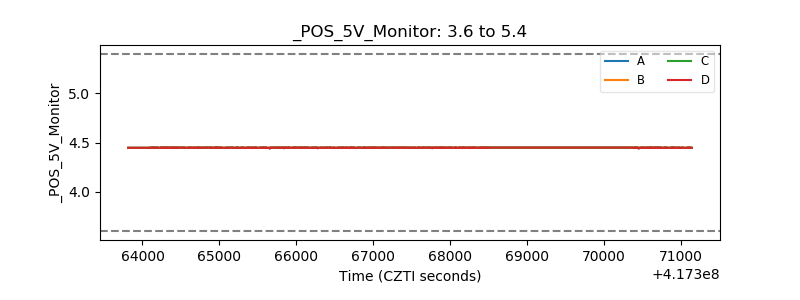 |
| _ROLL_ROT | 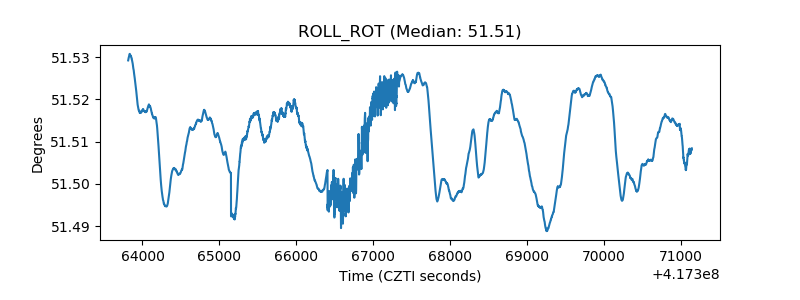 |
| _Roll_DEC | 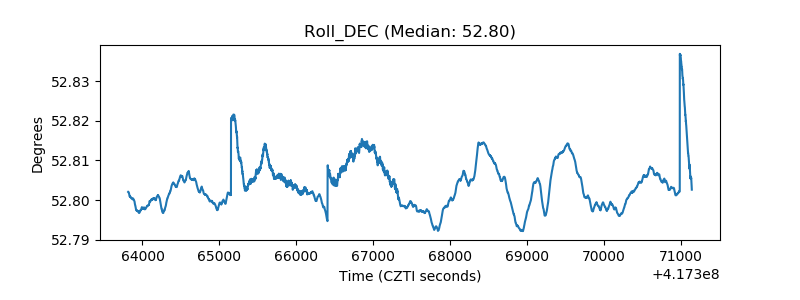 |
| _Roll_RA | 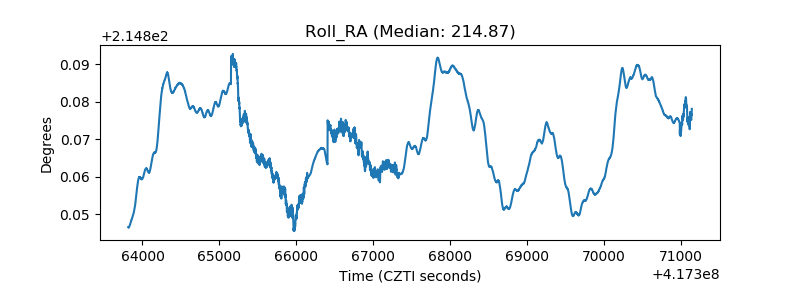 |
| Veto Counter |  |