| Param | Original file | Final file |
|---|---|---|
| Filename | modeM0/AS1A12_022T01_9000005540_40479cztM0_level2.fits | modeM0/AS1A12_022T01_9000005540_40479cztM0_level2_quad_clean.evt |
| Size (bytes) | 302,290,560 | 88,447,680 |
| Size | 288.3 MB | 84.4 MB |
| Events in quadrant A | 2,800,018 | 601,933 |
| Events in quadrant B | 2,390,277 | 614,537 |
| Events in quadrant C | 2,575,691 | 588,309 |
| Events in quadrant D | 2,992,939 | 487,224 |
| Mode M0 | |||
|---|---|---|---|
| Quadrant | BADHDUFLAG | Total packets | Discarded packets |
| A | 0 | 11896 | 3 |
| B | 0 | 11124 | 2 |
| C | 0 | 11294 | 2 |
| D | 0 | 12880 | 2 |
| Mode M9 | |||
|---|---|---|---|
| Quadrant | BADHDUFLAG | Total packets | Discarded packets |
| A | 0 | 32 | 0 |
| B | 0 | 32 | 0 |
| C | 0 | 32 | 0 |
| D | 0 | 32 | 0 |
| Mode SS | |||
|---|---|---|---|
| Quadrant | BADHDUFLAG | Total packets | Discarded packets |
| A | 0 | 112 | 0 |
| B | 0 | 112 | 0 |
| C | 0 | 112 | 0 |
| D | 0 | 112 | 0 |
| Quadrant | Total seconds | Saturated seconds | Saturation percentage |
|---|---|---|---|
| A | 5516 | 14 | 0.253807% |
| B | 5516 | 5 | 0.090645% |
| C | 5516 | 5 | 0.090645% |
| D | 5516 | 662 | 12.001450% |
Noise dominated data is calculated using 1-second bins in cleaned event files. If a bin has >2000 counts, and if more than 50% of those come from <1% of pixels, then it is considered to be noise-dominated and hence unusable.
| Quadrant | # 1 sec bins | Bins with >0 counts | Bins with >2000 counts | High rate bins dominated by noise | Noise dominated (total time) | Noise dominated (detector-on time) | Marked lightcurve |
|---|---|---|---|---|---|---|---|
| A | 7009 | 5517 | 4 | 4 | 0.06% | 0.07% | 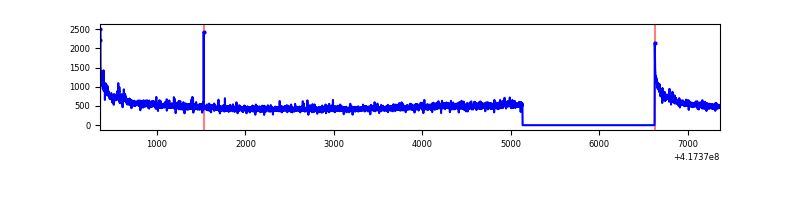 |
| B | 7009 | 5517 | 0 | 0 | 0.00% | 0.00% | 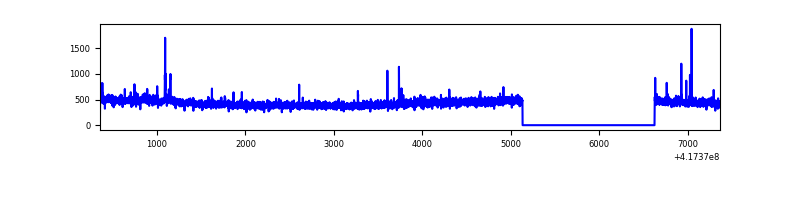 |
| C | 7009 | 5517 | 2 | 2 | 0.03% | 0.04% | 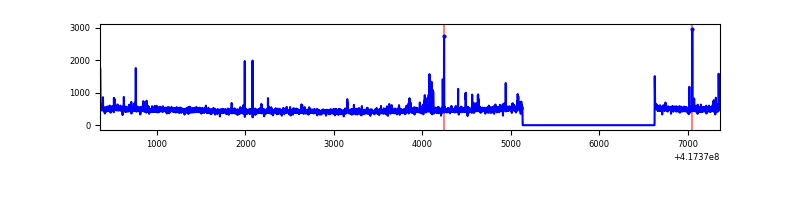 |
| D | 7008 | 5516 | 124 | 124 | 1.77% | 2.25% | 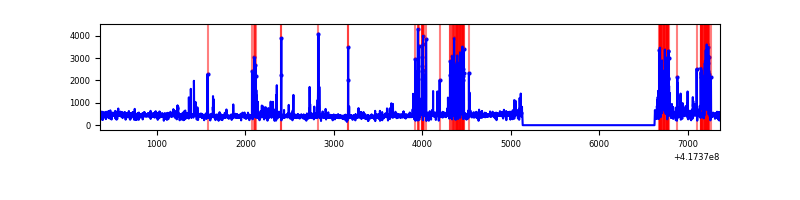 |
Top three noisy pixels from each quadrant. If the there are fewer than three noisy pixels in the level2.evt file, extra rows are filled as -1
| Pixel properties | Quadrant properties | ||||||
|---|---|---|---|---|---|---|---|
| Quadrant | DetID | PixID | Counts | Sigma | Mean | Median | Sigma |
| A | 10 | 83 | 495765 | 4085.53 | 585 | 573 | 121.2 |
| A | 12 | 189 | 26515 | 214.03 | 585 | 573 | 121.2 |
| A | 13 | 6 | 9456 | 73.28 | 585 | 573 | 121.2 |
| B | 3 | 112 | 67086 | 590.42 | 581 | 564 | 112.7 |
| B | 4 | 171 | 25044 | 217.28 | 581 | 564 | 112.7 |
| B | 12 | 111 | 14288 | 121.81 | 581 | 564 | 112.7 |
| C | 15 | 214 | 241052 | 1779.7 | 575 | 579 | 135.1 |
| C | 14 | 254 | 54803 | 401.3 | 575 | 579 | 135.1 |
| C | 9 | 187 | 15587 | 111.07 | 575 | 579 | 135.1 |
| D | 2 | 250 | 548308 | 4178.54 | 534 | 519 | 131.1 |
| D | 12 | 191 | 180276 | 1371.19 | 534 | 519 | 131.1 |
| D | 12 | 227 | 55758 | 421.36 | 534 | 519 | 131.1 |
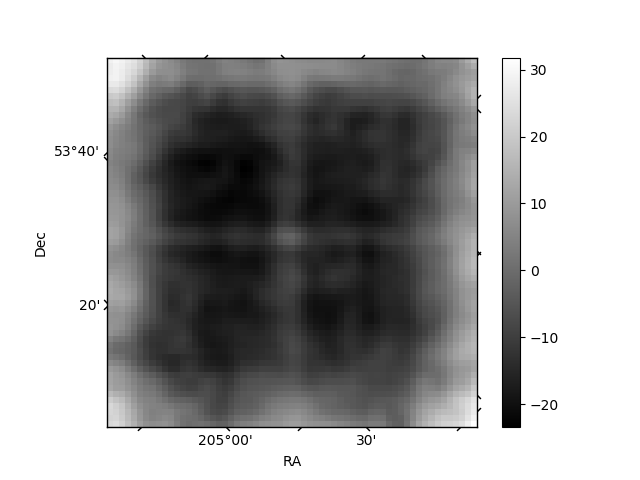
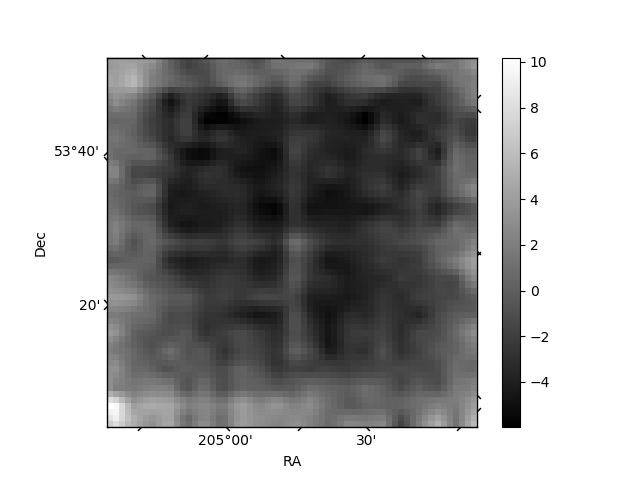
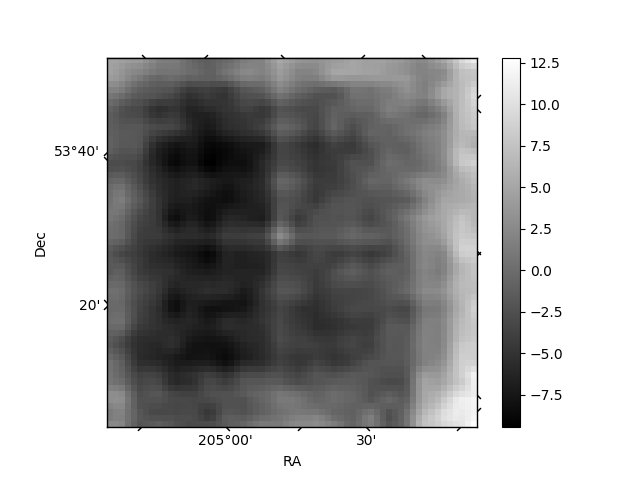
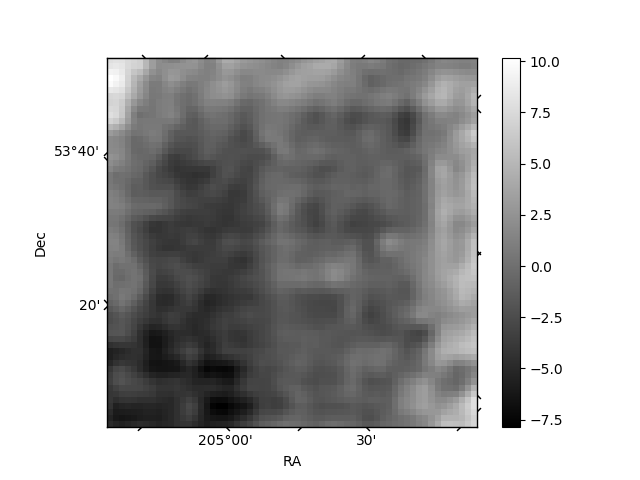
Histogram calculated using DETX and DETY for each event in the final _common_clean file
| Quadrant A | 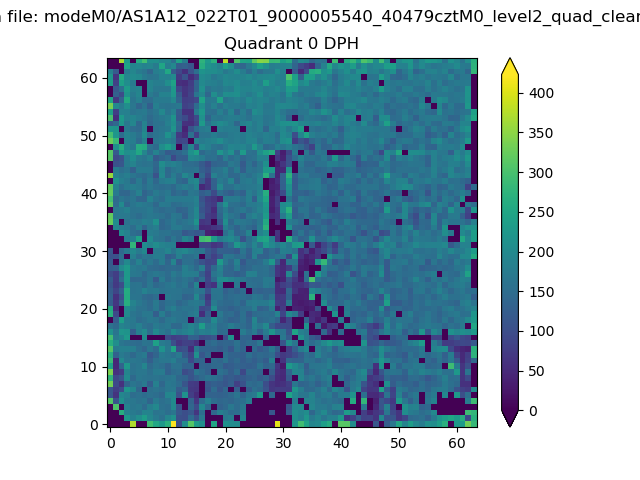 |
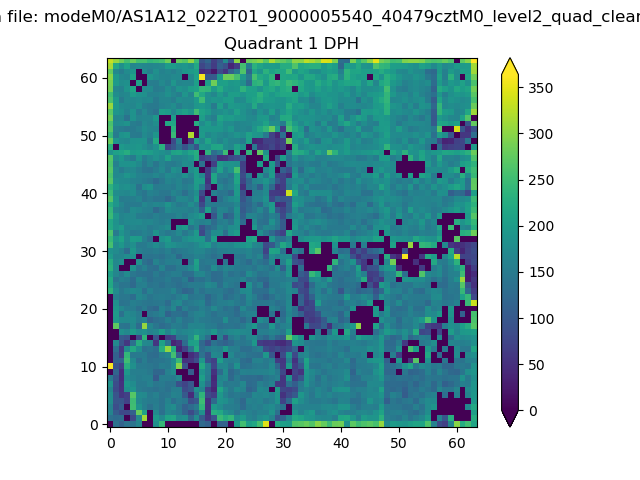 |
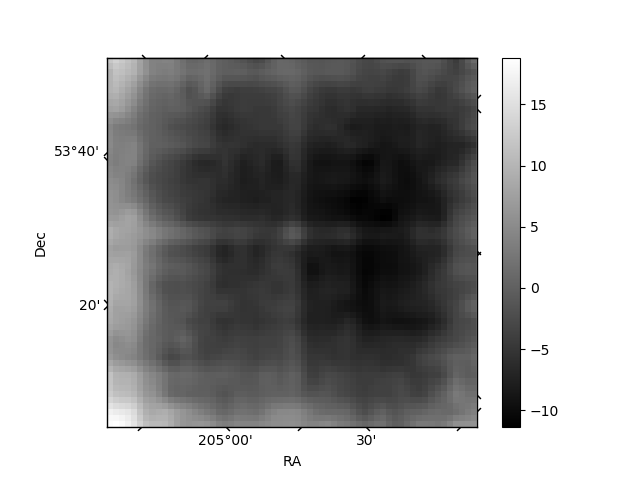
Quadrant B |
|---|---|---|---|
| Quadrant D | 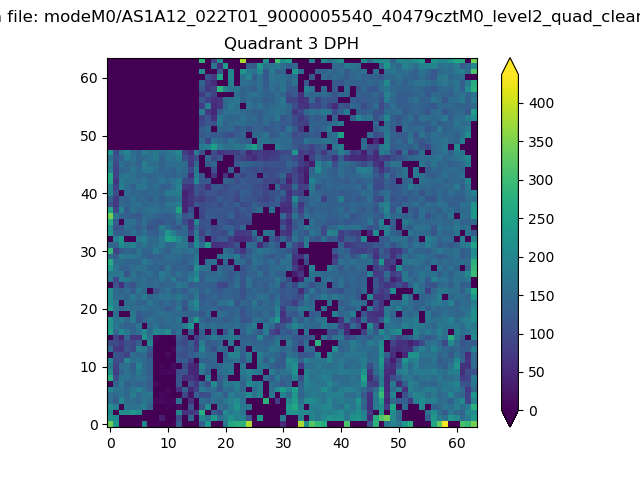 |
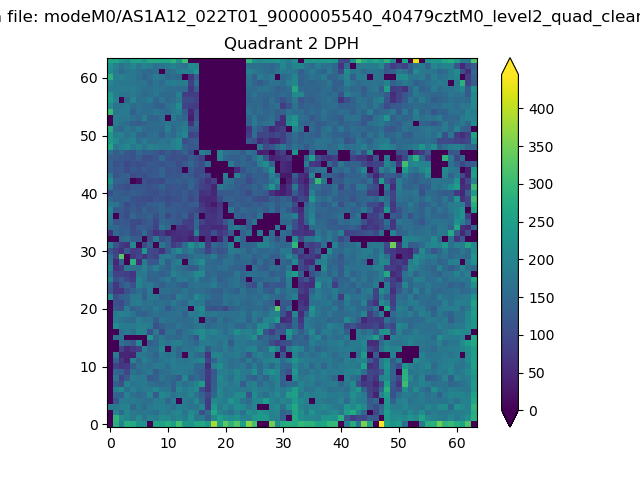 |
Quadrant C |
| Plot type | Count rate plots | Images |
|---|---|---|
| Comparison with Poisson distribution Blue bars denote a histogram of data divided into 1 sec bins. Red curve is a Poisson curve with rate = median count rate of data. |
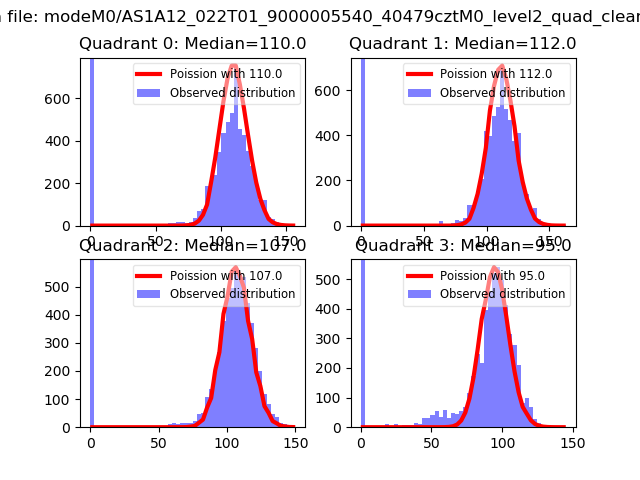 |
 |
| Quadrant-wise count rates Data is divided into 100 sec bins |
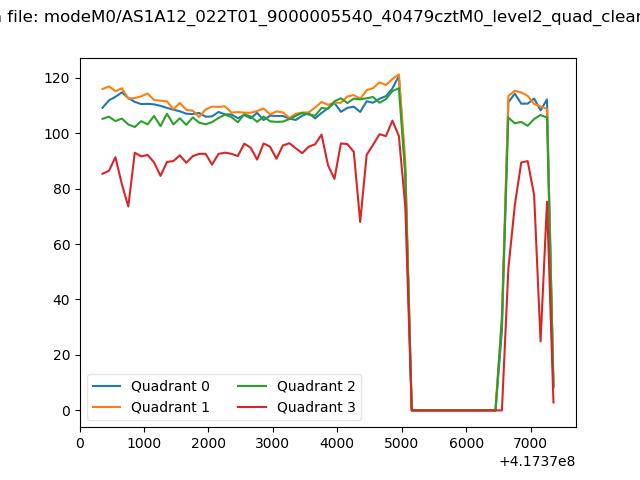 |
|
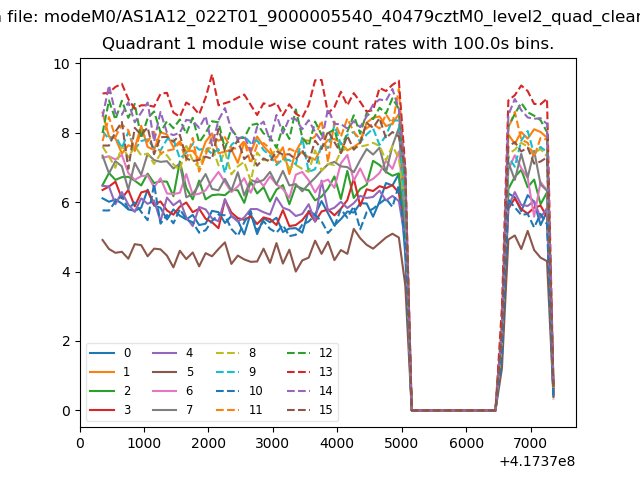
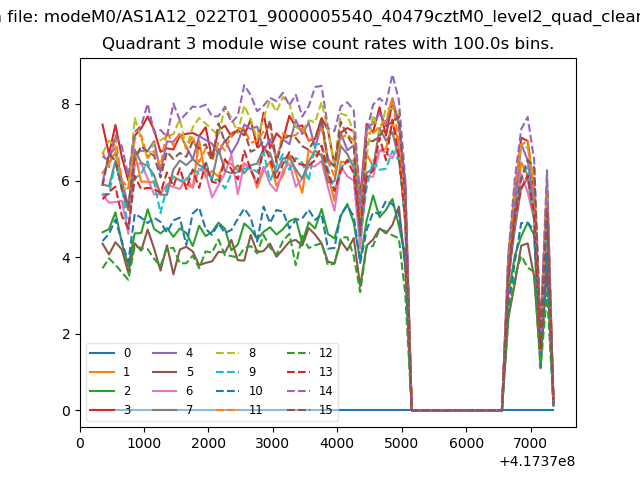
| Module-wise count rates for Quadrant A Data is divided into 100 sec bins |
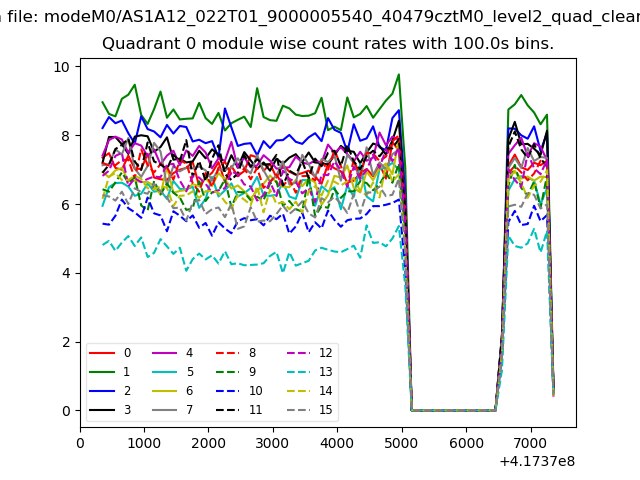 |
 |
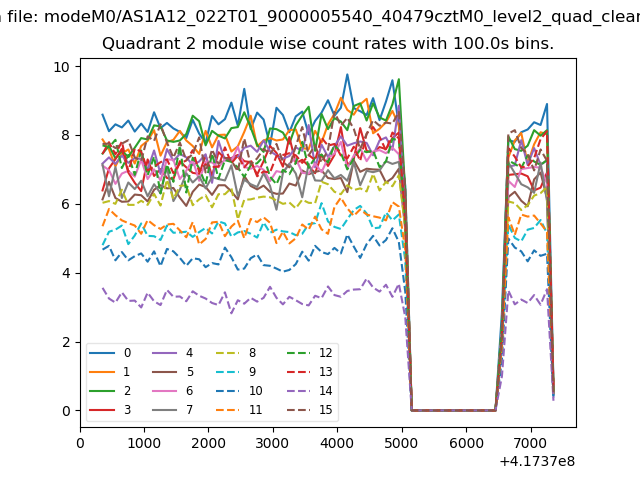
| Module-wise count rates for Quadrant B Data is divided into 100 sec bins |
 |
 |
| Module-wise count rates for Quadrant C Data is divided into 100 sec bins |
 |
 |
| Module-wise count rates for Quadrant D Data is divided into 100 sec bins |
 |
 |
| Parameter | Plot |
|---|---|
| CZT HV Monitor | 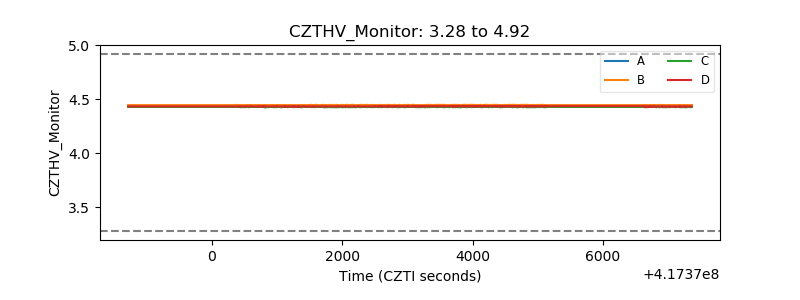 |
| D_VDD | 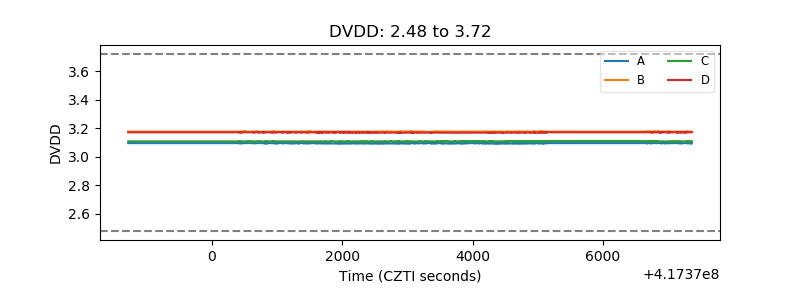 |
| Temperature 1 | 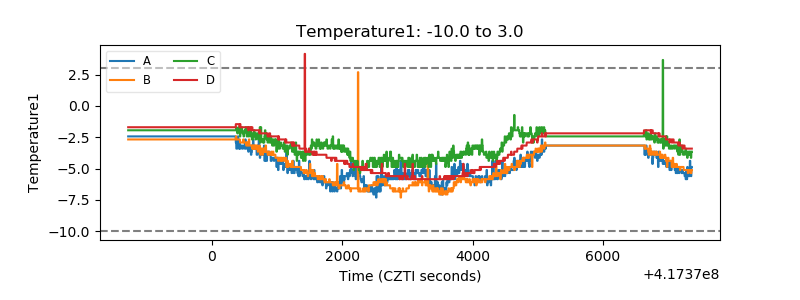 |
| Veto HV Monitor | 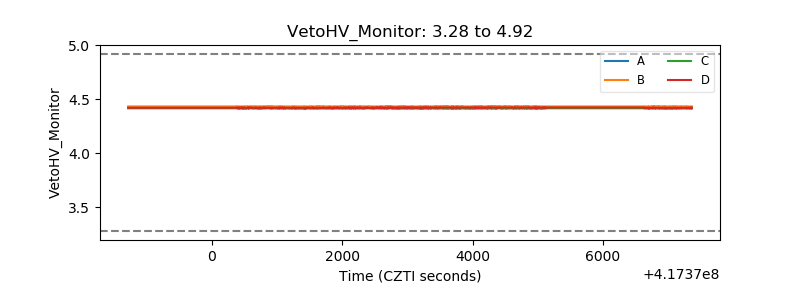 |
| Veto LLD | 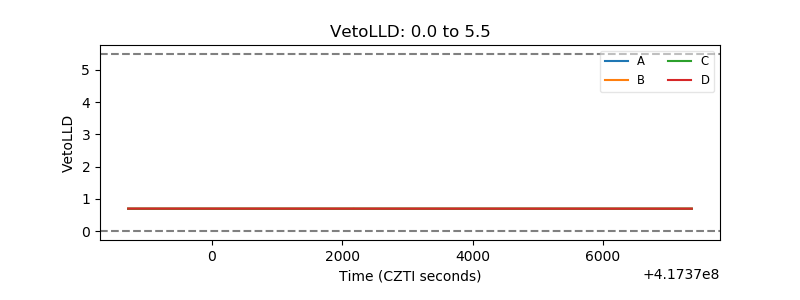 |
| Alpha Counter |  |
| _CPM_Rate | 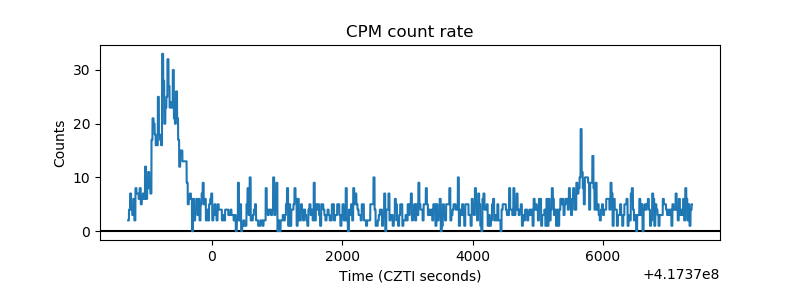 |
| CZT Counter | 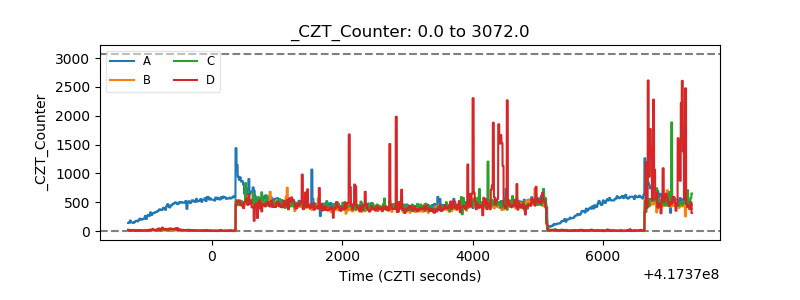 |
| +2.5 Volts monitor | 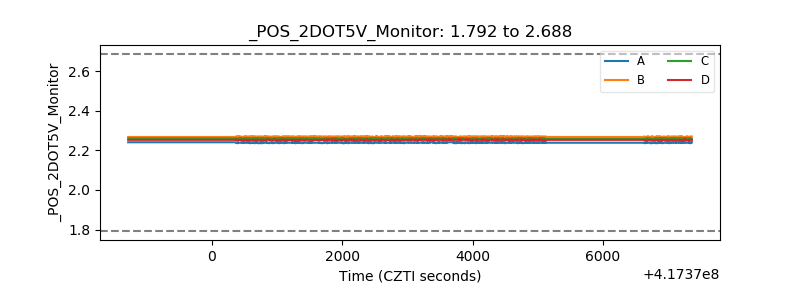 |
| +5 Volts monitor |  |
| _ROLL_ROT | 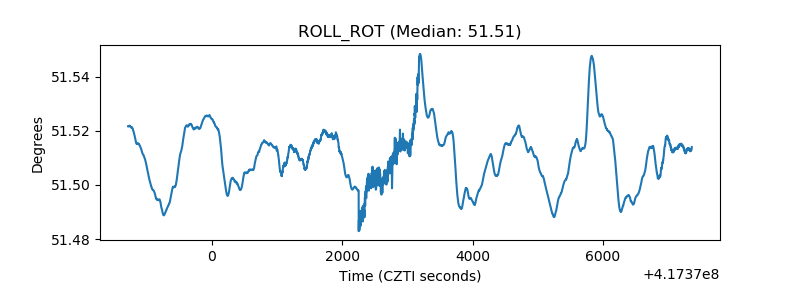 |
| _Roll_DEC | 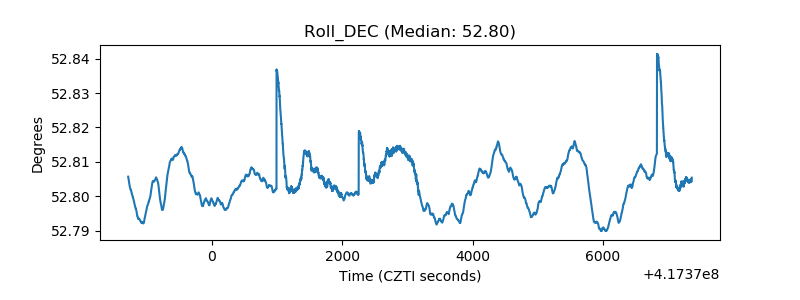 |
| _Roll_RA | 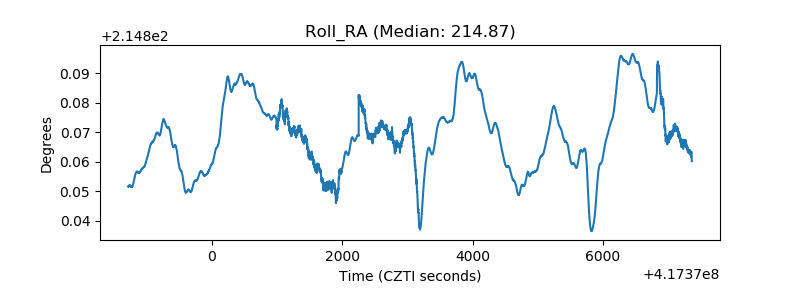 |
| Veto Counter | 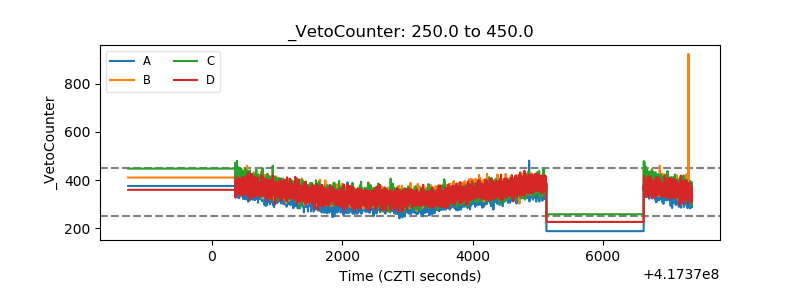 |