| Param | Original file | Final file |
|---|---|---|
| Filename | modeM0/AS1A12_022T01_9000005540_40480cztM0_level2.fits | modeM0/AS1A12_022T01_9000005540_40480cztM0_level2_quad_clean.evt |
| Size (bytes) | 335,839,680 | 92,606,400 |
| Size | 320.3 MB | 88.3 MB |
| Events in quadrant A | 2,976,311 | 638,222 |
| Events in quadrant B | 2,645,564 | 643,463 |
| Events in quadrant C | 2,834,870 | 626,425 |
| Events in quadrant D | 3,513,463 | 483,023 |
| Mode M0 | |||
|---|---|---|---|
| Quadrant | BADHDUFLAG | Total packets | Discarded packets |
| A | 0 | 12658 | 3 |
| B | 0 | 12302 | 2 |
| C | 0 | 12321 | 2 |
| D | 0 | 14666 | 2 |
| Mode M9 | |||
|---|---|---|---|
| Quadrant | BADHDUFLAG | Total packets | Discarded packets |
| A | 0 | 23 | 0 |
| B | 0 | 23 | 0 |
| C | 0 | 23 | 0 |
| D | 0 | 24 | 0 |
| Mode SS | |||
|---|---|---|---|
| Quadrant | BADHDUFLAG | Total packets | Discarded packets |
| A | 0 | 120 | 0 |
| B | 0 | 120 | 0 |
| C | 0 | 120 | 0 |
| D | 0 | 120 | 0 |
| Quadrant | Total seconds | Saturated seconds | Saturation percentage |
|---|---|---|---|
| A | 5908 | 11 | 0.186188% |
| B | 5908 | 60 | 1.015572% |
| C | 5908 | 11 | 0.186188% |
| D | 5908 | 1183 | 20.023697% |
Noise dominated data is calculated using 1-second bins in cleaned event files. If a bin has >2000 counts, and if more than 50% of those come from <1% of pixels, then it is considered to be noise-dominated and hence unusable.
| Quadrant | # 1 sec bins | Bins with >0 counts | Bins with >2000 counts | High rate bins dominated by noise | Noise dominated (total time) | Noise dominated (detector-on time) | Marked lightcurve |
|---|---|---|---|---|---|---|---|
| A | 7251 | 5909 | 3 | 3 | 0.04% | 0.05% | 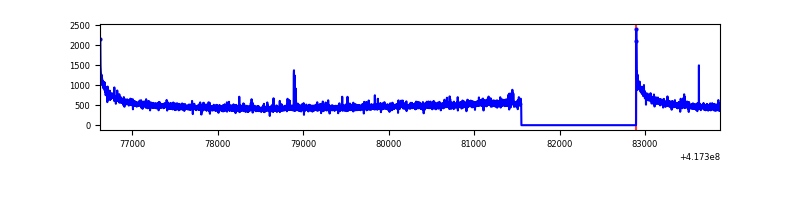 |
| B | 7251 | 5909 | 51 | 51 | 0.70% | 0.86% | 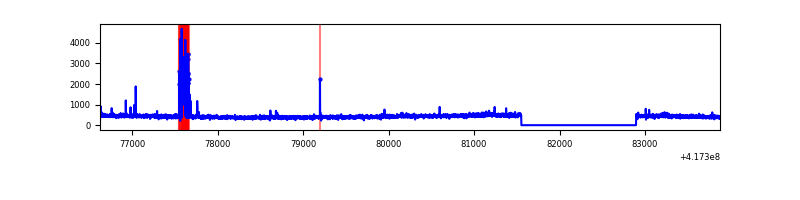 |
| C | 7251 | 5909 | 7 | 7 | 0.10% | 0.12% | 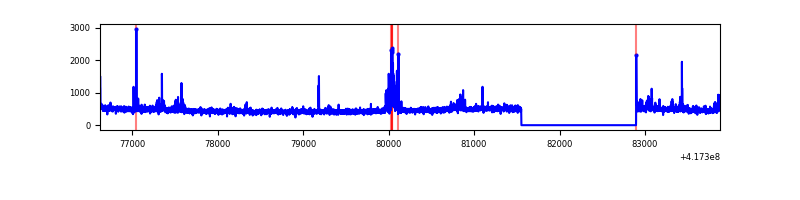 |
| D | 7251 | 5908 | 184 | 184 | 2.54% | 3.11% | 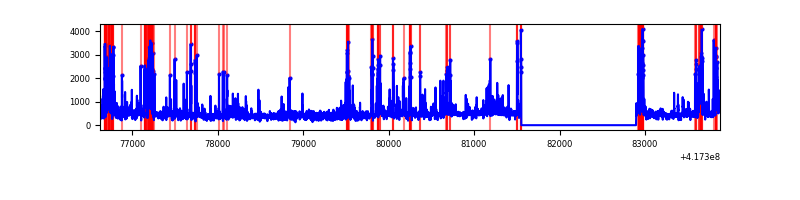 |
Top three noisy pixels from each quadrant. If the there are fewer than three noisy pixels in the level2.evt file, extra rows are filled as -1
| Pixel properties | Quadrant properties | ||||||
|---|---|---|---|---|---|---|---|
| Quadrant | DetID | PixID | Counts | Sigma | Mean | Median | Sigma |
| A | 10 | 83 | 512060 | 4010.42 | 622 | 612 | 127.5 |
| A | 12 | 189 | 28687 | 220.14 | 622 | 612 | 127.5 |
| A | 9 | 191 | 17474 | 132.22 | 622 | 612 | 127.5 |
| B | 10 | 246 | 156015 | 1297.98 | 617 | 599 | 119.7 |
| B | 3 | 112 | 30544 | 250.09 | 617 | 599 | 119.7 |
| B | 5 | 255 | 15998 | 128.61 | 617 | 599 | 119.7 |
| C | 15 | 214 | 255861 | 1777.6 | 612 | 615 | 143.6 |
| C | 9 | 187 | 85441 | 590.75 | 612 | 615 | 143.6 |
| C | 10 | 20 | 79514 | 549.47 | 612 | 615 | 143.6 |
| D | 2 | 250 | 442145 | 3257.22 | 547 | 531 | 135.6 |
| D | 12 | 227 | 381038 | 2806.51 | 547 | 531 | 135.6 |
| D | 12 | 191 | 252148 | 1855.86 | 547 | 531 | 135.6 |
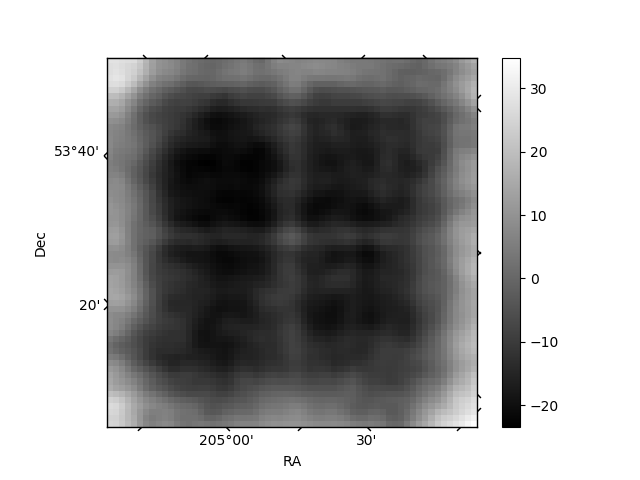
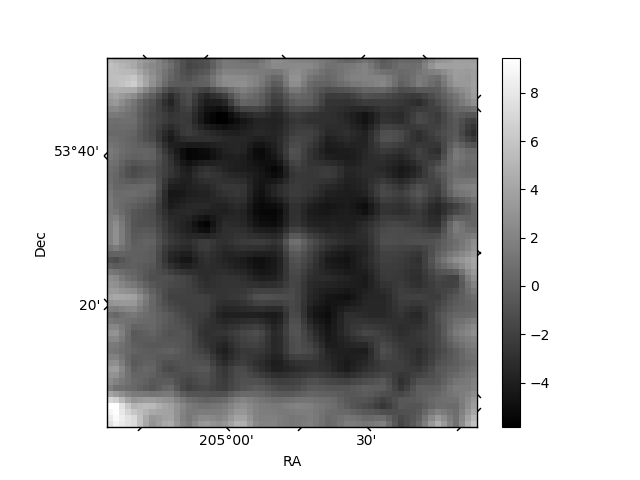
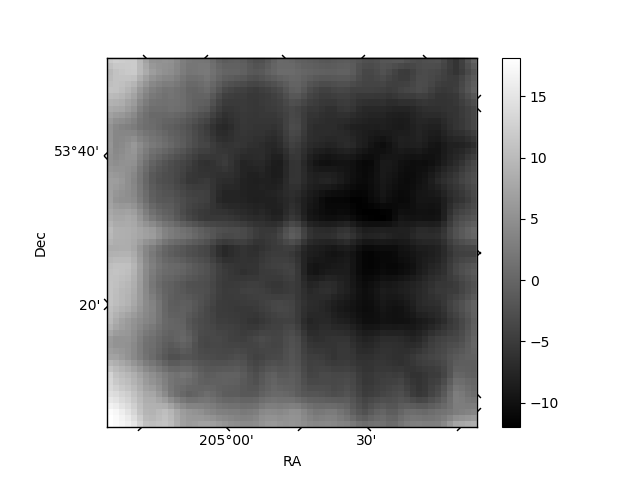
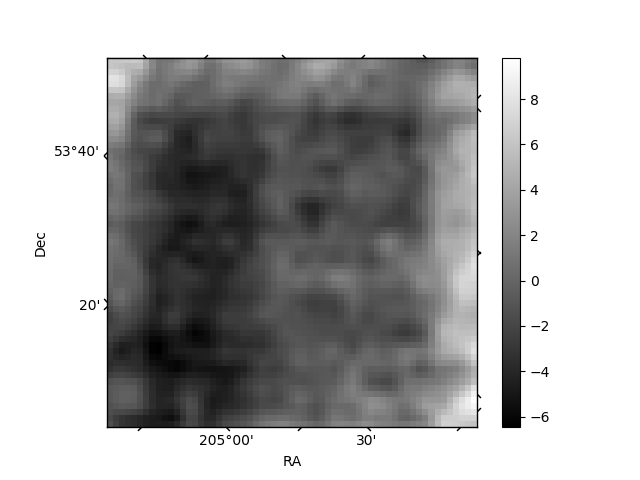
Histogram calculated using DETX and DETY for each event in the final _common_clean file
| Quadrant A | 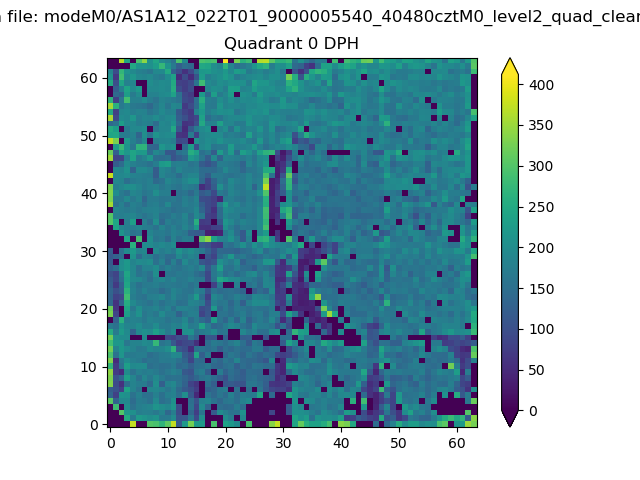 |
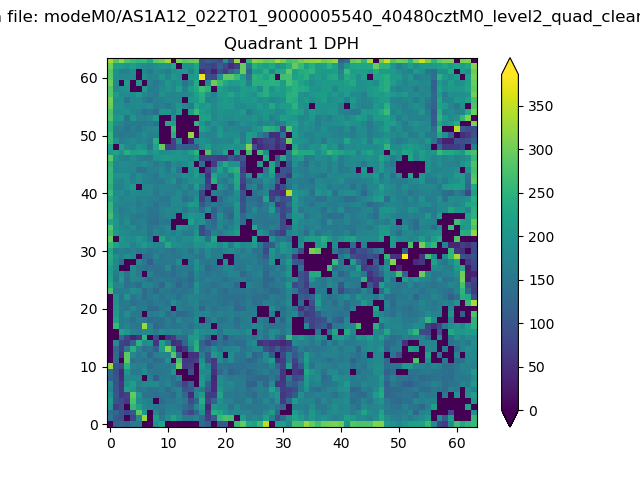 |
Quadrant B |
|---|---|---|---|
| Quadrant D | 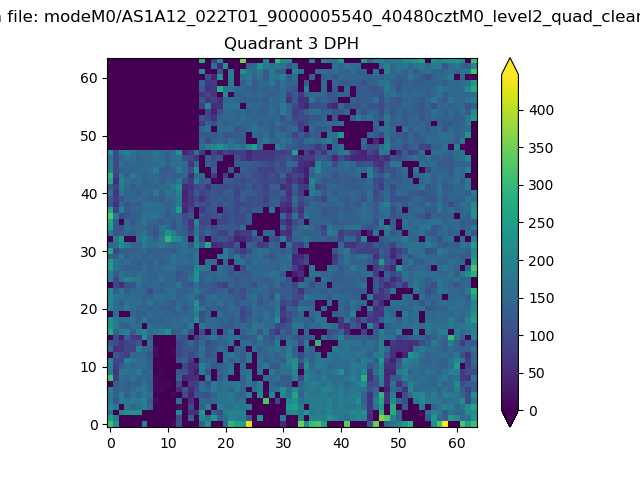 |
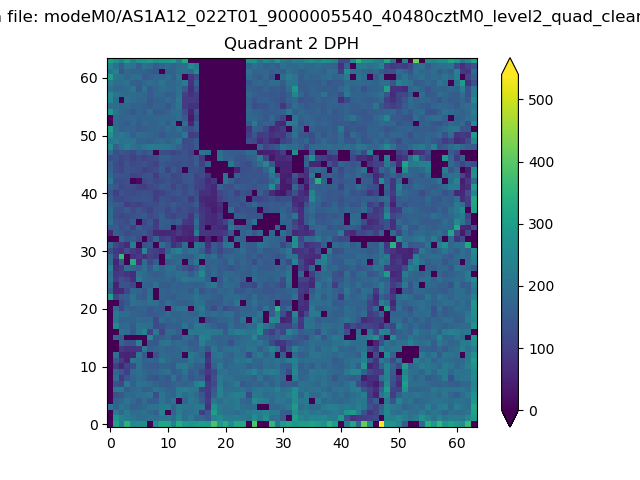 |
Quadrant C |
| Plot type | Count rate plots | Images |
|---|---|---|
| Comparison with Poisson distribution Blue bars denote a histogram of data divided into 1 sec bins. Red curve is a Poisson curve with rate = median count rate of data. |
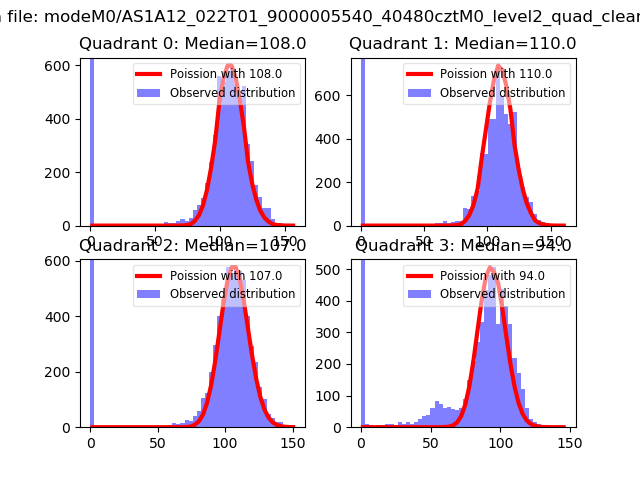 |
 |
| Quadrant-wise count rates Data is divided into 100 sec bins |
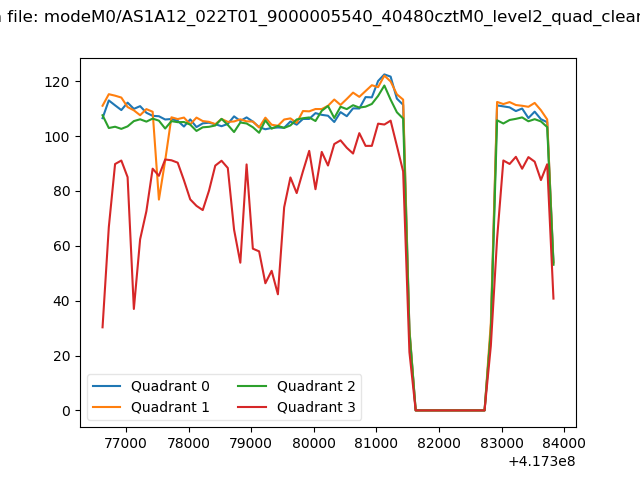 |
|
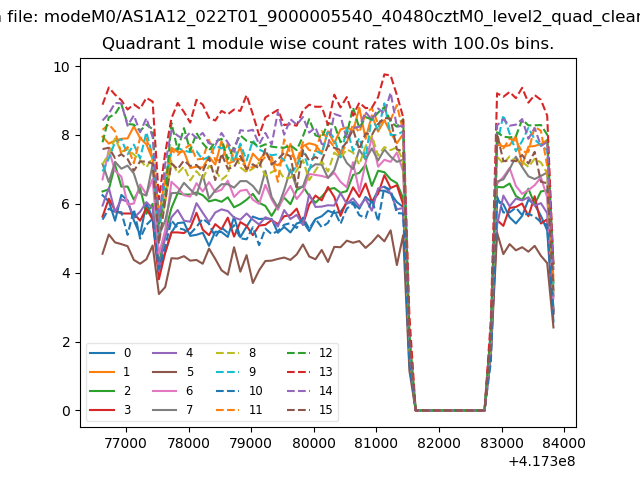
| Module-wise count rates for Quadrant A Data is divided into 100 sec bins |
 |
 |
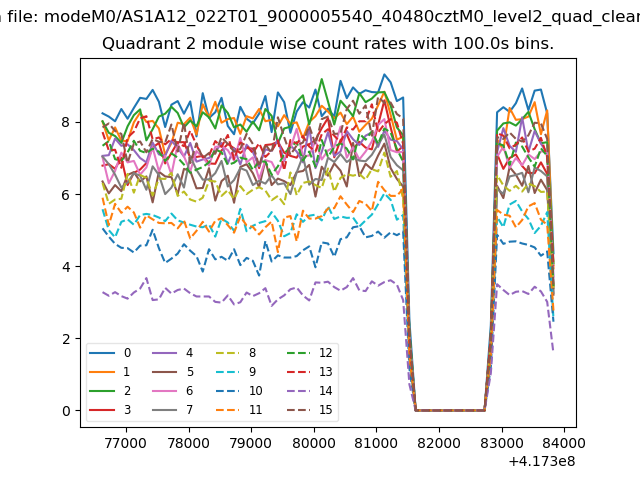
| Module-wise count rates for Quadrant B Data is divided into 100 sec bins |
 |
 |
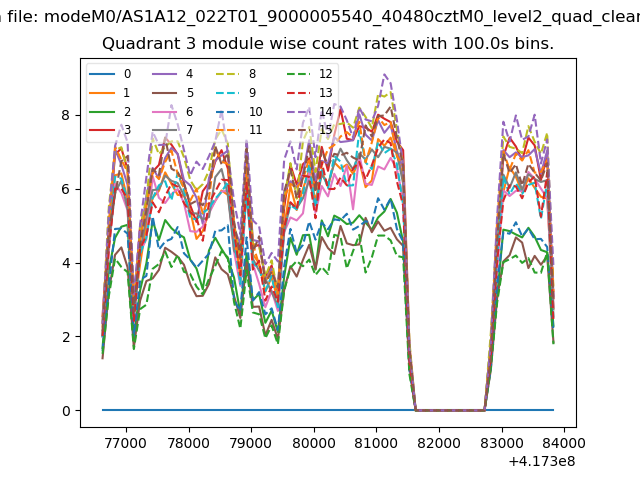
| Module-wise count rates for Quadrant C Data is divided into 100 sec bins |
 |
 |
| Module-wise count rates for Quadrant D Data is divided into 100 sec bins |
 |
 |
| Parameter | Plot |
|---|---|
| CZT HV Monitor | 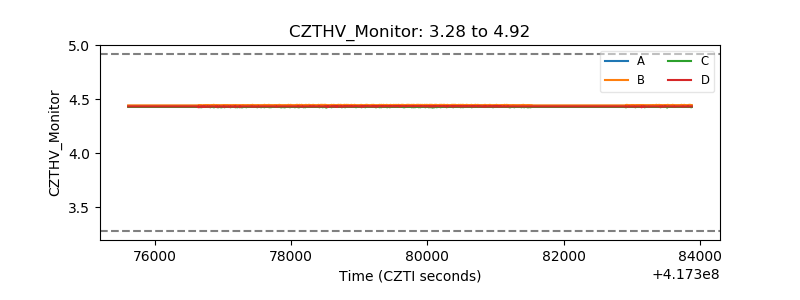 |
| D_VDD | 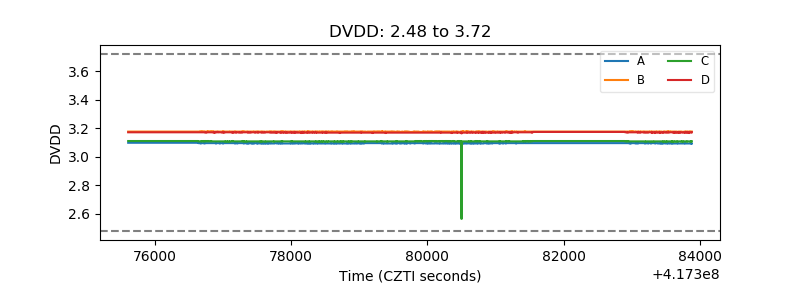 |
| Temperature 1 | 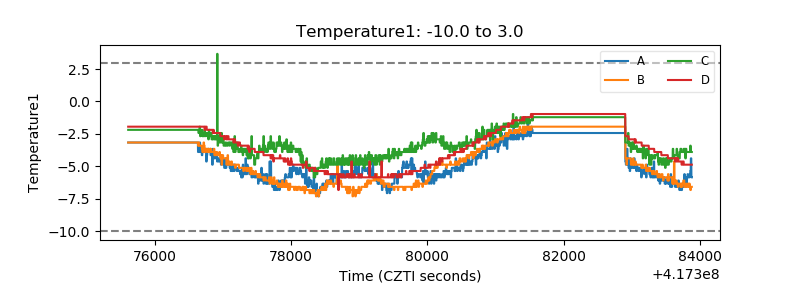 |
| Veto HV Monitor | 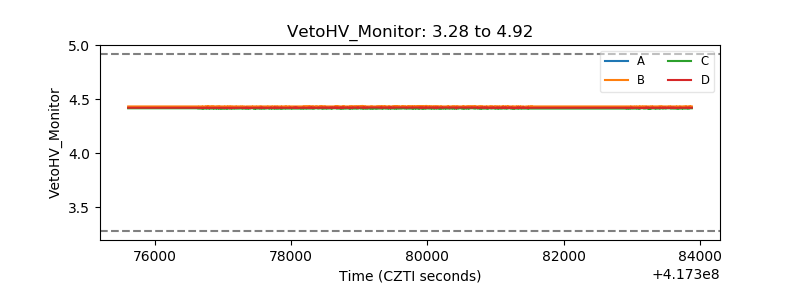 |
| Veto LLD | 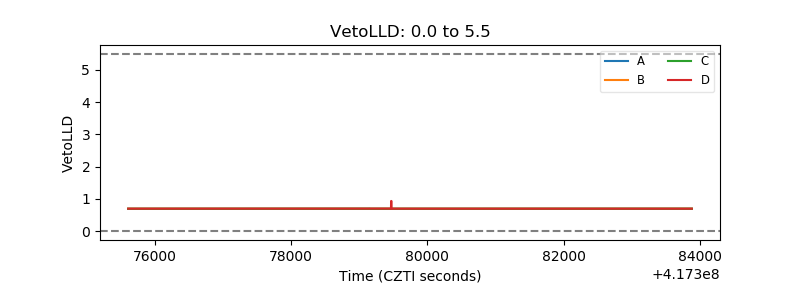 |
| Alpha Counter | 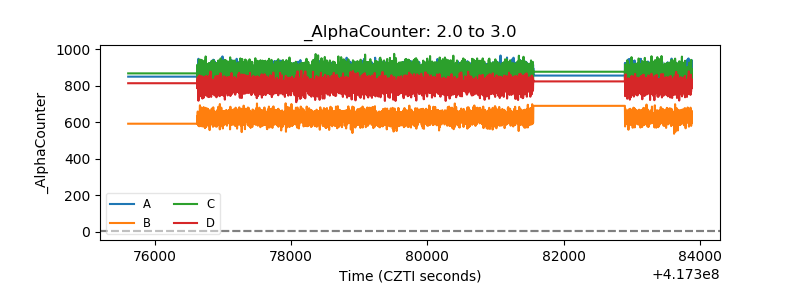 |
| _CPM_Rate | 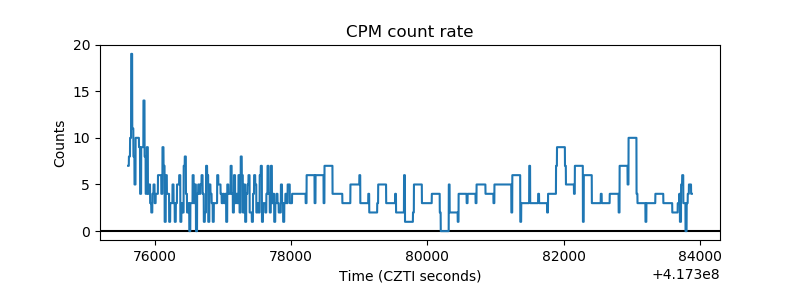 |
| CZT Counter | 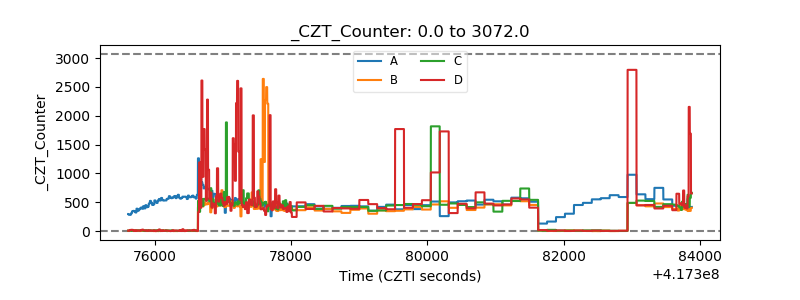 |
| +2.5 Volts monitor | 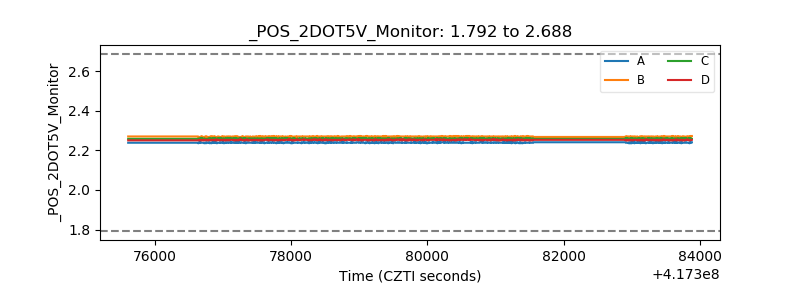 |
| +5 Volts monitor | 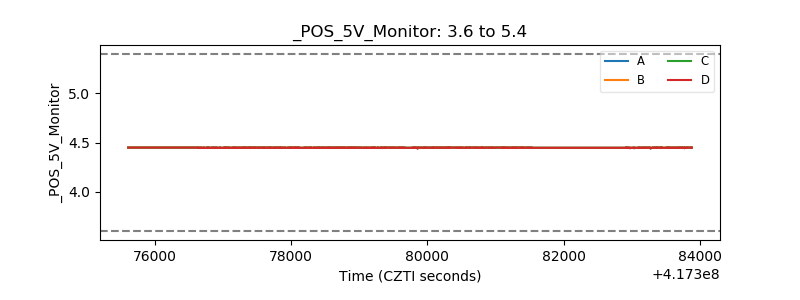 |
| _ROLL_ROT | 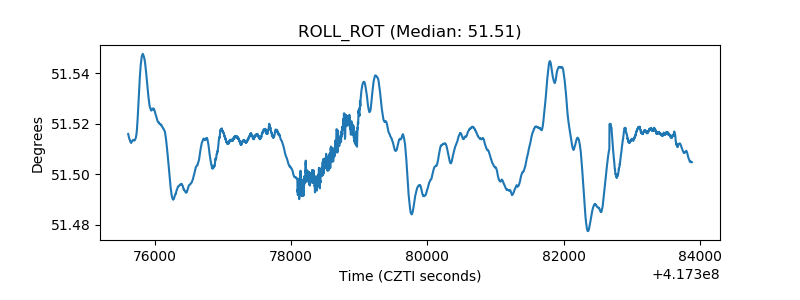 |
| _Roll_DEC | 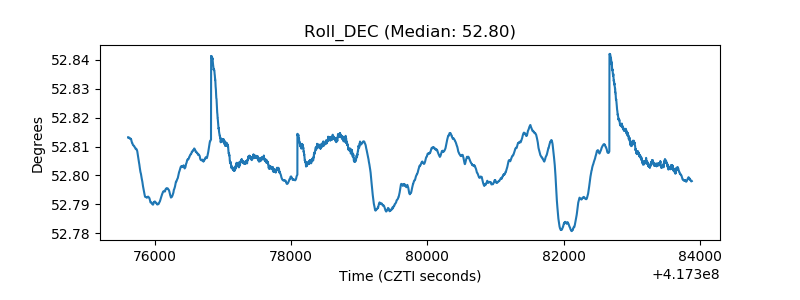 |
| _Roll_RA | 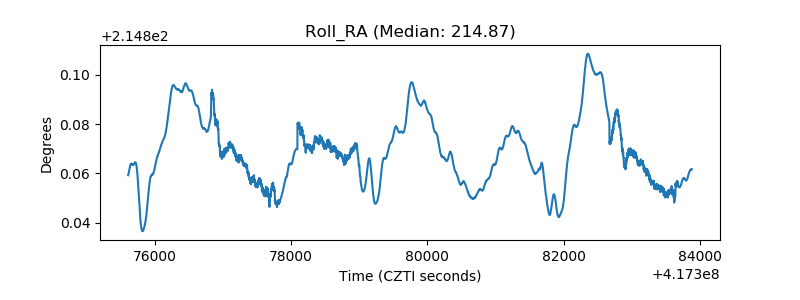 |
| Veto Counter | 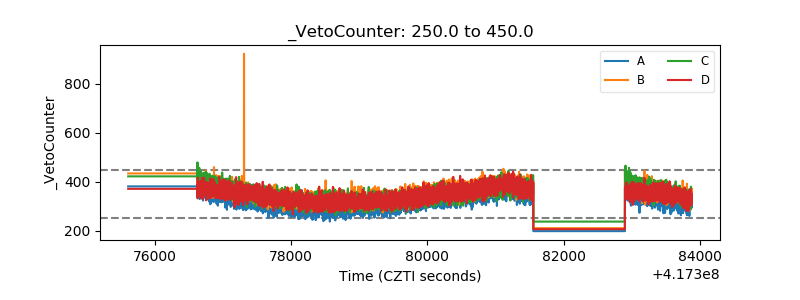 |