| Param | Original file | Final file |
|---|---|---|
| Filename | modeM0/AS1A12_022T01_9000005540_40483cztM0_level2.fits | modeM0/AS1A12_022T01_9000005540_40483cztM0_level2_quad_clean.evt |
| Size (bytes) | 830,260,800 | 207,578,880 |
| Size | 791.8 MB | 198.0 MB |
| Events in quadrant A | 6,644,964 | 1,423,103 |
| Events in quadrant B | 6,021,533 | 1,456,748 |
| Events in quadrant C | 6,163,407 | 1,407,435 |
| Events in quadrant D | 10,862,830 | 1,070,911 |
| Mode M0 | |||
|---|---|---|---|
| Quadrant | BADHDUFLAG | Total packets | Discarded packets |
| A | 0 | 28332 | 4 |
| B | 0 | 27740 | 3 |
| C | 0 | 27327 | 3 |
| D | 0 | 41834 | 3 |
| Mode M9 | |||
|---|---|---|---|
| Quadrant | BADHDUFLAG | Total packets | Discarded packets |
| A | 0 | 40 | 0 |
| B | 0 | 40 | 0 |
| C | 0 | 40 | 0 |
| D | 0 | 40 | 0 |
| Mode SS | |||
|---|---|---|---|
| Quadrant | BADHDUFLAG | Total packets | Discarded packets |
| A | 0 | 274 | 0 |
| B | 0 | 274 | 0 |
| C | 0 | 274 | 0 |
| D | 0 | 274 | 0 |
| Quadrant | Total seconds | Saturated seconds | Saturation percentage |
|---|---|---|---|
| A | 13404 | 21 | 0.156670% |
| B | 13404 | 32 | 0.238735% |
| C | 13404 | 26 | 0.193972% |
| D | 13404 | 2668 | 19.904506% |
Noise dominated data is calculated using 1-second bins in cleaned event files. If a bin has >2000 counts, and if more than 50% of those come from <1% of pixels, then it is considered to be noise-dominated and hence unusable.
| Quadrant | # 1 sec bins | Bins with >0 counts | Bins with >2000 counts | High rate bins dominated by noise | Noise dominated (total time) | Noise dominated (detector-on time) | Marked lightcurve |
|---|---|---|---|---|---|---|---|
| A | 17491 | 13407 | 5 | 5 | 0.03% | 0.04% | 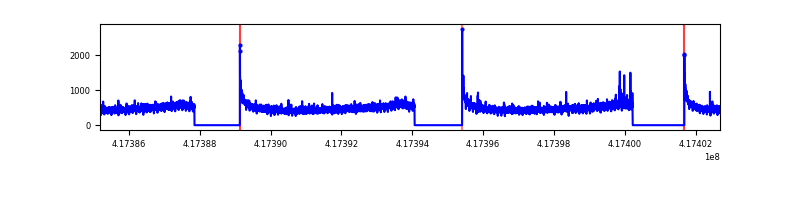 |
| B | 17491 | 13407 | 16 | 16 | 0.09% | 0.12% | 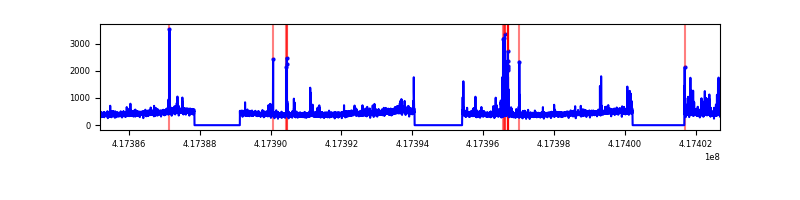 |
| C | 17491 | 13407 | 16 | 16 | 0.09% | 0.12% | 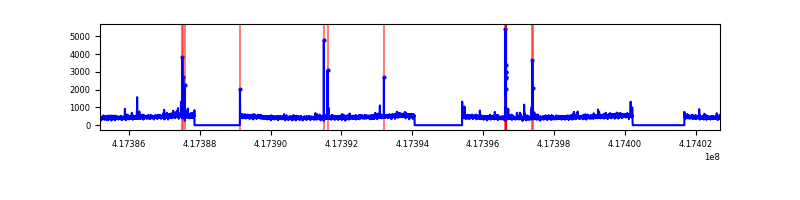 |
| D | 17491 | 13407 | 1250 | 1250 | 7.15% | 9.32% | 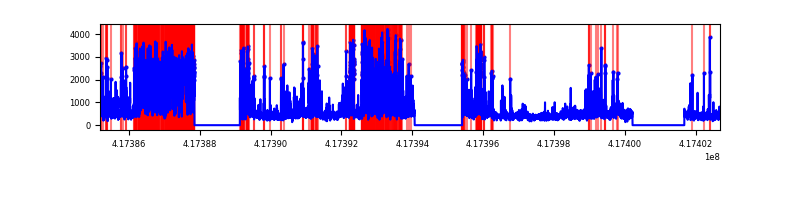 |
Top three noisy pixels from each quadrant. If the there are fewer than three noisy pixels in the level2.evt file, extra rows are filled as -1
| Pixel properties | Quadrant properties | ||||||
|---|---|---|---|---|---|---|---|
| Quadrant | DetID | PixID | Counts | Sigma | Mean | Median | Sigma |
| A | 10 | 83 | 1028486 | 3534.43 | 1433 | 1402 | 290.6 |
| A | 12 | 189 | 29231 | 95.77 | 1433 | 1402 | 290.6 |
| A | 13 | 248 | 25076 | 81.47 | 1433 | 1402 | 290.6 |
| B | 4 | 170 | 271941 | 990.83 | 1420 | 1375 | 273.1 |
| B | 3 | 112 | 68912 | 247.32 | 1420 | 1375 | 273.1 |
| B | 5 | 255 | 41297 | 146.2 | 1420 | 1375 | 273.1 |
| C | 15 | 214 | 568441 | 1756.17 | 1393 | 1397 | 322.9 |
| C | 14 | 254 | 114255 | 349.53 | 1393 | 1397 | 322.9 |
| C | 9 | 187 | 29408 | 86.75 | 1393 | 1397 | 322.9 |
| D | 12 | 227 | 4500741 | 14556.36 | 1255 | 1219 | 309.1 |
| D | 12 | 191 | 407561 | 1314.55 | 1255 | 1219 | 309.1 |
| D | 2 | 250 | 388898 | 1254.18 | 1255 | 1219 | 309.1 |
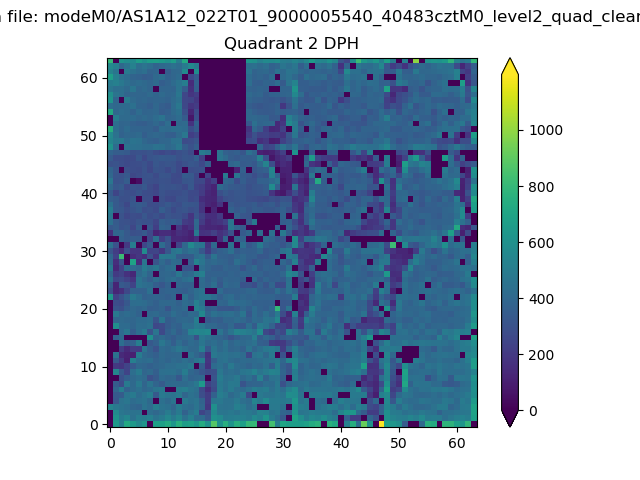
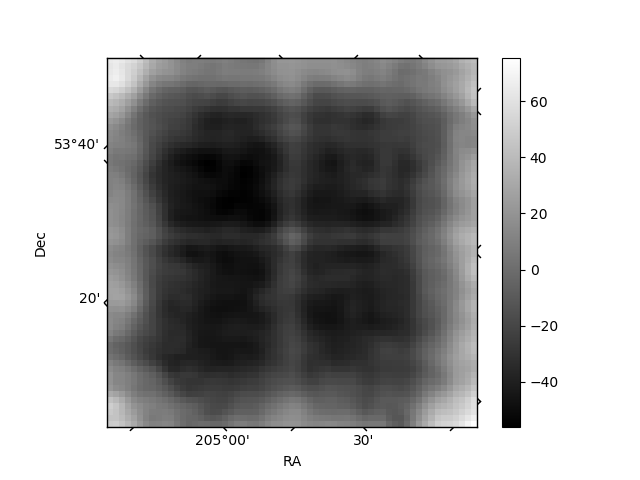
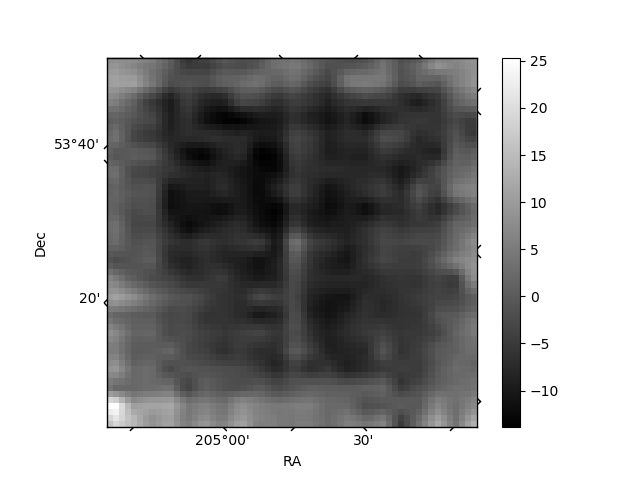
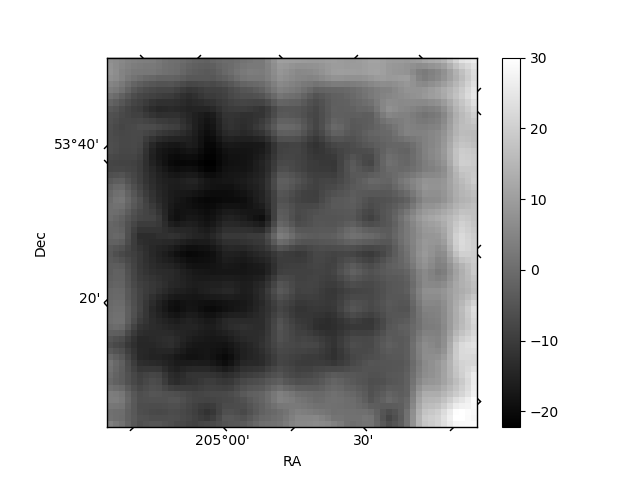
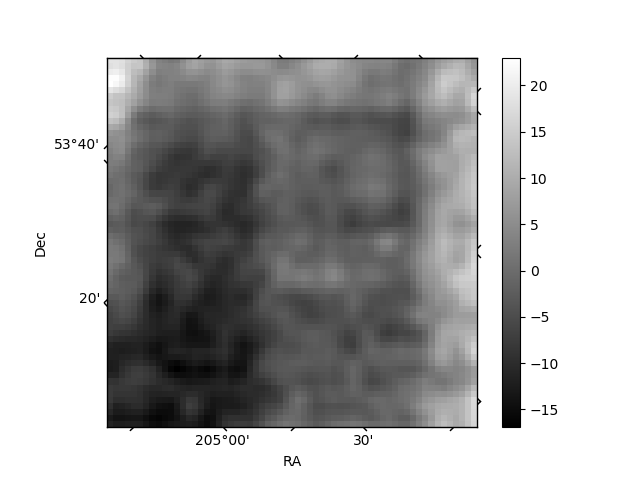
Histogram calculated using DETX and DETY for each event in the final _common_clean file
| Quadrant A | 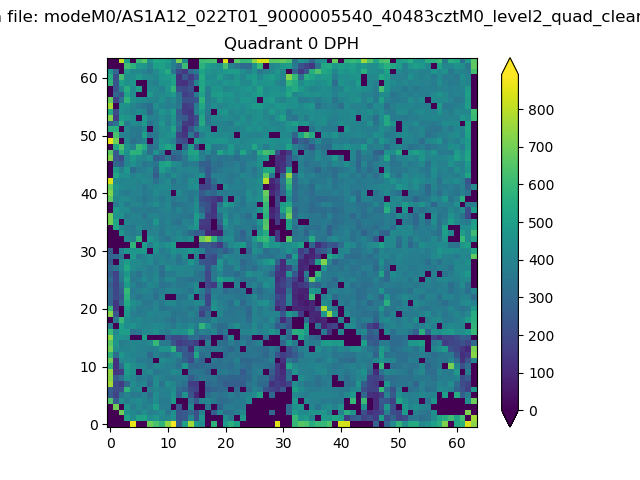 |
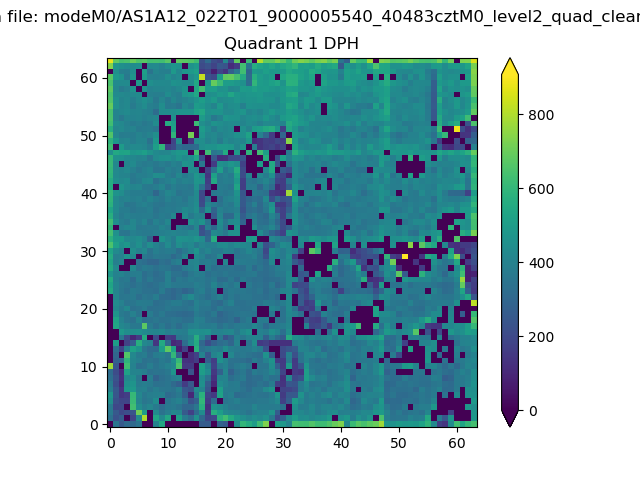 |
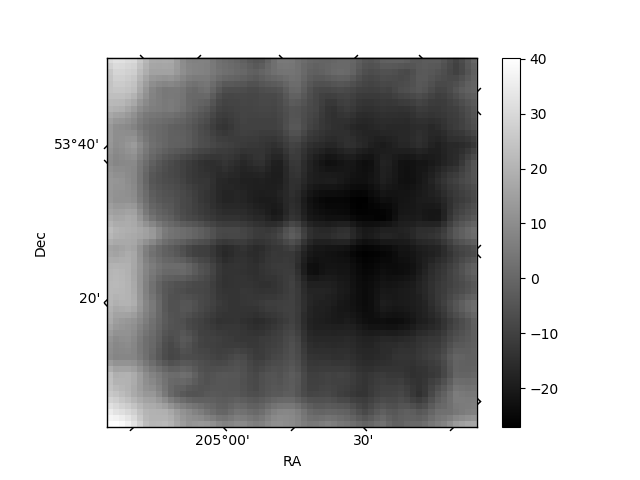
Quadrant B |
|---|---|---|---|
| Quadrant D | 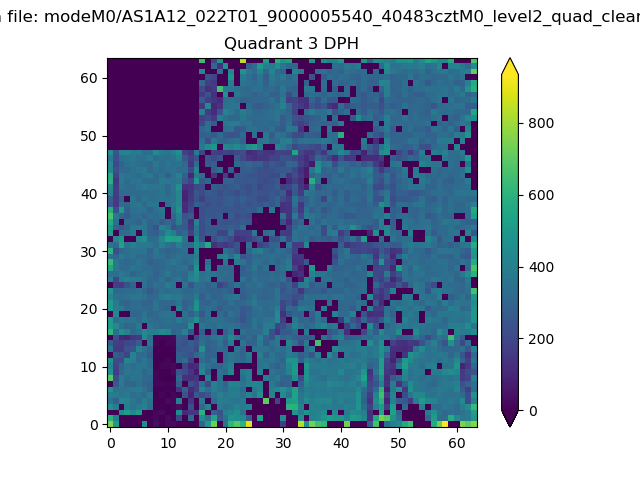 |
 |
Quadrant C |
| Plot type | Count rate plots | Images |
|---|---|---|
| Comparison with Poisson distribution Blue bars denote a histogram of data divided into 1 sec bins. Red curve is a Poisson curve with rate = median count rate of data. |
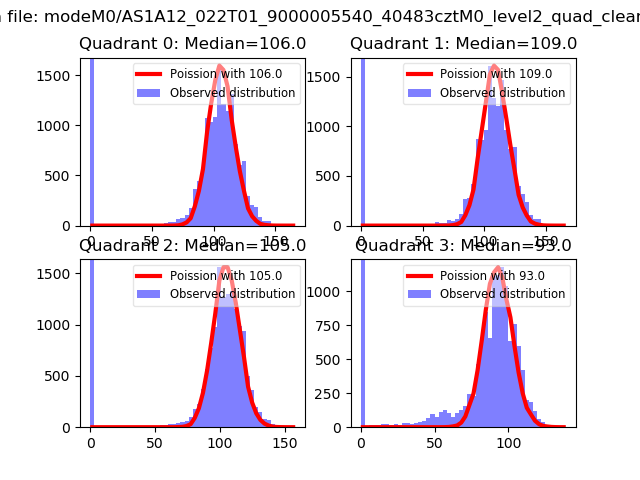 |
 |
| Quadrant-wise count rates Data is divided into 100 sec bins |
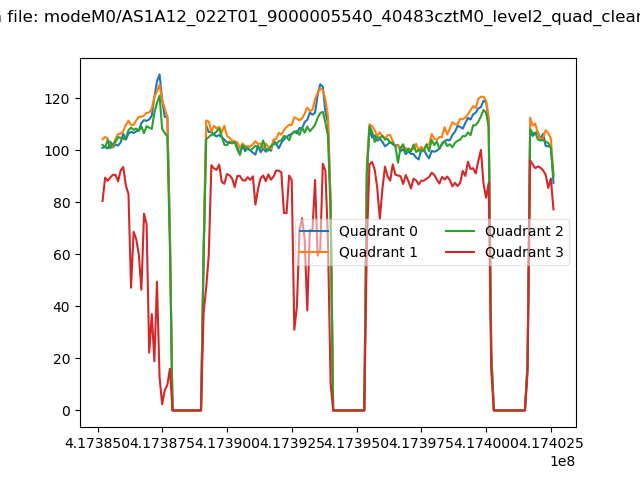 |
|
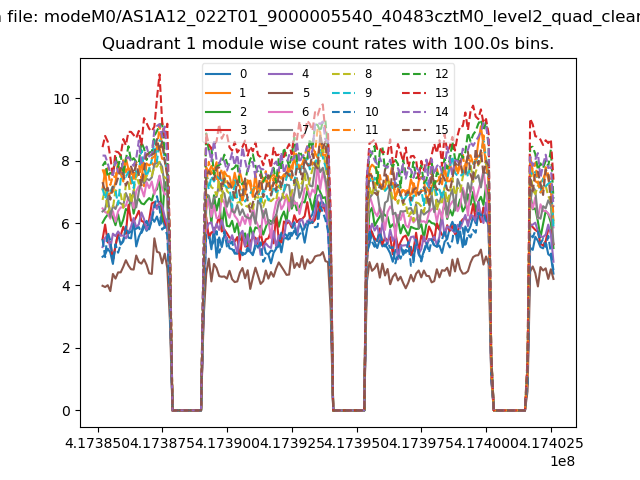
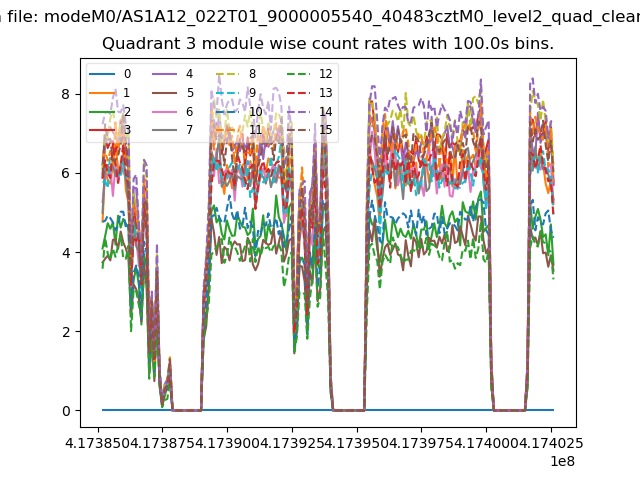
| Module-wise count rates for Quadrant A Data is divided into 100 sec bins |
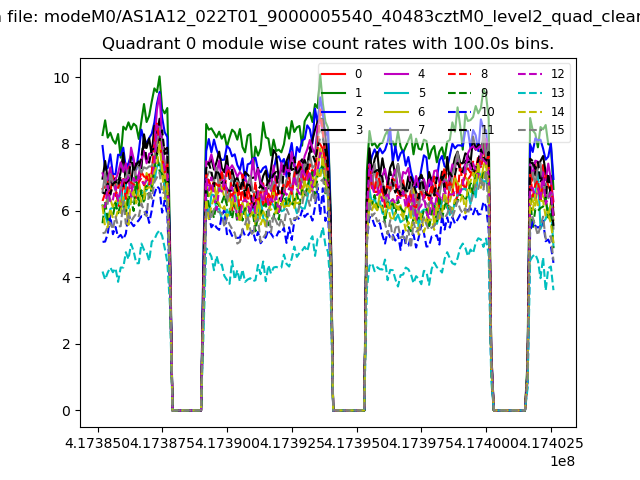 |
 |
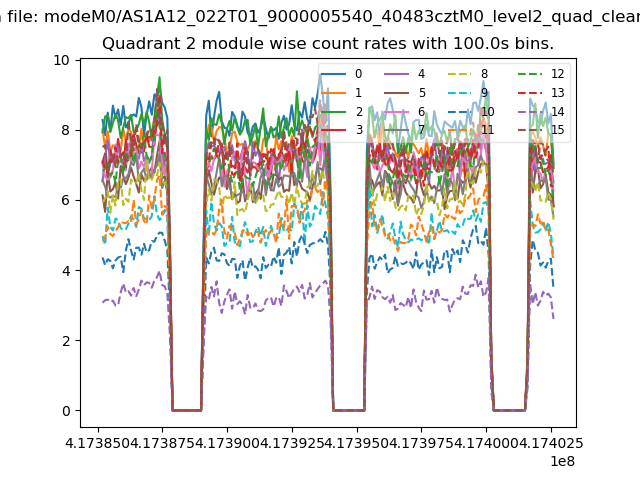
| Module-wise count rates for Quadrant B Data is divided into 100 sec bins |
 |
 |
| Module-wise count rates for Quadrant C Data is divided into 100 sec bins |
 |
 |
| Module-wise count rates for Quadrant D Data is divided into 100 sec bins |
 |
 |
| Parameter | Plot |
|---|---|
| CZT HV Monitor | 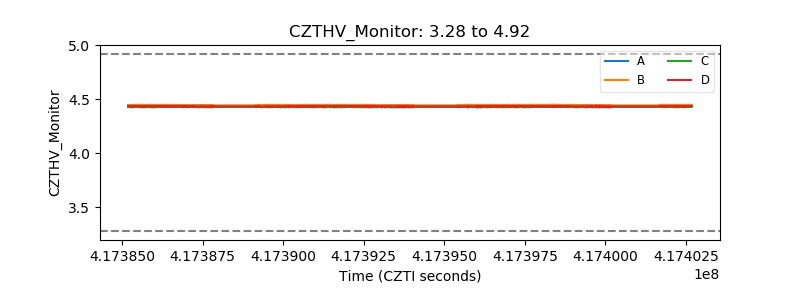 |
| D_VDD | 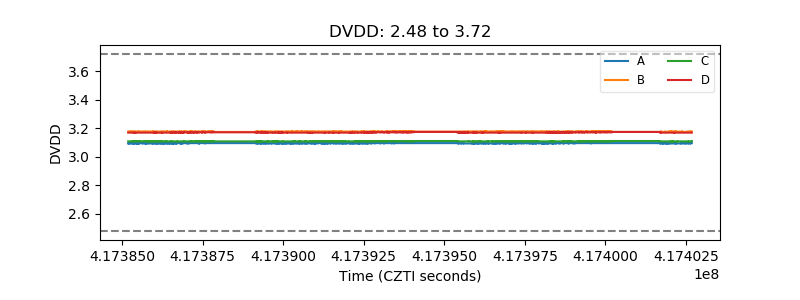 |
| Temperature 1 | 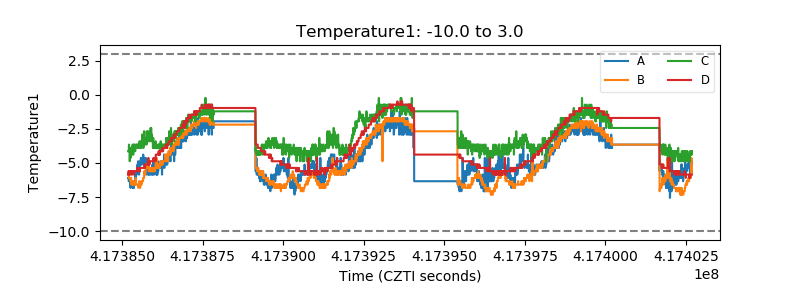 |
| Veto HV Monitor |  |
| Veto LLD |  |
| Alpha Counter | 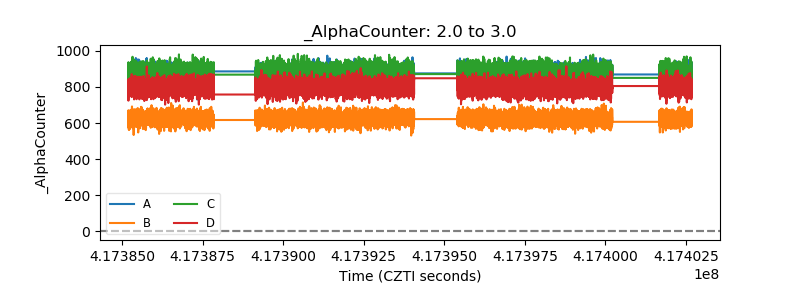 |
| _CPM_Rate | 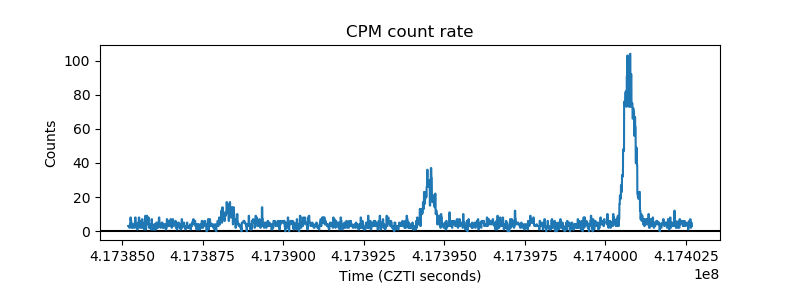 |
| CZT Counter | 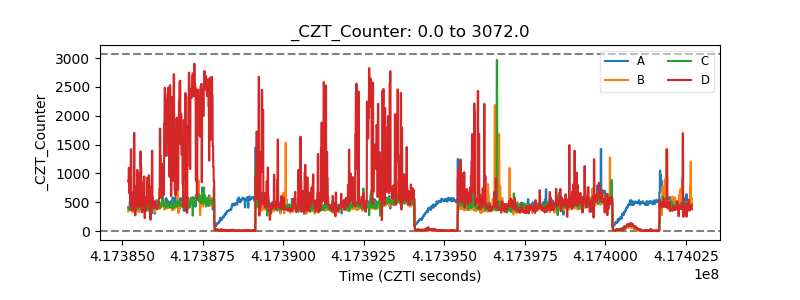 |
| +2.5 Volts monitor | 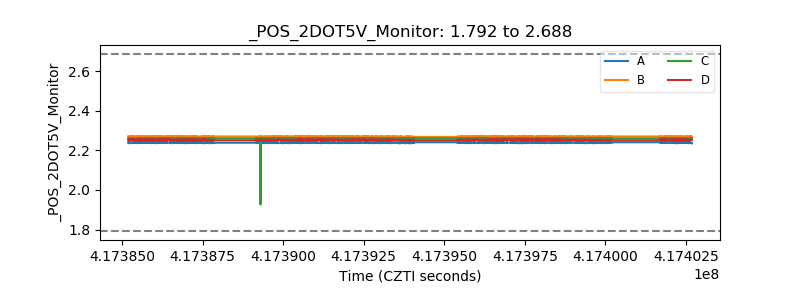 |
| +5 Volts monitor | 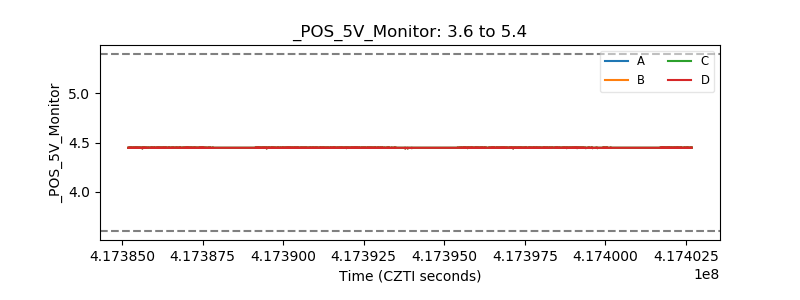 |
| _ROLL_ROT | 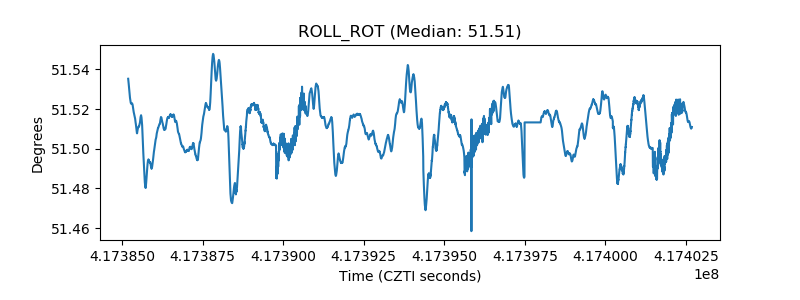 |
| _Roll_DEC | 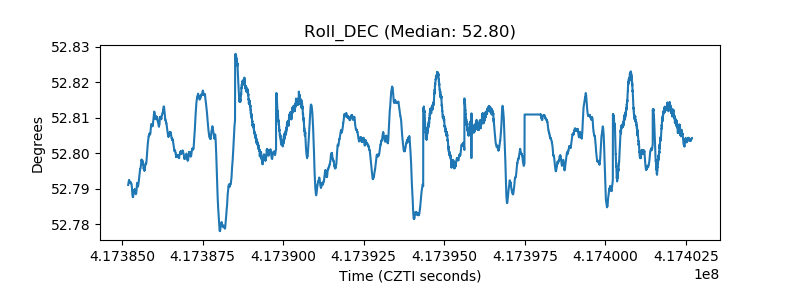 |
| _Roll_RA | 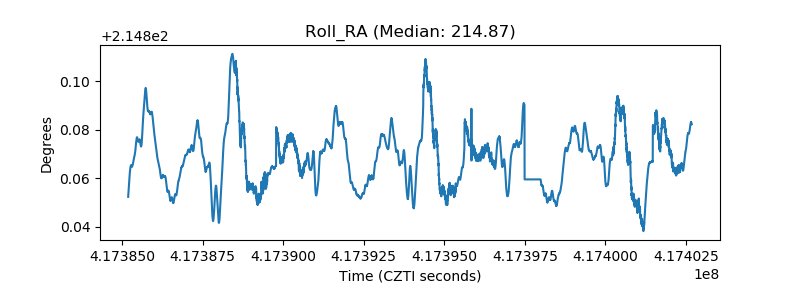 |
| Veto Counter | 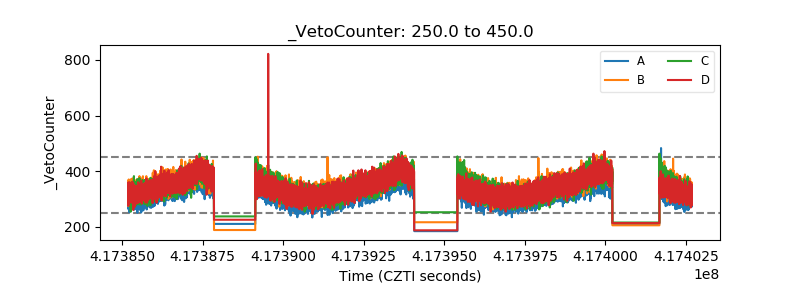 |