| Param | Original file | Final file |
|---|---|---|
| Filename | modeM0/AS1A12_022T01_9000005540_40484cztM0_level2.fits | modeM0/AS1A12_022T01_9000005540_40484cztM0_level2_quad_clean.evt |
| Size (bytes) | 354,306,240 | 93,620,160 |
| Size | 337.9 MB | 89.3 MB |
| Events in quadrant A | 3,095,987 | 645,900 |
| Events in quadrant B | 3,252,385 | 661,610 |
| Events in quadrant C | 2,835,344 | 639,888 |
| Events in quadrant D | 3,460,044 | 465,240 |
| Mode M0 | |||
|---|---|---|---|
| Quadrant | BADHDUFLAG | Total packets | Discarded packets |
| A | 0 | 13007 | 3 |
| B | 0 | 13923 | 2 |
| C | 0 | 12452 | 2 |
| D | 0 | 14662 | 2 |
| Mode M9 | |||
|---|---|---|---|
| Quadrant | BADHDUFLAG | Total packets | Discarded packets |
| A | 0 | 30 | 0 |
| B | 0 | 30 | 0 |
| C | 0 | 30 | 0 |
| D | 0 | 30 | 0 |
| Mode SS | |||
|---|---|---|---|
| Quadrant | BADHDUFLAG | Total packets | Discarded packets |
| A | 0 | 124 | 0 |
| B | 0 | 124 | 0 |
| C | 0 | 124 | 0 |
| D | 0 | 124 | 0 |
| Quadrant | Total seconds | Saturated seconds | Saturation percentage |
|---|---|---|---|
| A | 6036 | 14 | 0.231942% |
| B | 6036 | 40 | 0.662691% |
| C | 6036 | 8 | 0.132538% |
| D | 6036 | 1473 | 24.403579% |
Noise dominated data is calculated using 1-second bins in cleaned event files. If a bin has >2000 counts, and if more than 50% of those come from <1% of pixels, then it is considered to be noise-dominated and hence unusable.
| Quadrant | # 1 sec bins | Bins with >0 counts | Bins with >2000 counts | High rate bins dominated by noise | Noise dominated (total time) | Noise dominated (detector-on time) | Marked lightcurve |
|---|---|---|---|---|---|---|---|
| A | 9081 | 6038 | 3 | 3 | 0.03% | 0.05% | 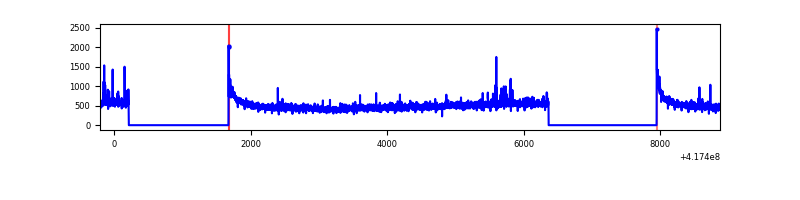 |
| B | 9081 | 6038 | 6 | 6 | 0.07% | 0.10% | 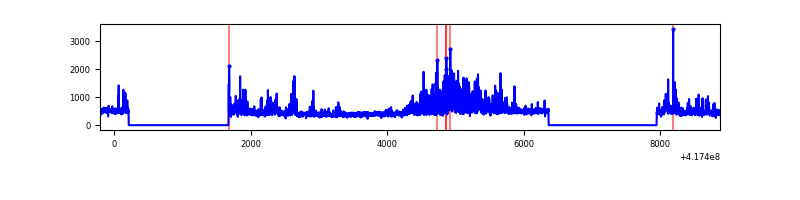 |
| C | 9081 | 6038 | 0 | 0 | 0.00% | 0.00% | 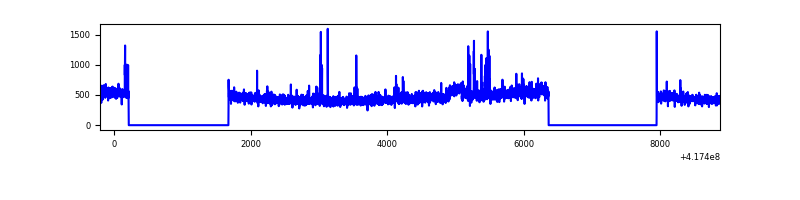 |
| D | 9081 | 6038 | 116 | 116 | 1.28% | 1.92% | 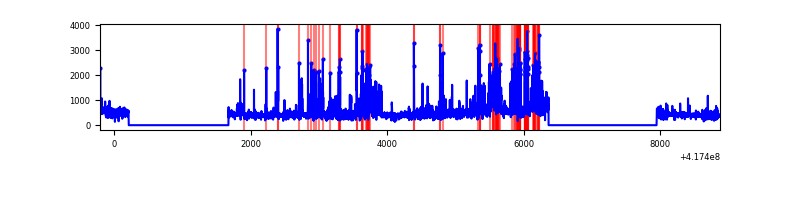 |
Top three noisy pixels from each quadrant. If the there are fewer than three noisy pixels in the level2.evt file, extra rows are filled as -1
| Pixel properties | Quadrant properties | ||||||
|---|---|---|---|---|---|---|---|
| Quadrant | DetID | PixID | Counts | Sigma | Mean | Median | Sigma |
| A | 10 | 83 | 535688 | 4044.77 | 644 | 631 | 132.3 |
| A | 13 | 248 | 46122 | 343.89 | 644 | 631 | 132.3 |
| A | 2 | 79 | 9674 | 68.36 | 644 | 631 | 132.3 |
| B | 4 | 170 | 629398 | 5114.63 | 640 | 623 | 122.9 |
| B | 3 | 112 | 61163 | 492.45 | 640 | 623 | 122.9 |
| B | 15 | 85 | 20063 | 158.13 | 640 | 623 | 122.9 |
| C | 15 | 214 | 262314 | 1781.45 | 630 | 631 | 146.9 |
| C | 14 | 254 | 45134 | 302.96 | 630 | 631 | 146.9 |
| C | 10 | 20 | 38295 | 256.4 | 630 | 631 | 146.9 |
| D | 2 | 250 | 753982 | 5520.83 | 551 | 536 | 136.5 |
| D | 12 | 191 | 306085 | 2238.89 | 551 | 536 | 136.5 |
| D | 12 | 79 | 70673 | 513.92 | 551 | 536 | 136.5 |
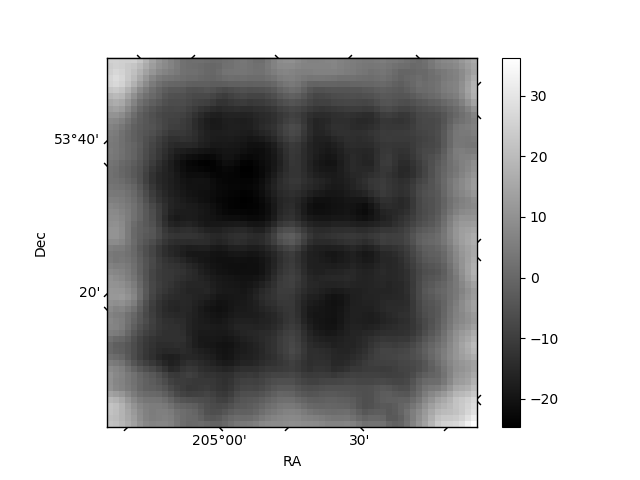
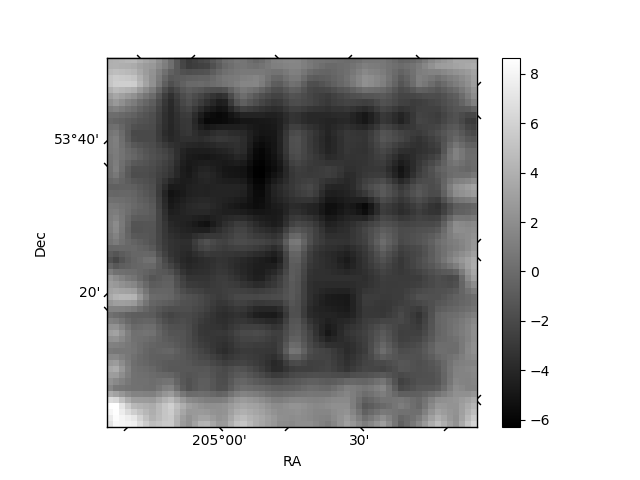
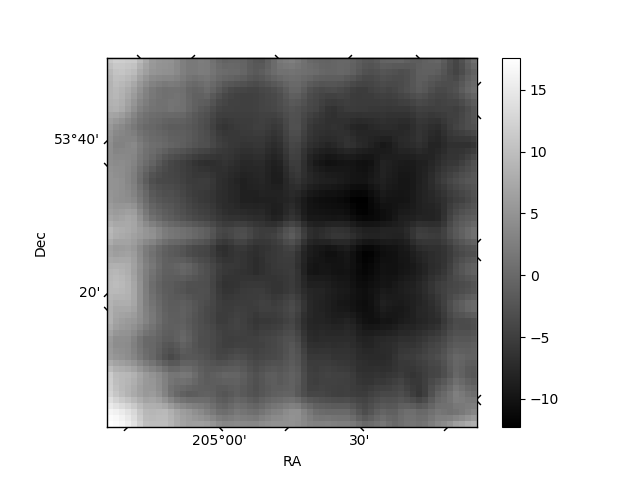
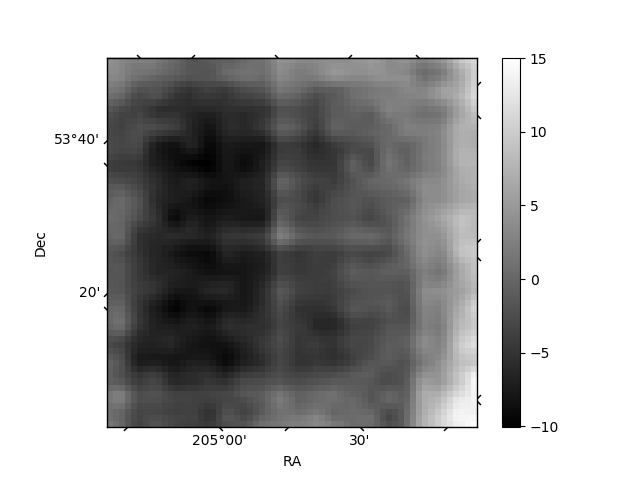
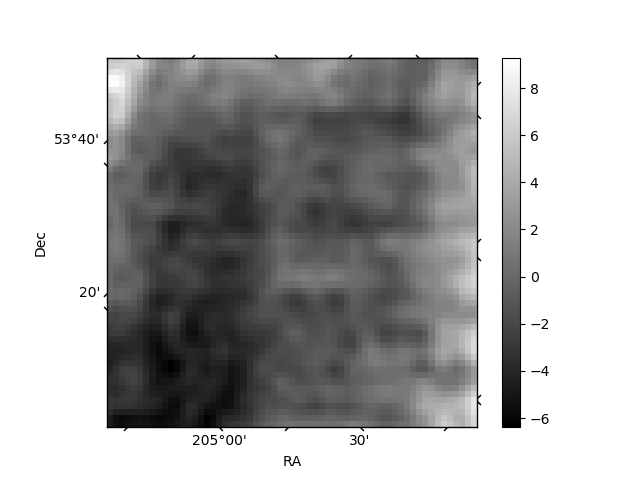
Histogram calculated using DETX and DETY for each event in the final _common_clean file
| Quadrant A | 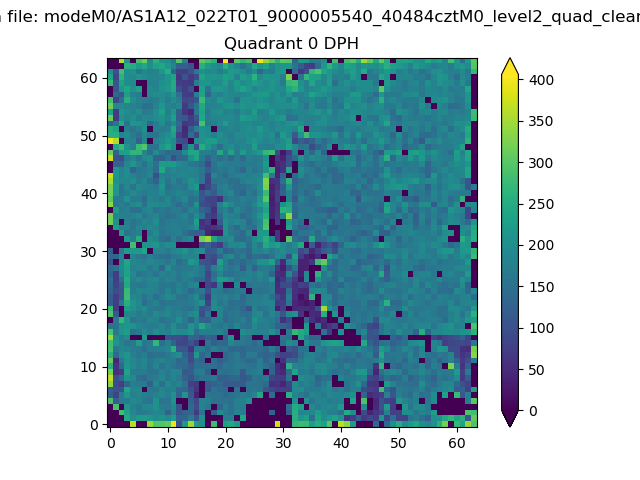 |
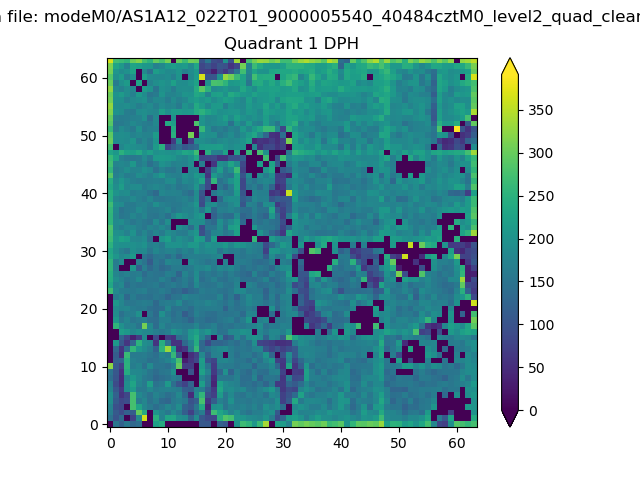 |
Quadrant B |
|---|---|---|---|
| Quadrant D | 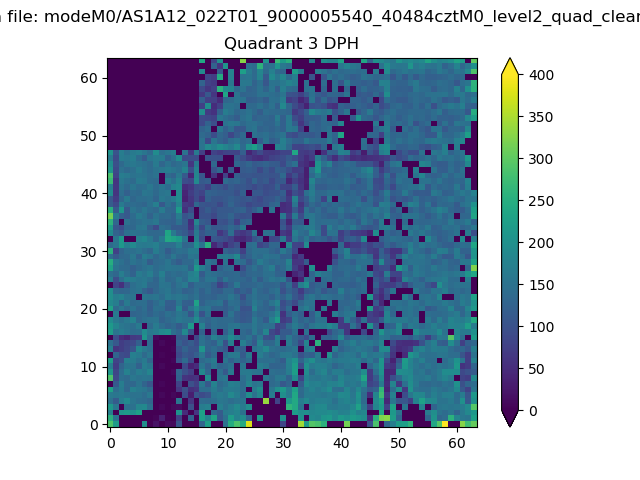 |
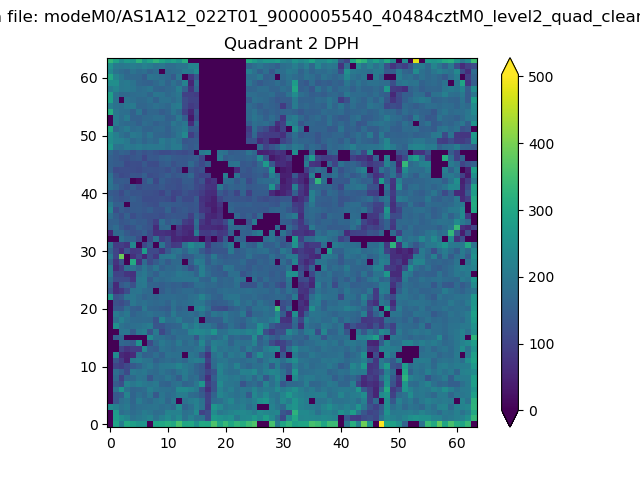 |
Quadrant C |
| Plot type | Count rate plots | Images |
|---|---|---|
| Comparison with Poisson distribution Blue bars denote a histogram of data divided into 1 sec bins. Red curve is a Poisson curve with rate = median count rate of data. |
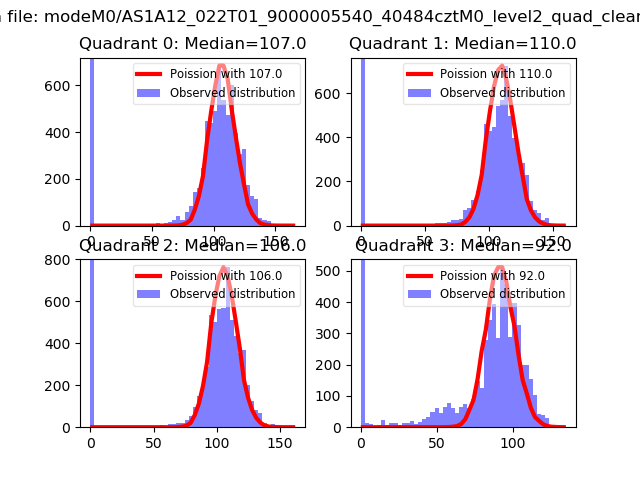 |
 |
| Quadrant-wise count rates Data is divided into 100 sec bins |
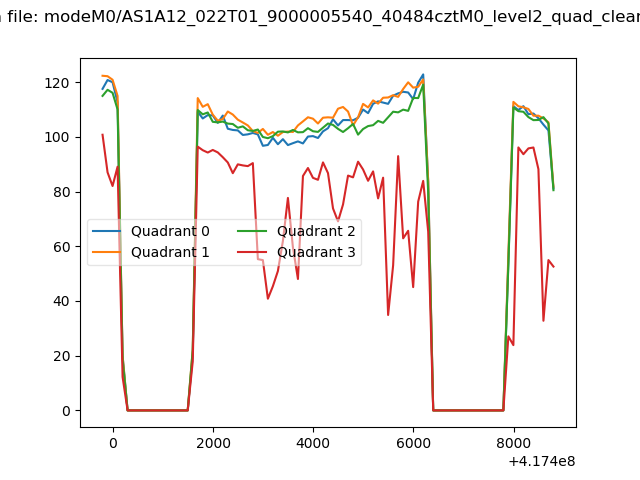 |
|
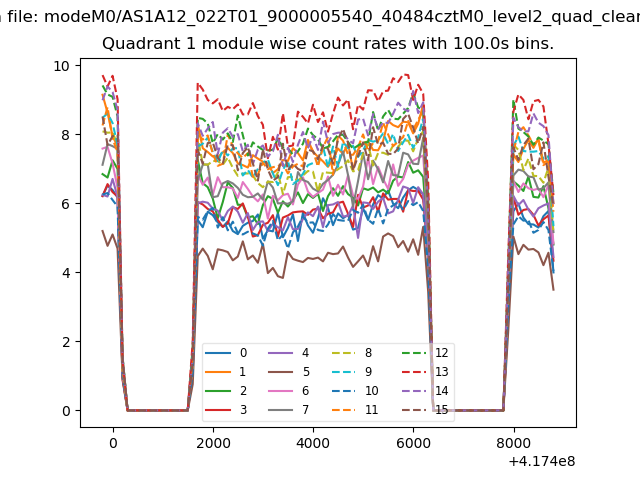
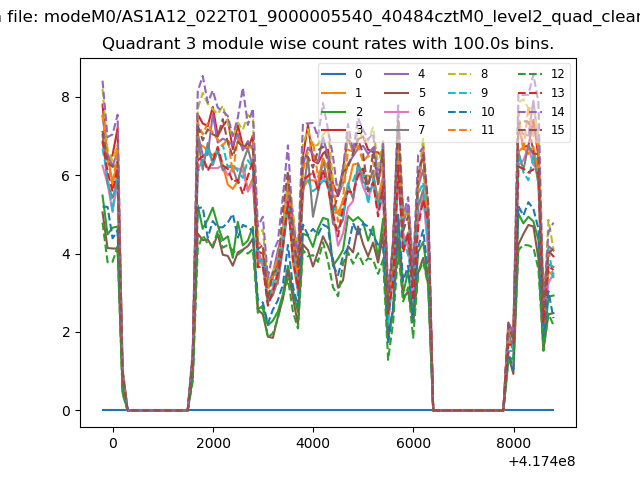
| Module-wise count rates for Quadrant A Data is divided into 100 sec bins |
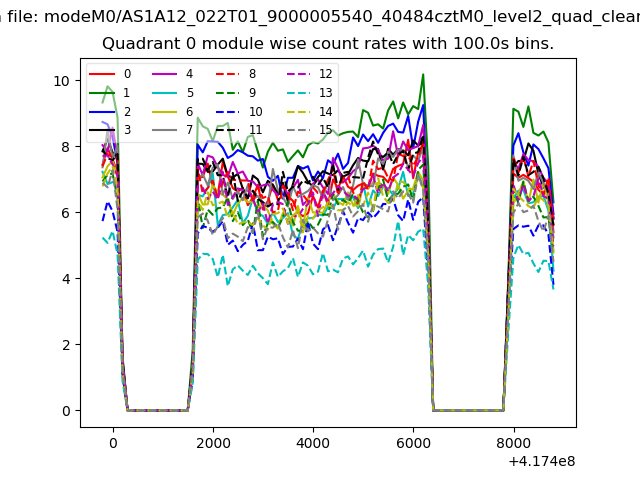 |
 |
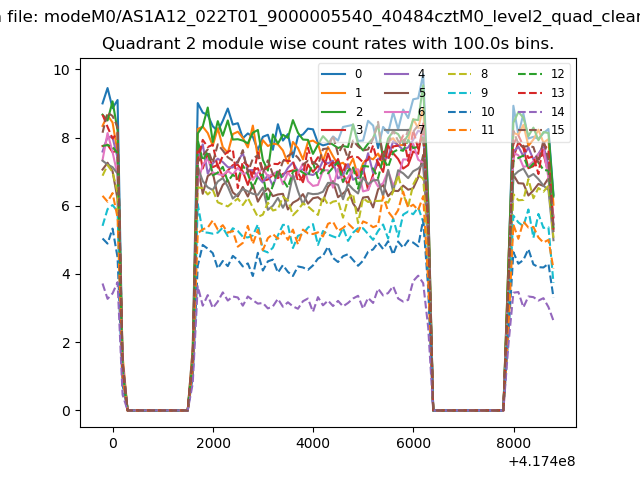
| Module-wise count rates for Quadrant B Data is divided into 100 sec bins |
 |
 |
| Module-wise count rates for Quadrant C Data is divided into 100 sec bins |
 |
 |
| Module-wise count rates for Quadrant D Data is divided into 100 sec bins |
 |
 |
| Parameter | Plot |
|---|---|
| CZT HV Monitor | 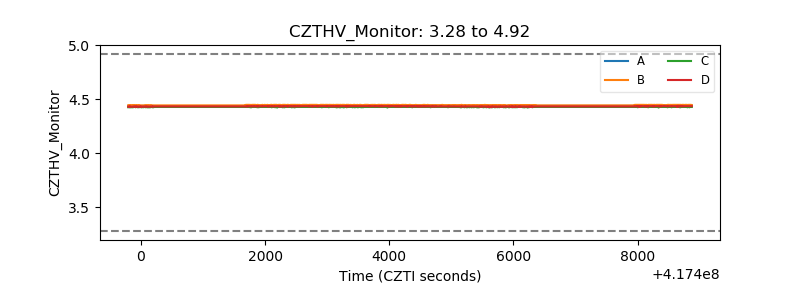 |
| D_VDD | 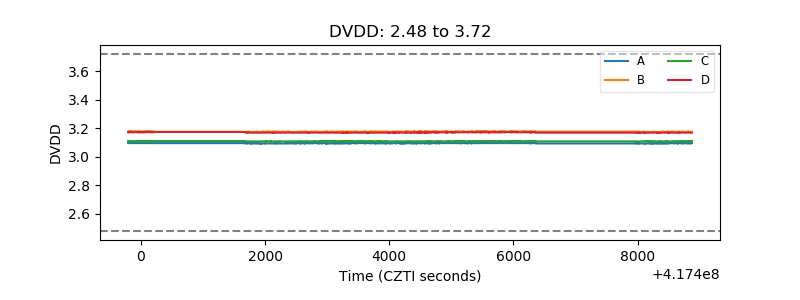 |
| Temperature 1 | 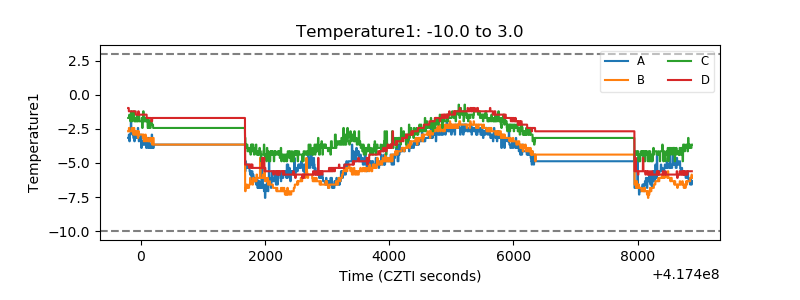 |
| Veto HV Monitor | 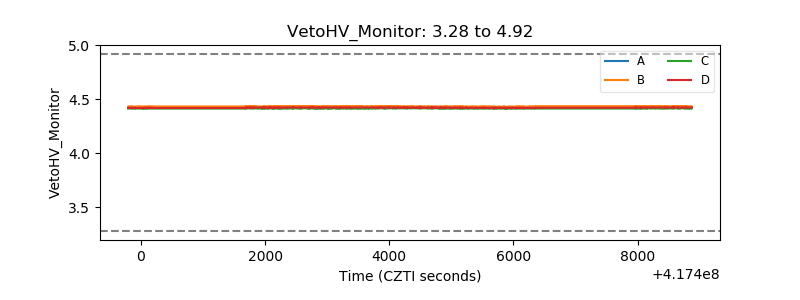 |
| Veto LLD | 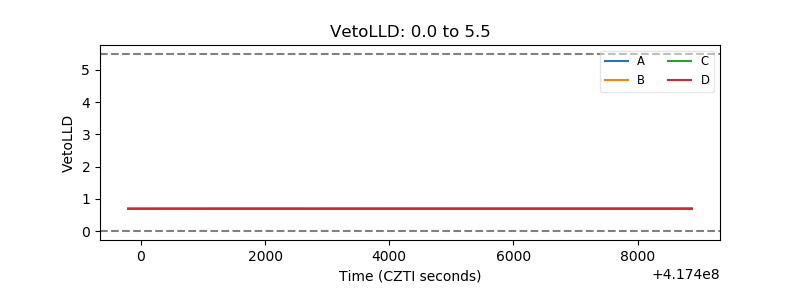 |
| Alpha Counter | 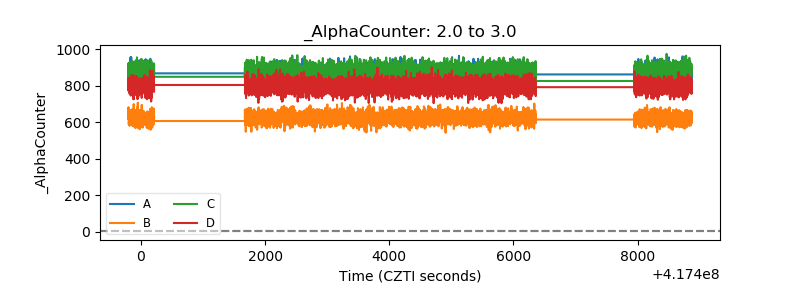 |
| _CPM_Rate | 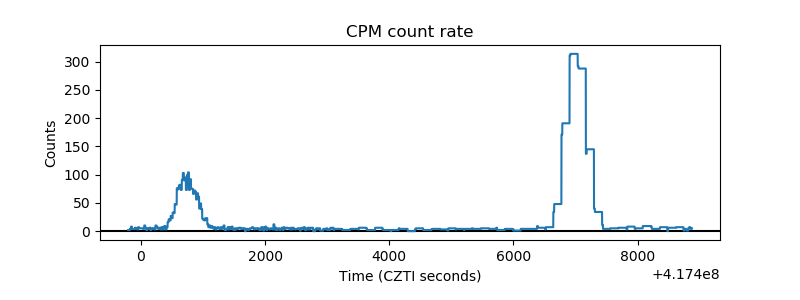 |
| CZT Counter | 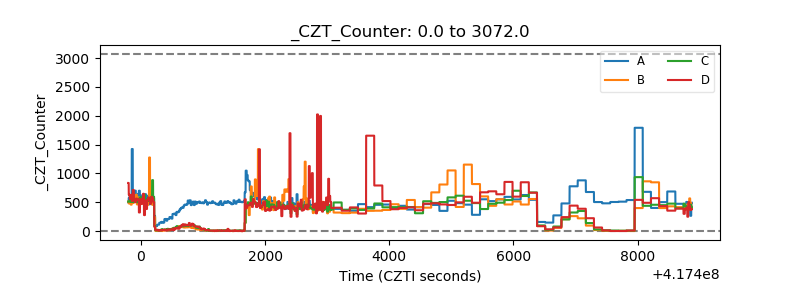 |
| +2.5 Volts monitor | 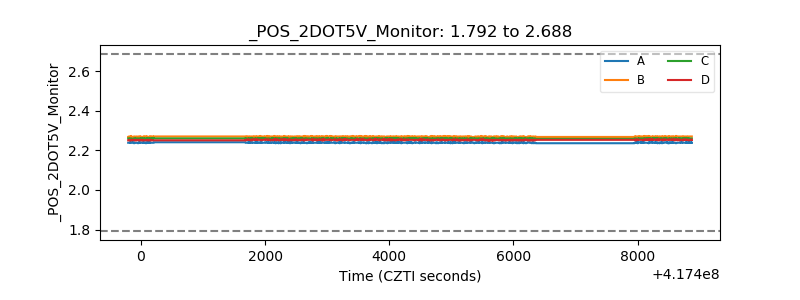 |
| +5 Volts monitor | 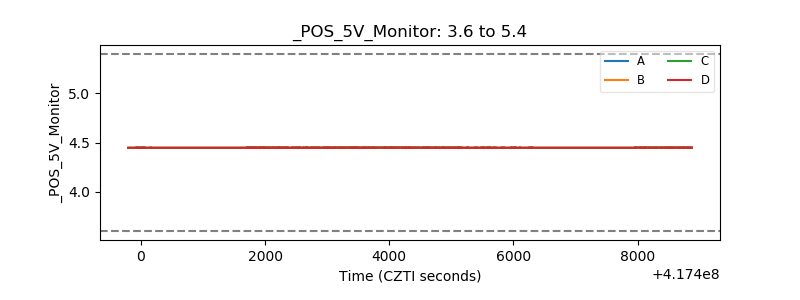 |
| _ROLL_ROT | 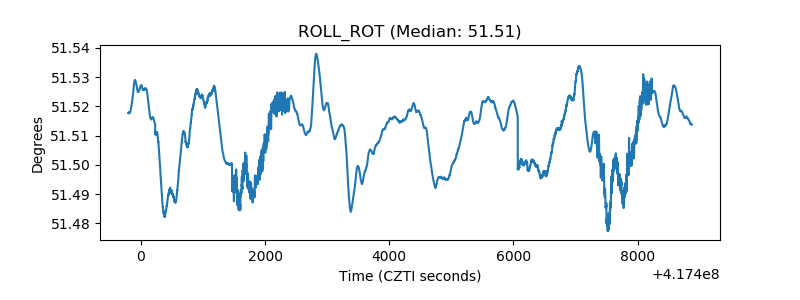 |
| _Roll_DEC | 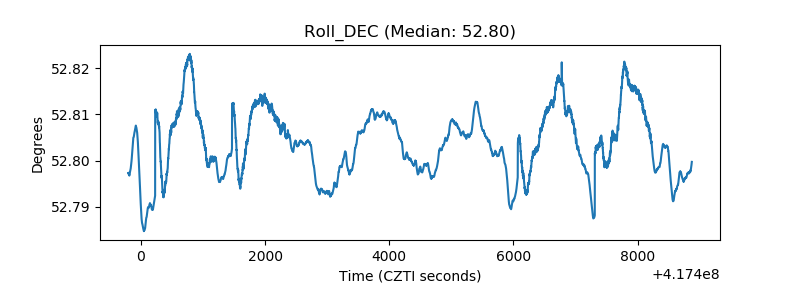 |
| _Roll_RA | 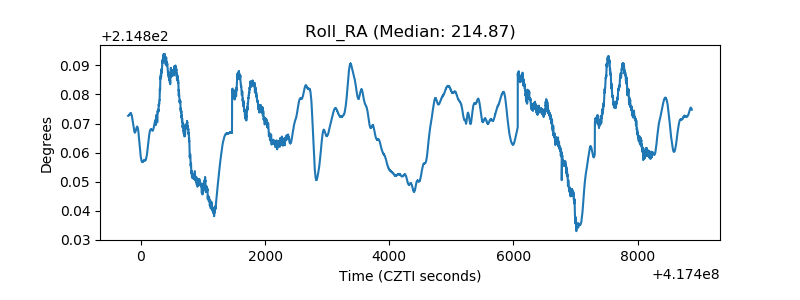 |
| Veto Counter | 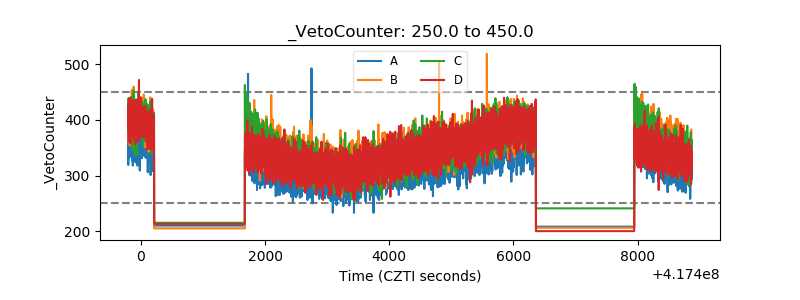 |