| Param | Original file | Final file |
|---|---|---|
| Filename | modeM0/AS1A12_022T01_9000005540_40487cztM0_level2.fits | modeM0/AS1A12_022T01_9000005540_40487cztM0_level2_quad_clean.evt |
| Size (bytes) | 355,124,160 | 82,647,360 |
| Size | 338.7 MB | 78.8 MB |
| Events in quadrant A | 2,729,668 | 590,486 |
| Events in quadrant B | 2,697,532 | 602,384 |
| Events in quadrant C | 2,402,315 | 574,152 |
| Events in quadrant D | 4,906,599 | 368,702 |
| Mode M0 | |||
|---|---|---|---|
| Quadrant | BADHDUFLAG | Total packets | Discarded packets |
| A | 0 | 11259 | 3 |
| B | 0 | 11739 | 2 |
| C | 0 | 10527 | 2 |
| D | 0 | 18343 | 2 |
| Mode M9 | |||
|---|---|---|---|
| Quadrant | BADHDUFLAG | Total packets | Discarded packets |
| A | 0 | 29 | 0 |
| B | 0 | 29 | 0 |
| C | 0 | 29 | 0 |
| D | 0 | 30 | 0 |
| Mode SS | |||
|---|---|---|---|
| Quadrant | BADHDUFLAG | Total packets | Discarded packets |
| A | 0 | 106 | 0 |
| B | 0 | 106 | 0 |
| C | 0 | 106 | 0 |
| D | 0 | 106 | 0 |
| Quadrant | Total seconds | Saturated seconds | Saturation percentage |
|---|---|---|---|
| A | 5239 | 11 | 0.209964% |
| B | 5239 | 51 | 0.973468% |
| C | 5239 | 3 | 0.057263% |
| D | 5239 | 1761 | 33.613285% |
Noise dominated data is calculated using 1-second bins in cleaned event files. If a bin has >2000 counts, and if more than 50% of those come from <1% of pixels, then it is considered to be noise-dominated and hence unusable.
| Quadrant | # 1 sec bins | Bins with >0 counts | Bins with >2000 counts | High rate bins dominated by noise | Noise dominated (total time) | Noise dominated (detector-on time) | Marked lightcurve |
|---|---|---|---|---|---|---|---|
| A | 7092 | 5240 | 1 | 1 | 0.01% | 0.02% | 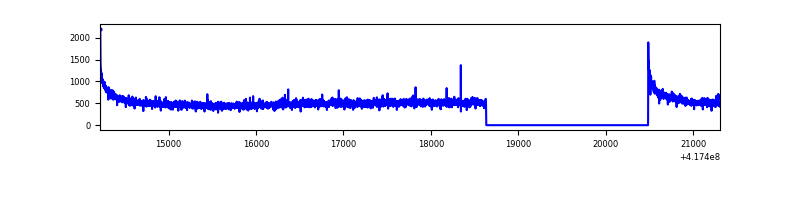 |
| B | 7092 | 5240 | 23 | 23 | 0.32% | 0.44% | 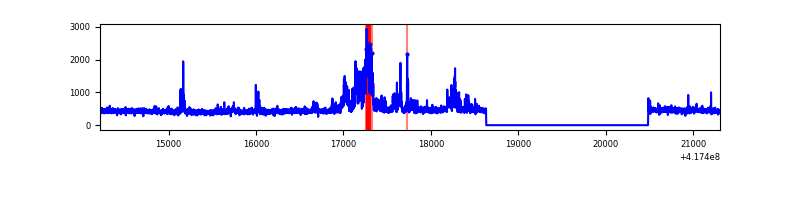 |
| C | 7092 | 5240 | 1 | 1 | 0.01% | 0.02% | 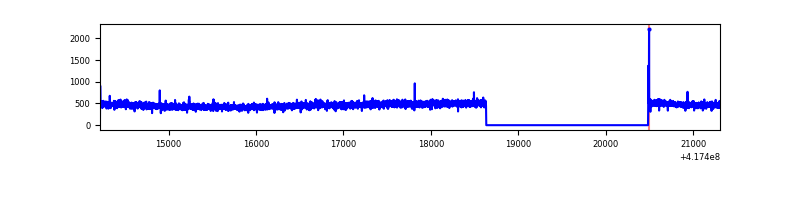 |
| D | 7092 | 5240 | 616 | 616 | 8.69% | 11.76% | 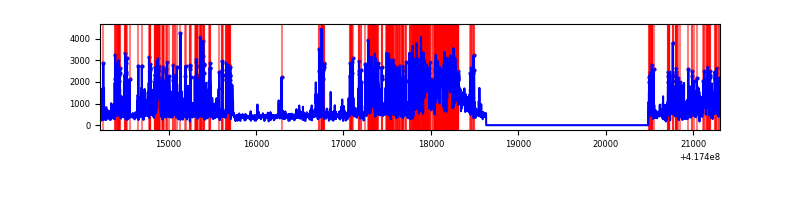 |
Top three noisy pixels from each quadrant. If the there are fewer than three noisy pixels in the level2.evt file, extra rows are filled as -1
| Pixel properties | Quadrant properties | ||||||
|---|---|---|---|---|---|---|---|
| Quadrant | DetID | PixID | Counts | Sigma | Mean | Median | Sigma |
| A | 10 | 83 | 472366 | 4005.19 | 573 | 561 | 117.8 |
| A | 12 | 189 | 14818 | 121.03 | 573 | 561 | 117.8 |
| A | 2 | 79 | 14806 | 120.93 | 573 | 561 | 117.8 |
| B | 4 | 170 | 416177 | 3807.25 | 566 | 552 | 109.2 |
| B | 10 | 246 | 38921 | 351.47 | 566 | 552 | 109.2 |
| B | 12 | 111 | 13829 | 121.62 | 566 | 552 | 109.2 |
| C | 15 | 214 | 231444 | 1808.67 | 551 | 553 | 127.7 |
| C | 9 | 187 | 8072 | 58.9 | 551 | 553 | 127.7 |
| C | 0 | 10 | 5034 | 35.1 | 551 | 553 | 127.7 |
| D | 2 | 250 | 2722469 | 23906.43 | 459 | 445 | 113.9 |
| D | 12 | 191 | 194873 | 1707.58 | 459 | 445 | 113.9 |
| D | 12 | 227 | 54245 | 472.5 | 459 | 445 | 113.9 |
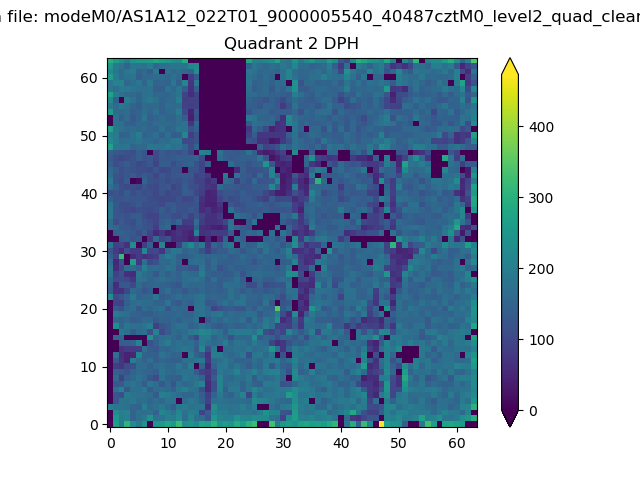
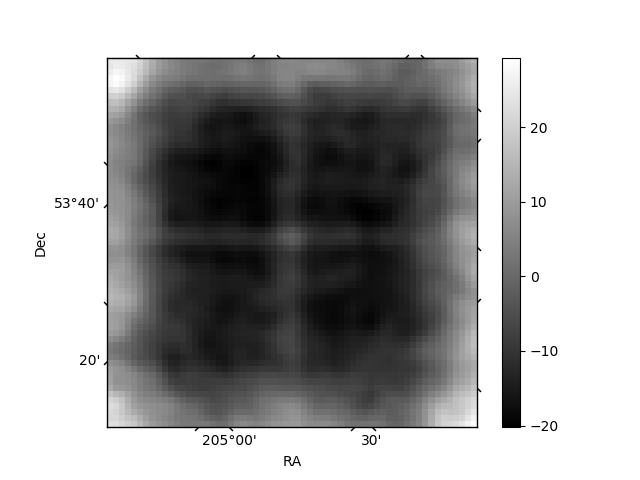
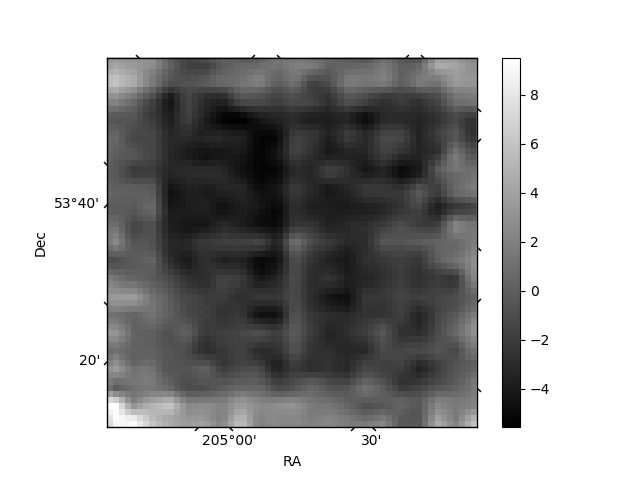
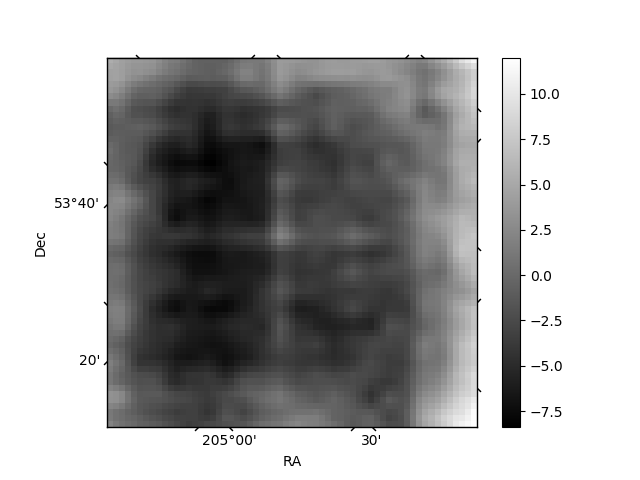
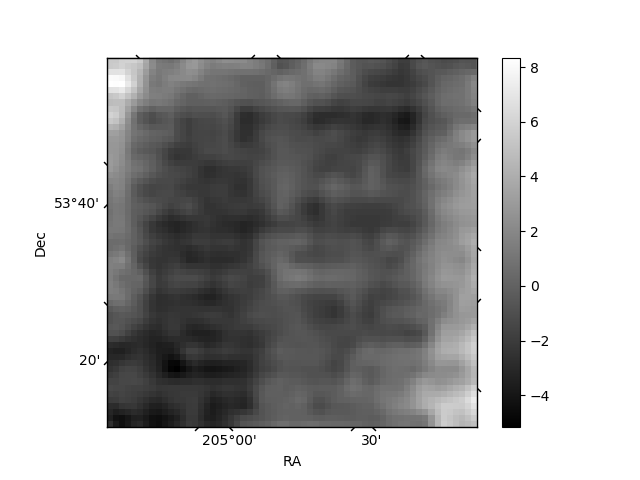
Histogram calculated using DETX and DETY for each event in the final _common_clean file
| Quadrant A | 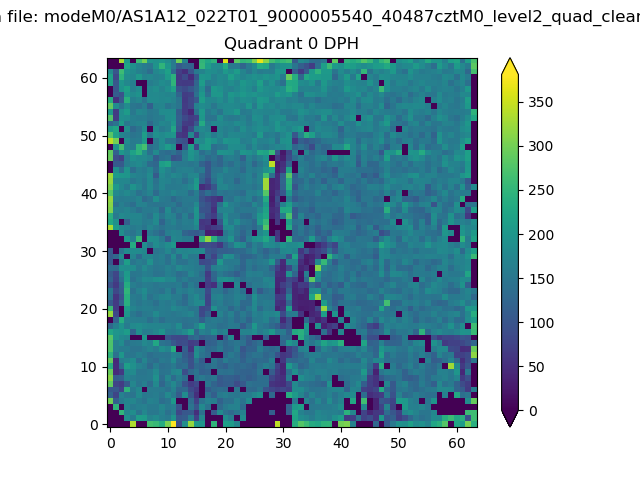 |
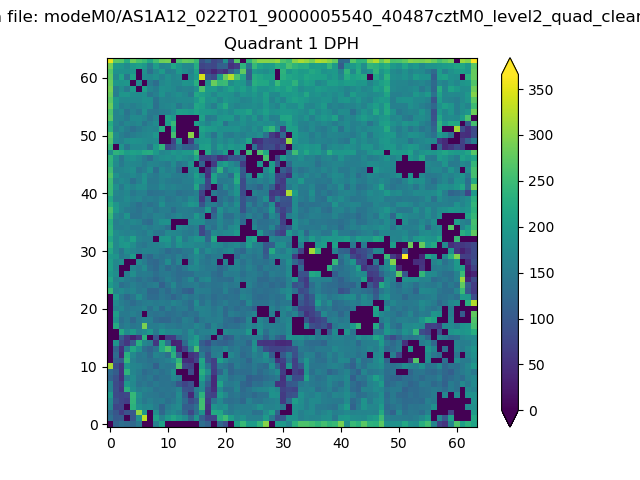 |
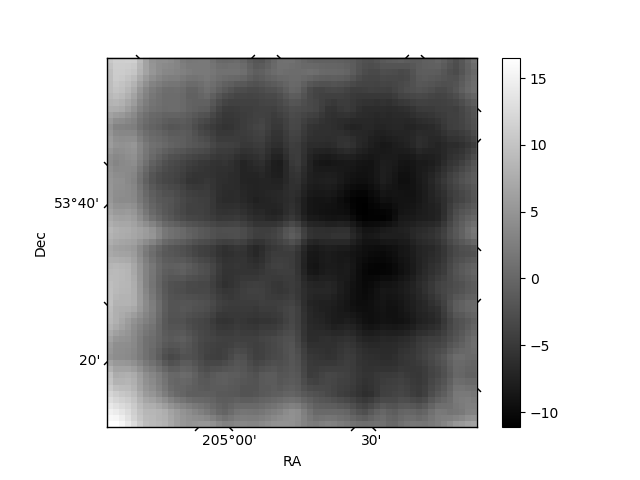
Quadrant B |
|---|---|---|---|
| Quadrant D | 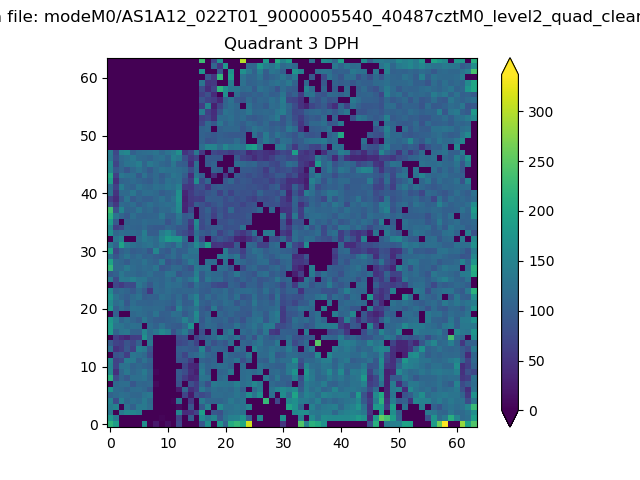 |
 |
Quadrant C |
| Plot type | Count rate plots | Images |
|---|---|---|
| Comparison with Poisson distribution Blue bars denote a histogram of data divided into 1 sec bins. Red curve is a Poisson curve with rate = median count rate of data. |
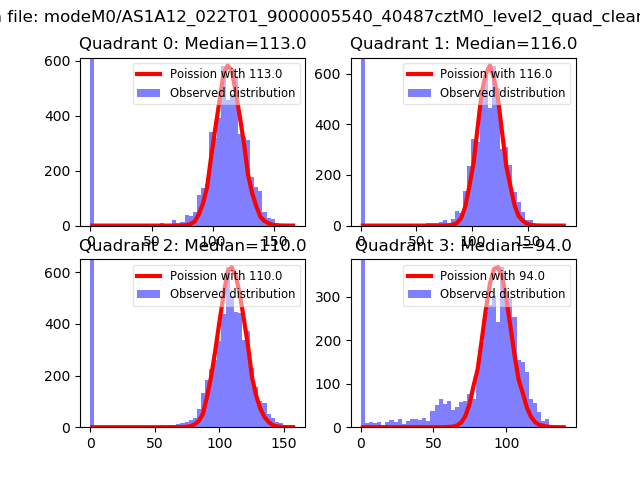 |
 |
| Quadrant-wise count rates Data is divided into 100 sec bins |
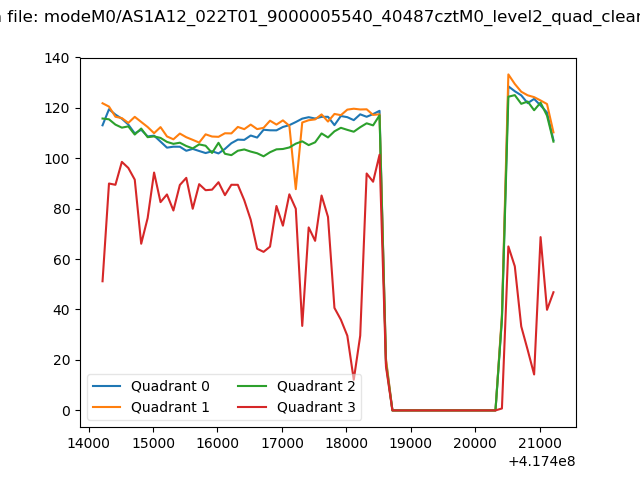 |
|
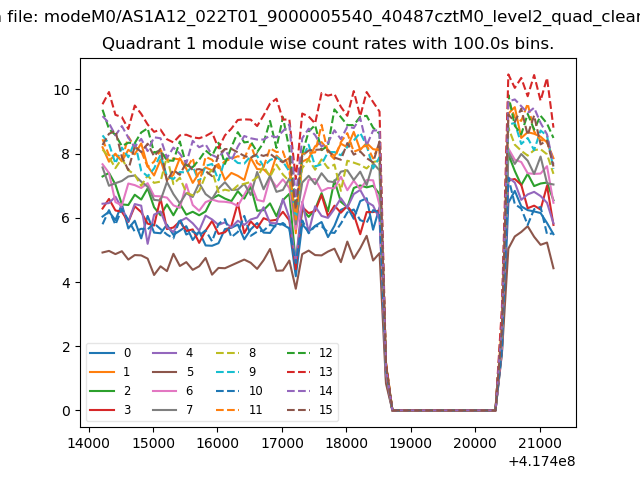
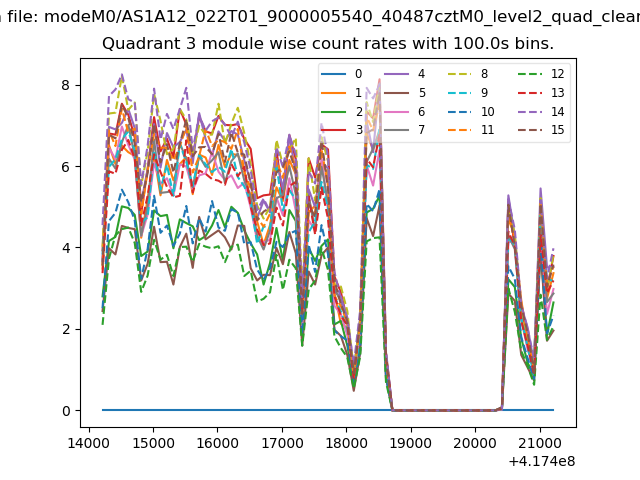
| Module-wise count rates for Quadrant A Data is divided into 100 sec bins |
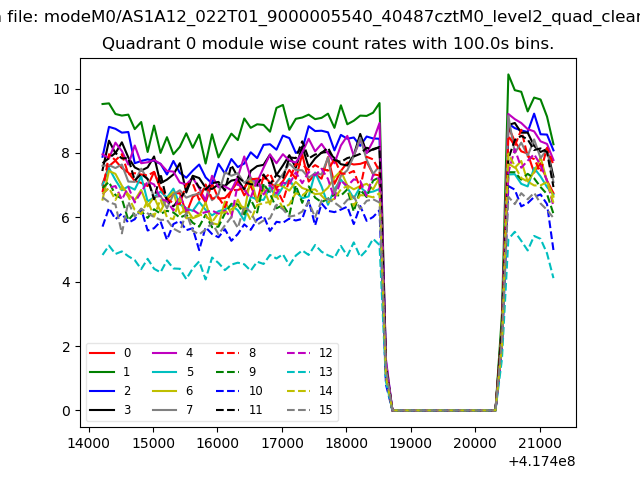 |
 |
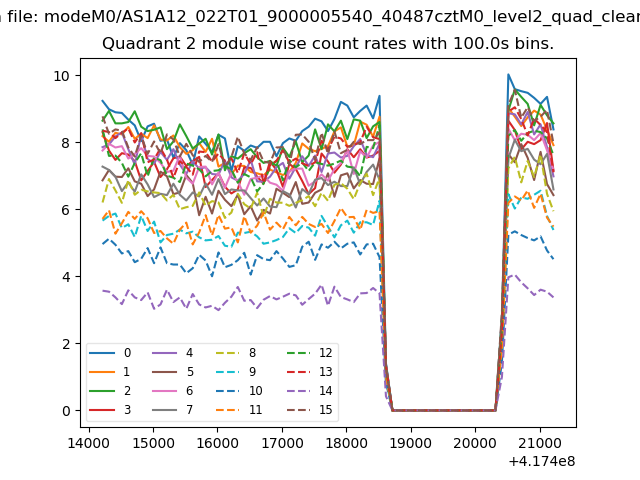
| Module-wise count rates for Quadrant B Data is divided into 100 sec bins |
 |
 |
| Module-wise count rates for Quadrant C Data is divided into 100 sec bins |
 |
 |
| Module-wise count rates for Quadrant D Data is divided into 100 sec bins |
 |
 |
| Parameter | Plot |
|---|---|
| CZT HV Monitor | 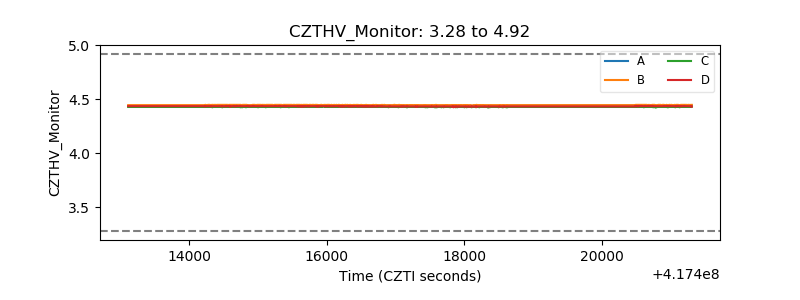 |
| D_VDD | 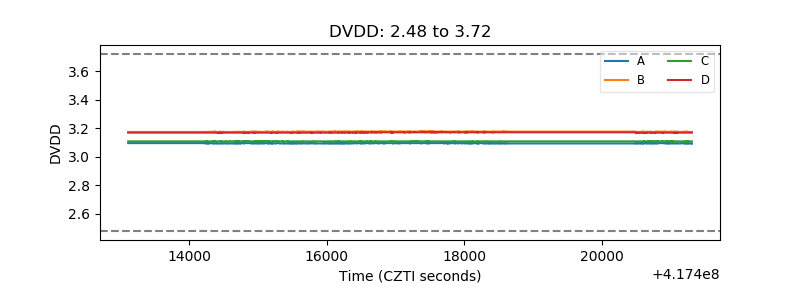 |
| Temperature 1 | 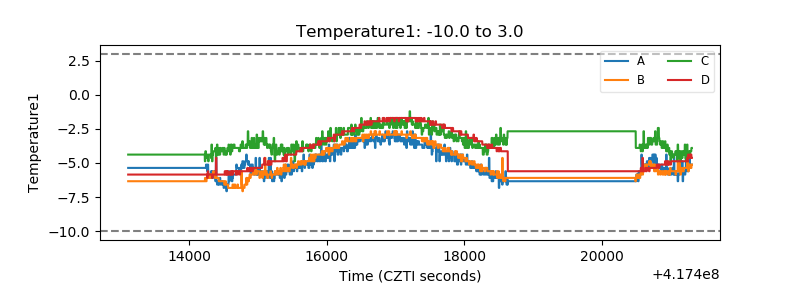 |
| Veto HV Monitor | 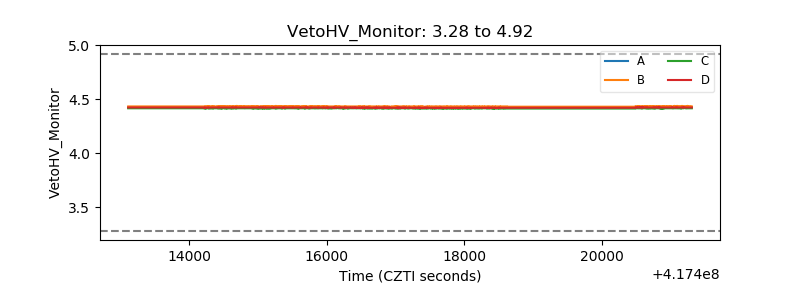 |
| Veto LLD | 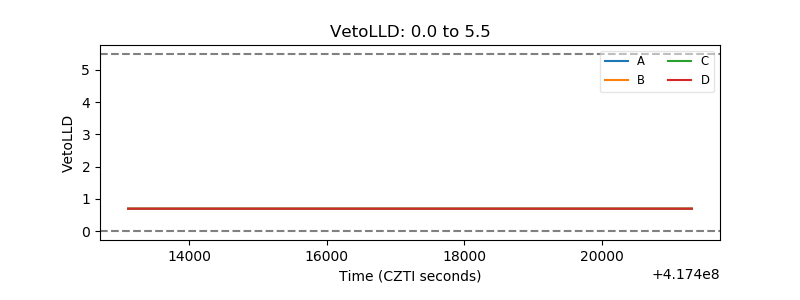 |
| Alpha Counter |  |
| _CPM_Rate | 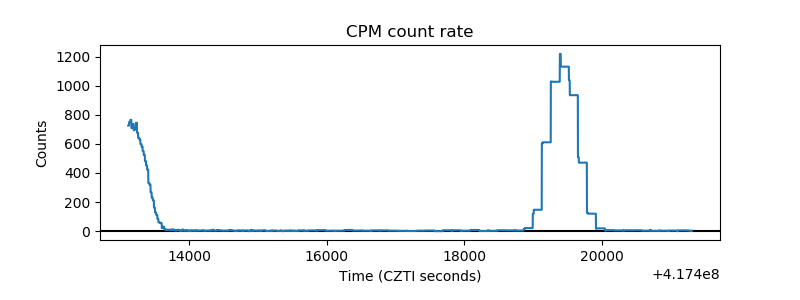 |
| CZT Counter | 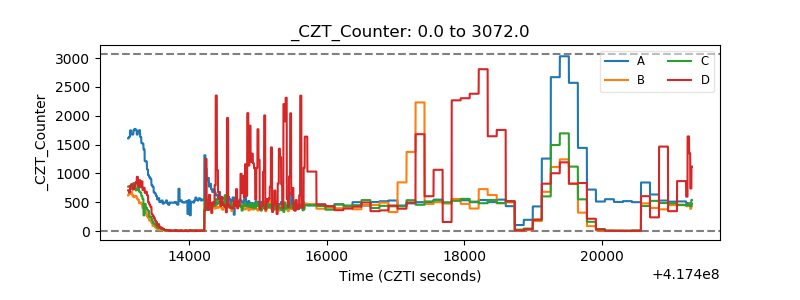 |
| +2.5 Volts monitor | 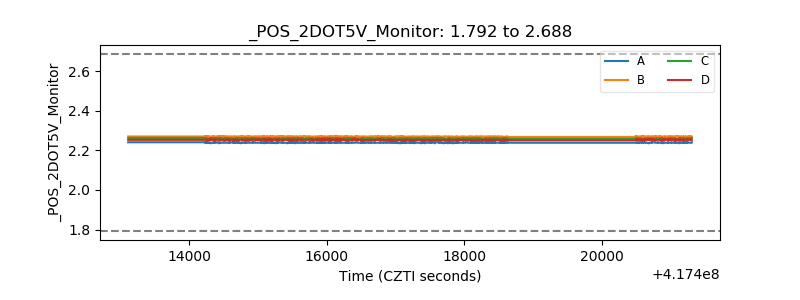 |
| +5 Volts monitor |  |
| _ROLL_ROT | 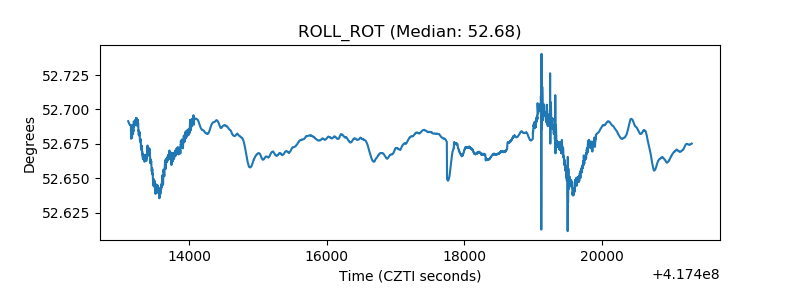 |
| _Roll_DEC | 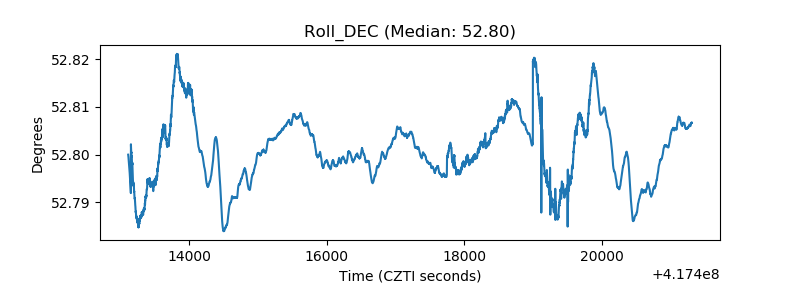 |
| _Roll_RA | 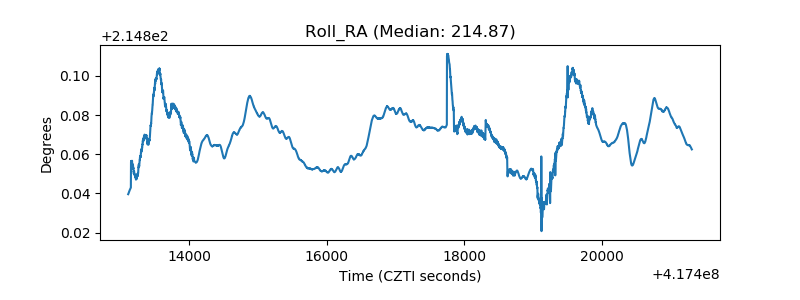 |
| Veto Counter | 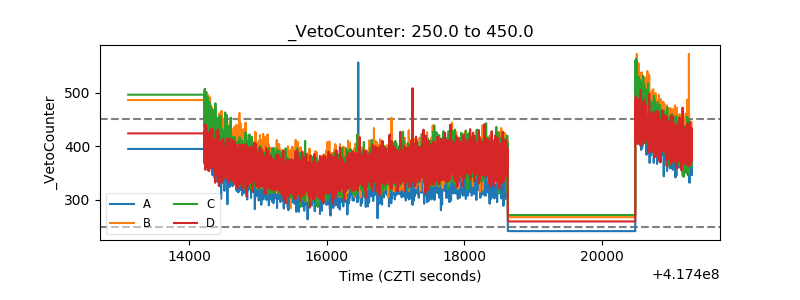 |