| Param | Original file | Final file |
|---|---|---|
| Filename | modeM0/AS1A12_022T01_9000005540_40489cztM0_level2.fits | modeM0/AS1A12_022T01_9000005540_40489cztM0_level2_quad_clean.evt |
| Size (bytes) | 1,921,864,320 | 505,048,320 |
| Size | 1.8 GB | 481.7 MB |
| Events in quadrant A | 16,143,998 | 3,549,333 |
| Events in quadrant B | 16,243,971 | 3,622,920 |
| Events in quadrant C | 15,002,966 | 3,466,361 |
| Events in quadrant D | 21,274,207 | 2,459,213 |
| Mode M0 | |||
|---|---|---|---|
| Quadrant | BADHDUFLAG | Total packets | Discarded packets |
| A | 0 | 67504 | 8 |
| B | 0 | 70719 | 7 |
| C | 0 | 65312 | 7 |
| D | 0 | 86008 | 7 |
| Mode M9 | |||
|---|---|---|---|
| Quadrant | BADHDUFLAG | Total packets | Discarded packets |
| A | 0 | 118 | 0 |
| B | 0 | 118 | 0 |
| C | 0 | 118 | 0 |
| D | 0 | 118 | 0 |
| Mode SS | |||
|---|---|---|---|
| Quadrant | BADHDUFLAG | Total packets | Discarded packets |
| A | 0 | 652 | 0 |
| B | 0 | 652 | 0 |
| C | 0 | 652 | 0 |
| D | 0 | 652 | 0 |
| Quadrant | Total seconds | Saturated seconds | Saturation percentage |
|---|---|---|---|
| A | 31901 | 49 | 0.153600% |
| B | 31901 | 322 | 1.009373% |
| C | 31901 | 40 | 0.125388% |
| D | 31901 | 8348 | 26.168459% |
Noise dominated data is calculated using 1-second bins in cleaned event files. If a bin has >2000 counts, and if more than 50% of those come from <1% of pixels, then it is considered to be noise-dominated and hence unusable.
| Quadrant | # 1 sec bins | Bins with >0 counts | Bins with >2000 counts | High rate bins dominated by noise | Noise dominated (total time) | Noise dominated (detector-on time) | Marked lightcurve |
|---|---|---|---|---|---|---|---|
| A | 43851 | 31908 | 6 | 6 | 0.01% | 0.02% | 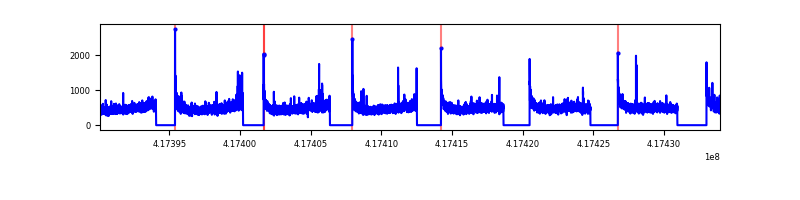 |
| B | 43851 | 31908 | 207 | 207 | 0.47% | 0.65% | 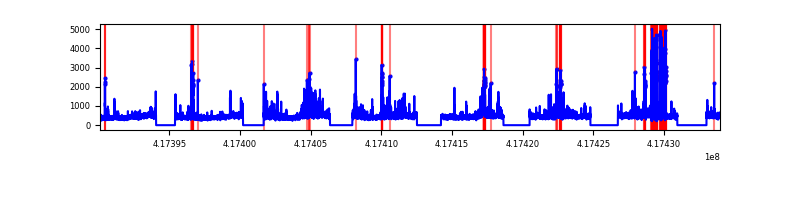 |
| C | 43851 | 31908 | 19 | 19 | 0.04% | 0.06% | 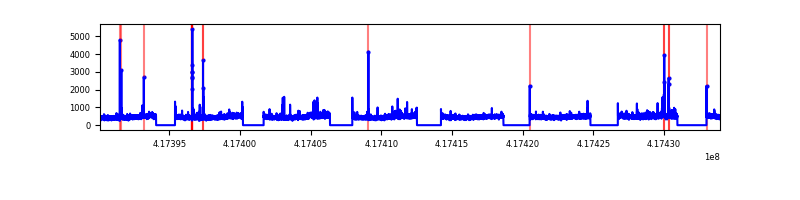 |
| D | 43851 | 31908 | 1384 | 1384 | 3.16% | 4.34% | 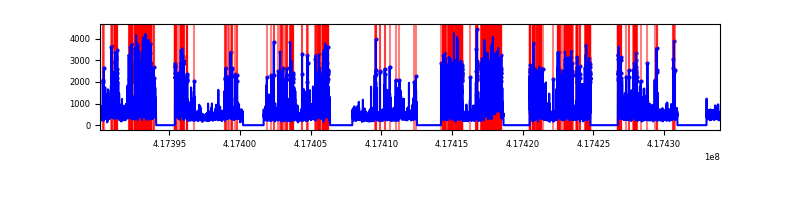 |
Top three noisy pixels from each quadrant. If the there are fewer than three noisy pixels in the level2.evt file, extra rows are filled as -1
| Pixel properties | Quadrant properties | ||||||
|---|---|---|---|---|---|---|---|
| Quadrant | DetID | PixID | Counts | Sigma | Mean | Median | Sigma |
| A | 10 | 83 | 2444485 | 3497.43 | 3478 | 3410 | 698.0 |
| A | 12 | 189 | 94887 | 131.06 | 3478 | 3410 | 698.0 |
| A | 13 | 248 | 64786 | 87.94 | 3478 | 3410 | 698.0 |
| B | 4 | 170 | 1693080 | 2617.44 | 3426 | 3325 | 645.6 |
| B | 10 | 246 | 781372 | 1205.2 | 3426 | 3325 | 645.6 |
| B | 3 | 112 | 152263 | 230.71 | 3426 | 3325 | 645.6 |
| C | 15 | 214 | 1361510 | 1771.41 | 3363 | 3383 | 766.7 |
| C | 9 | 187 | 283900 | 365.88 | 3363 | 3383 | 766.7 |
| C | 14 | 254 | 157718 | 201.3 | 3363 | 3383 | 766.7 |
| D | 2 | 250 | 4780820 | 6707.99 | 2917 | 2840 | 712.3 |
| D | 12 | 227 | 2046222 | 2868.78 | 2917 | 2840 | 712.3 |
| D | 12 | 191 | 1485858 | 2082.07 | 2917 | 2840 | 712.3 |
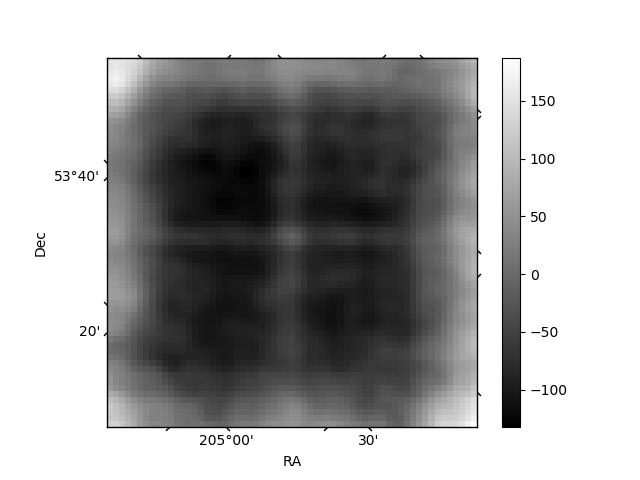
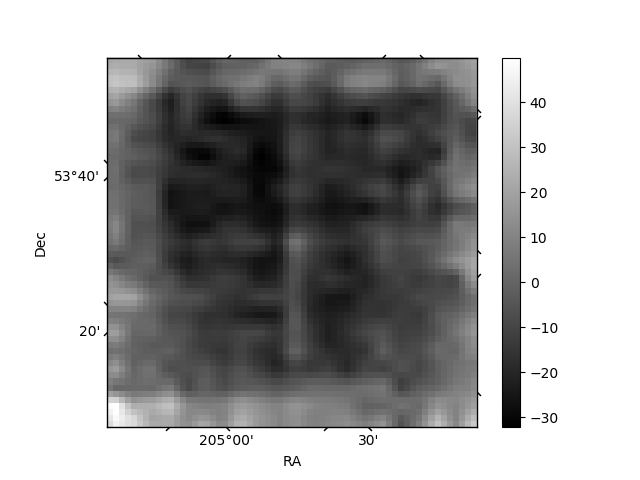
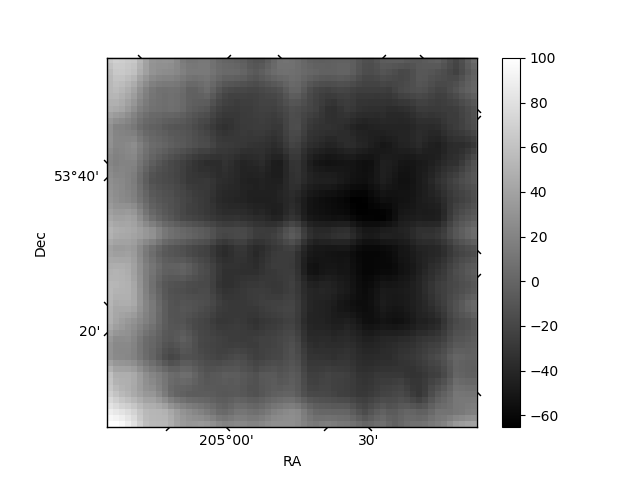
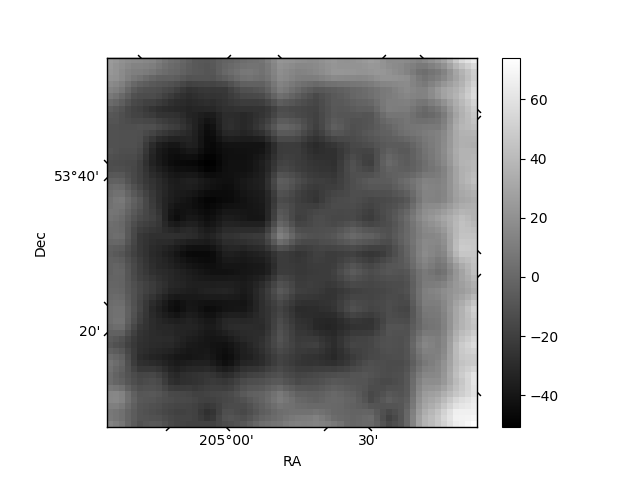
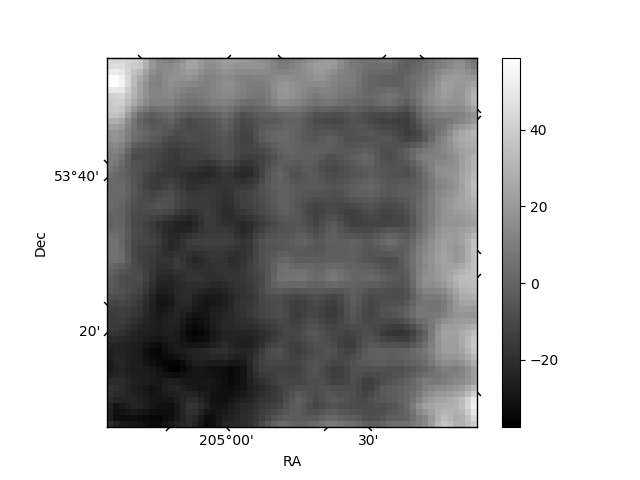
Histogram calculated using DETX and DETY for each event in the final _common_clean file
| Quadrant A | 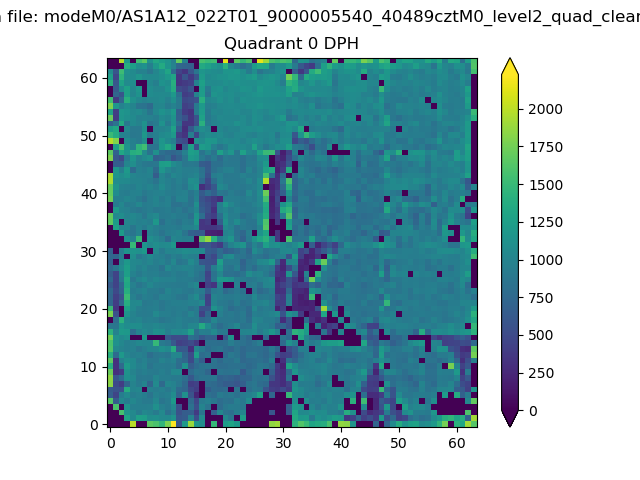 |
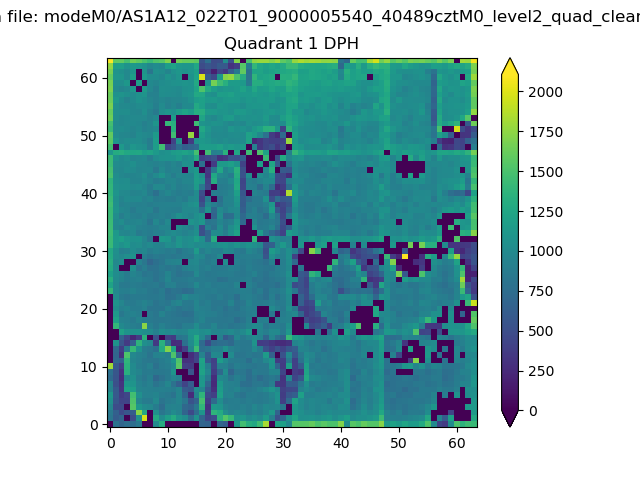 |
Quadrant B |
|---|---|---|---|
| Quadrant D | 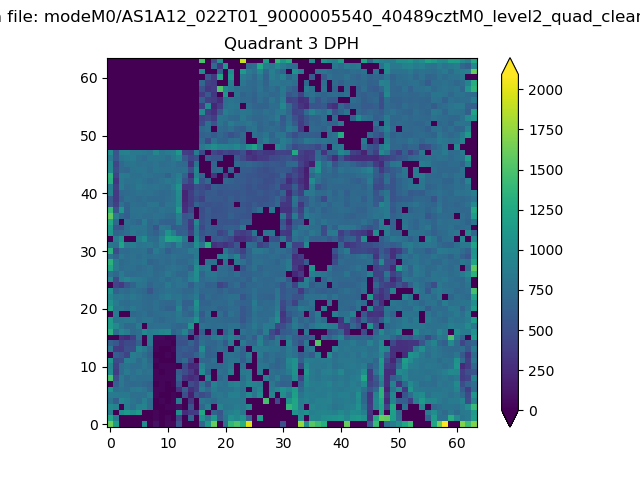 |
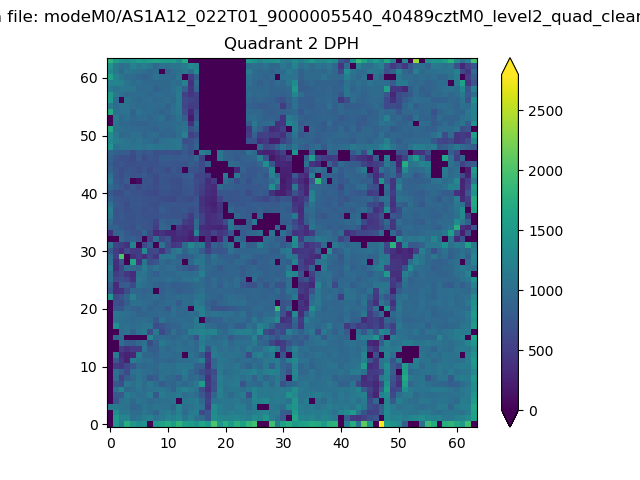 |
Quadrant C |
| Plot type | Count rate plots | Images |
|---|---|---|
| Comparison with Poisson distribution Blue bars denote a histogram of data divided into 1 sec bins. Red curve is a Poisson curve with rate = median count rate of data. |
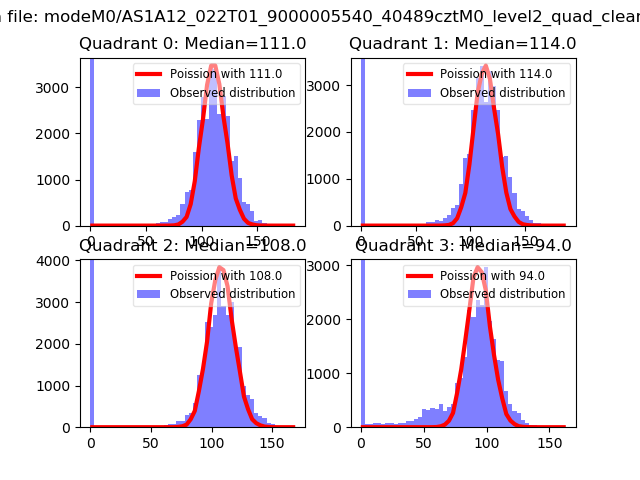 |
 |
| Quadrant-wise count rates Data is divided into 100 sec bins |
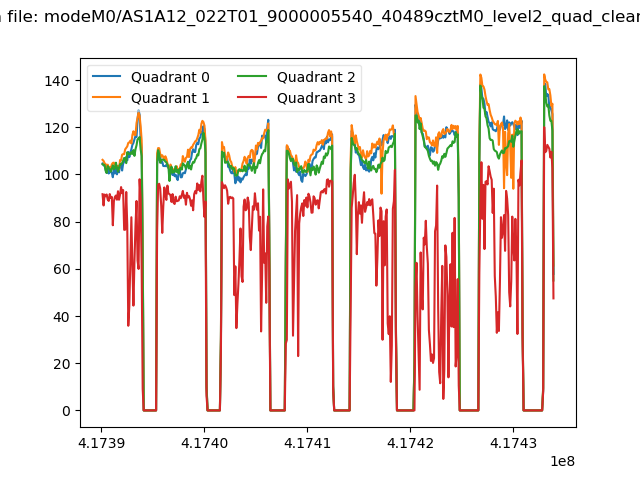 |
|
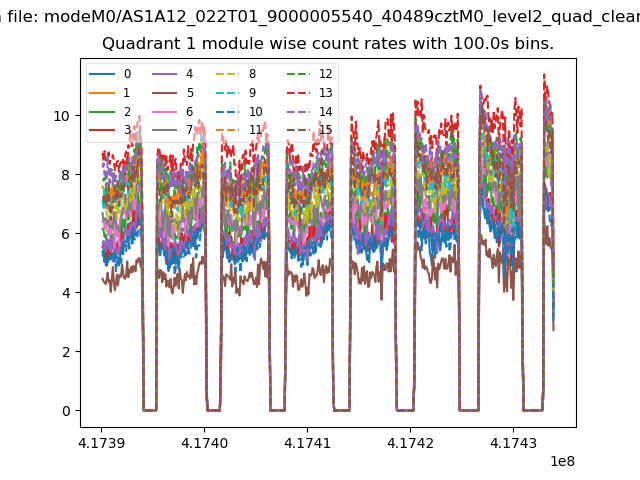
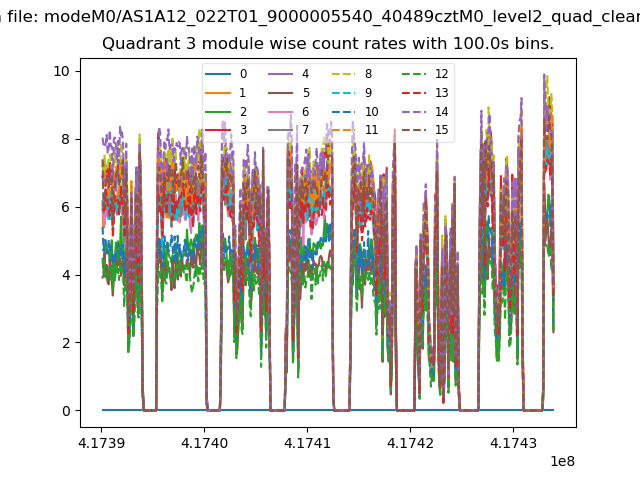
| Module-wise count rates for Quadrant A Data is divided into 100 sec bins |
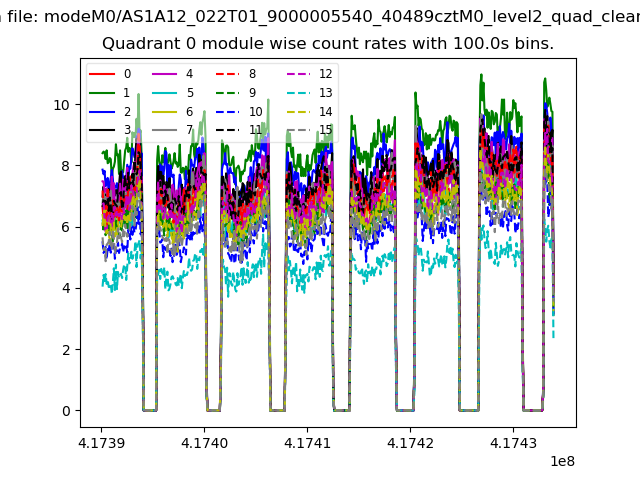 |
 |
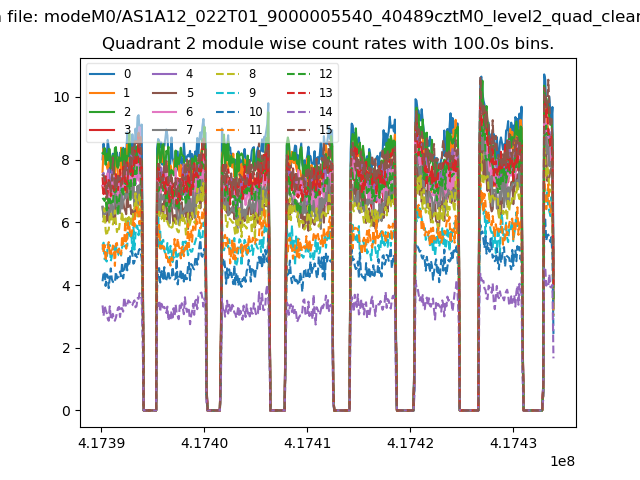
| Module-wise count rates for Quadrant B Data is divided into 100 sec bins |
 |
 |
| Module-wise count rates for Quadrant C Data is divided into 100 sec bins |
 |
 |
| Module-wise count rates for Quadrant D Data is divided into 100 sec bins |
 |
 |
| Parameter | Plot |
|---|---|
| CZT HV Monitor |  |
| D_VDD | 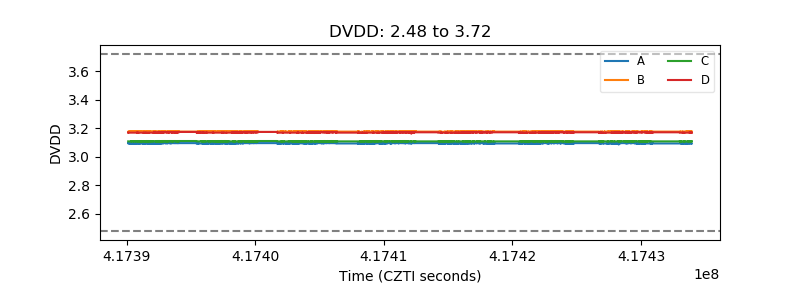 |
| Temperature 1 | 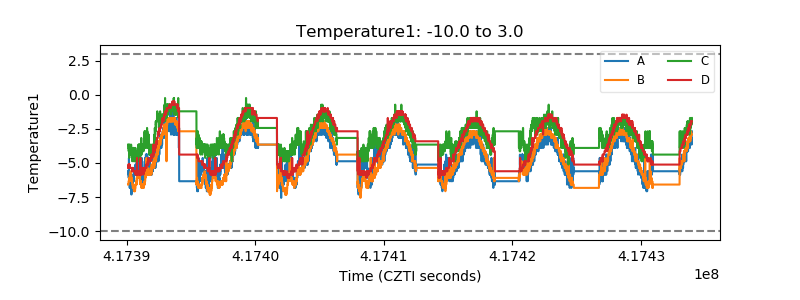 |
| Veto HV Monitor | 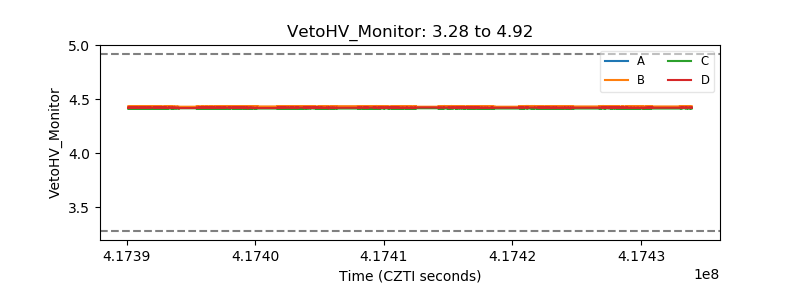 |
| Veto LLD | 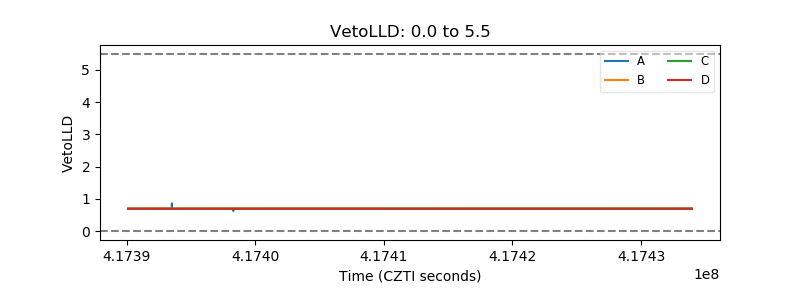 |
| Alpha Counter | 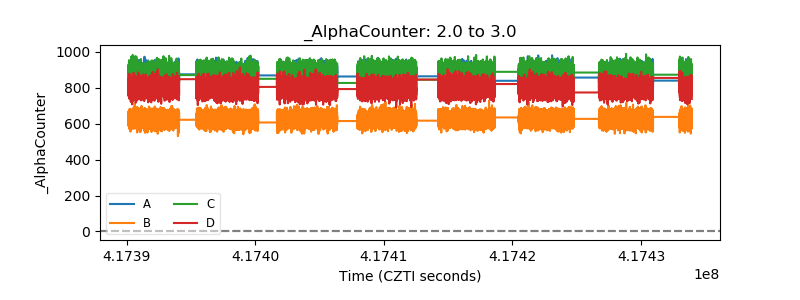 |
| _CPM_Rate | 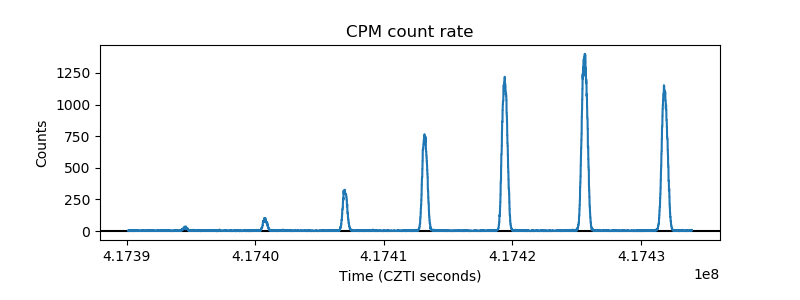 |
| CZT Counter | 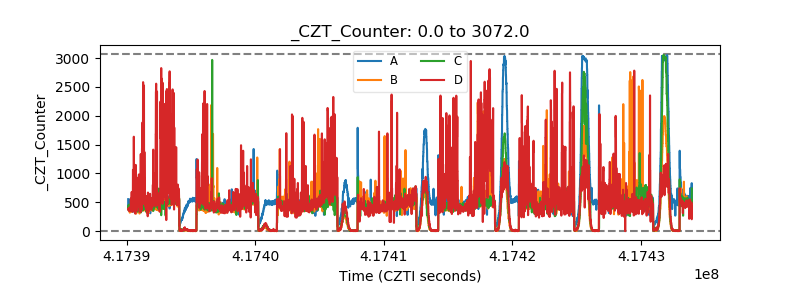 |
| +2.5 Volts monitor | 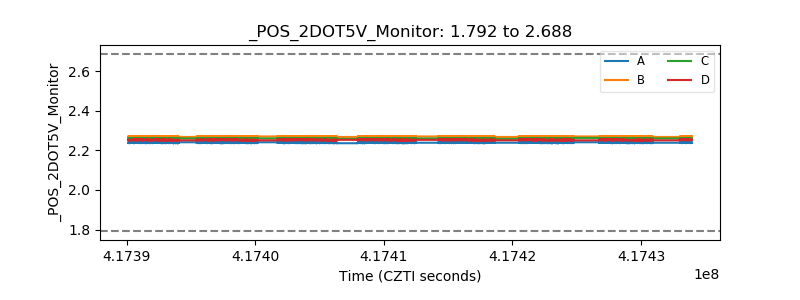 |
| +5 Volts monitor | 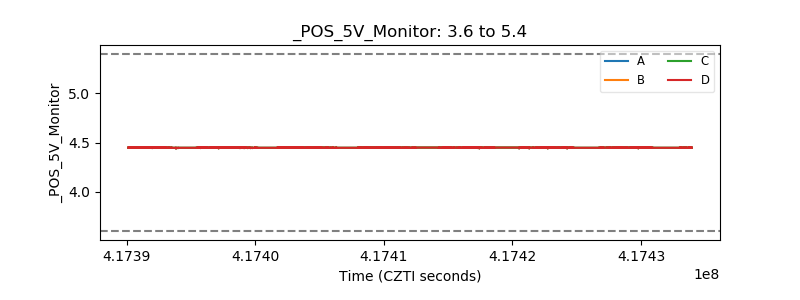 |
| _ROLL_ROT | 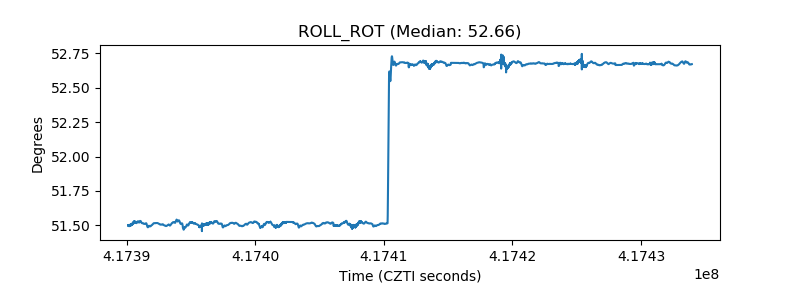 |
| _Roll_DEC | 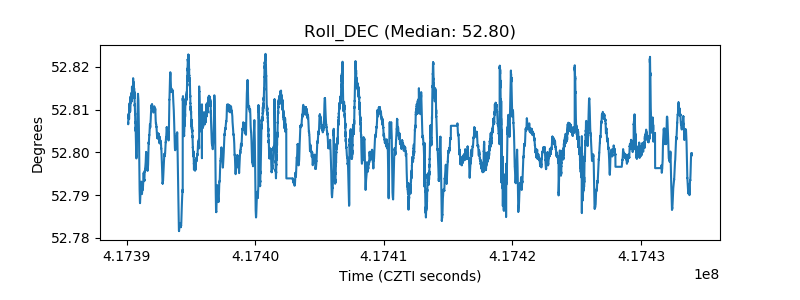 |
| _Roll_RA | 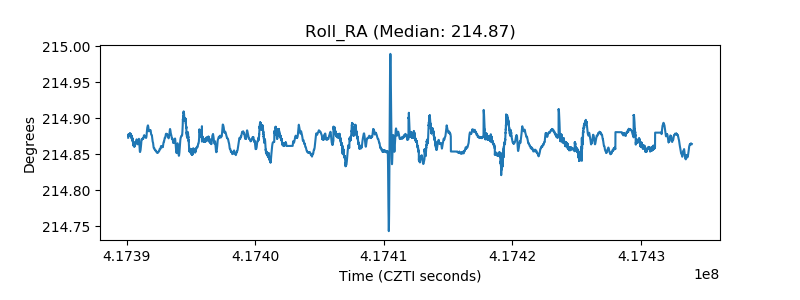 |
| Veto Counter | 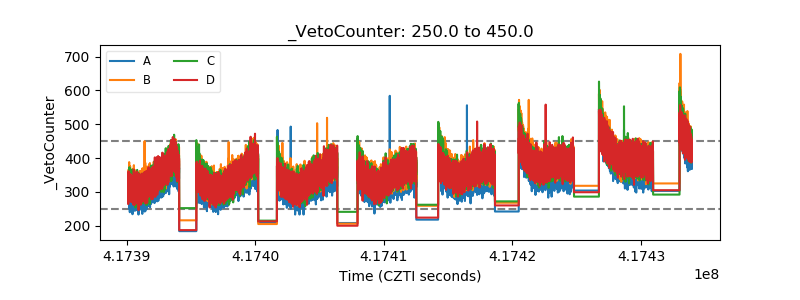 |