| Param | Original file | Final file |
|---|---|---|
| Filename | modeM0/AS1A12_022T01_9000005540_40490cztM0_level2.fits | modeM0/AS1A12_022T01_9000005540_40490cztM0_level2_quad_clean.evt |
| Size (bytes) | 329,247,360 | 92,056,320 |
| Size | 314.0 MB | 87.8 MB |
| Events in quadrant A | 2,921,525 | 650,717 |
| Events in quadrant B | 2,589,242 | 666,456 |
| Events in quadrant C | 2,775,963 | 618,916 |
| Events in quadrant D | 3,490,075 | 482,726 |
| Mode M0 | |||
|---|---|---|---|
| Quadrant | BADHDUFLAG | Total packets | Discarded packets |
| A | 0 | 11719 | 3 |
| B | 0 | 11003 | 2 |
| C | 0 | 11315 | 2 |
| D | 0 | 13820 | 2 |
| Mode M9 | |||
|---|---|---|---|
| Quadrant | BADHDUFLAG | Total packets | Discarded packets |
| A | 0 | 34 | 0 |
| B | 0 | 34 | 0 |
| C | 0 | 34 | 0 |
| D | 0 | 35 | 0 |
| Mode SS | |||
|---|---|---|---|
| Quadrant | BADHDUFLAG | Total packets | Discarded packets |
| A | 0 | 108 | 0 |
| B | 0 | 108 | 0 |
| C | 0 | 108 | 0 |
| D | 0 | 108 | 0 |
| Quadrant | Total seconds | Saturated seconds | Saturation percentage |
|---|---|---|---|
| A | 5262 | 10 | 0.190042% |
| B | 5262 | 14 | 0.266059% |
| C | 5262 | 7 | 0.133029% |
| D | 5262 | 983 | 18.681110% |
Noise dominated data is calculated using 1-second bins in cleaned event files. If a bin has >2000 counts, and if more than 50% of those come from <1% of pixels, then it is considered to be noise-dominated and hence unusable.
| Quadrant | # 1 sec bins | Bins with >0 counts | Bins with >2000 counts | High rate bins dominated by noise | Noise dominated (total time) | Noise dominated (detector-on time) | Marked lightcurve |
|---|---|---|---|---|---|---|---|
| A | 7386 | 5264 | 2 | 2 | 0.03% | 0.04% | 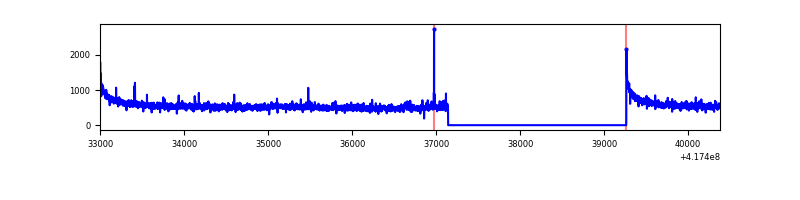 |
| B | 7386 | 5264 | 8 | 8 | 0.11% | 0.15% | 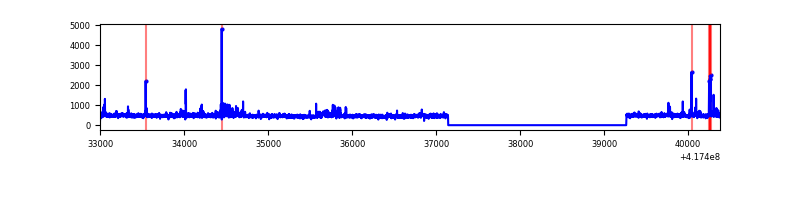 |
| C | 7386 | 5264 | 5 | 5 | 0.07% | 0.09% | 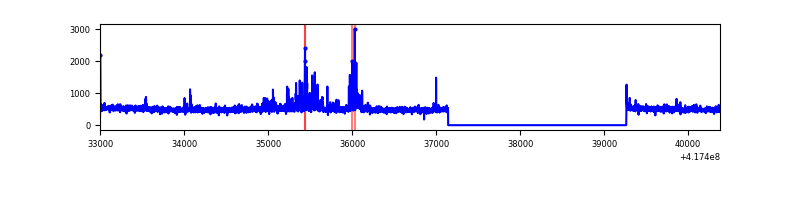 |
| D | 7386 | 5264 | 262 | 262 | 3.55% | 4.98% | 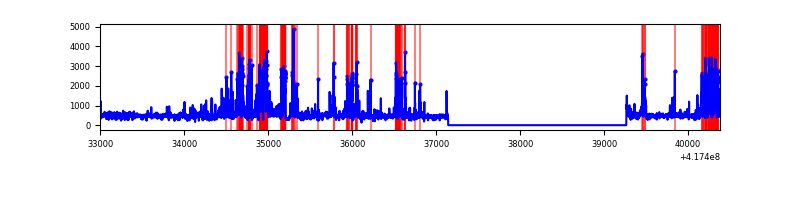 |
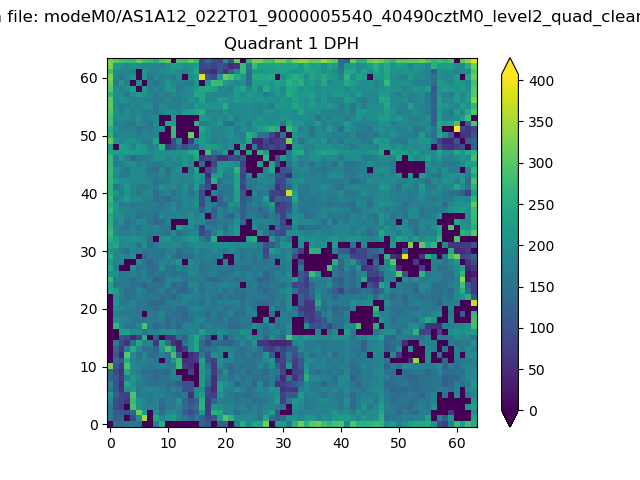
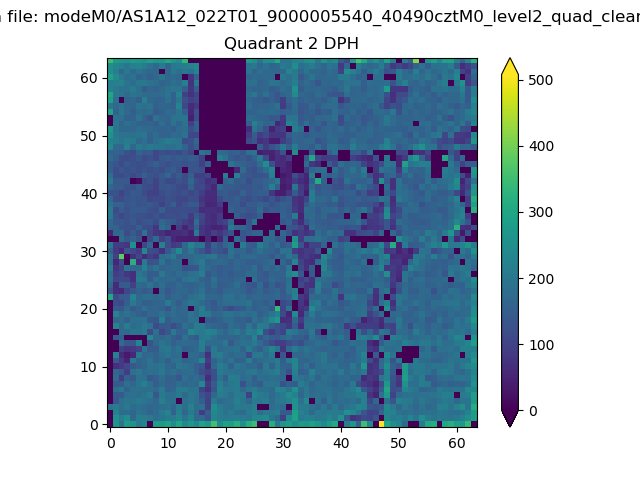
Top three noisy pixels from each quadrant. If the there are fewer than three noisy pixels in the level2.evt file, extra rows are filled as -1
| Pixel properties | Quadrant properties | ||||||
|---|---|---|---|---|---|---|---|
| Quadrant | DetID | PixID | Counts | Sigma | Mean | Median | Sigma |
| A | 10 | 83 | 480068 | 3890.64 | 612 | 602 | 123.2 |
| A | 12 | 189 | 29199 | 232.05 | 612 | 602 | 123.2 |
| A | 13 | 28 | 15592 | 121.64 | 612 | 602 | 123.2 |
| B | 4 | 170 | 110800 | 961.58 | 603 | 587 | 114.6 |
| B | 15 | 35 | 45096 | 388.33 | 603 | 587 | 114.6 |
| B | 5 | 255 | 37349 | 320.74 | 603 | 587 | 114.6 |
| C | 15 | 214 | 231977 | 1709.23 | 586 | 591 | 135.4 |
| C | 9 | 187 | 214750 | 1581.98 | 586 | 591 | 135.4 |
| C | 14 | 254 | 33322 | 241.78 | 586 | 591 | 135.4 |
| D | 2 | 250 | 762517 | 5831.28 | 538 | 525 | 130.7 |
| D | 12 | 128 | 204437 | 1560.47 | 538 | 525 | 130.7 |
| D | 12 | 191 | 182848 | 1395.26 | 538 | 525 | 130.7 |
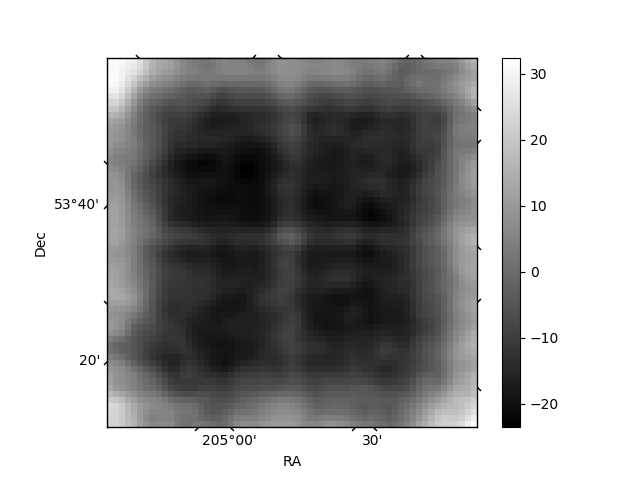
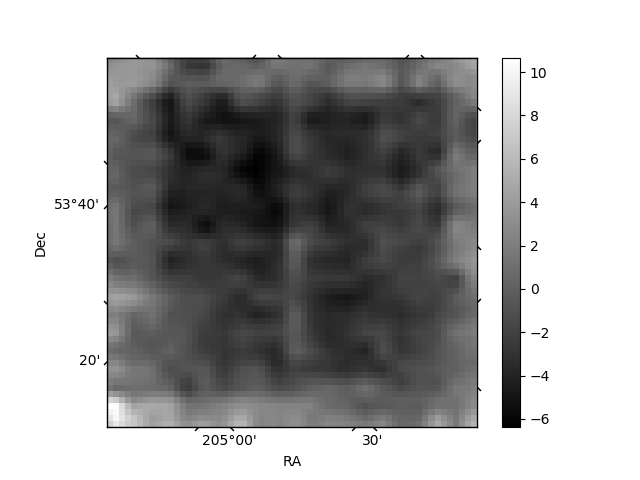
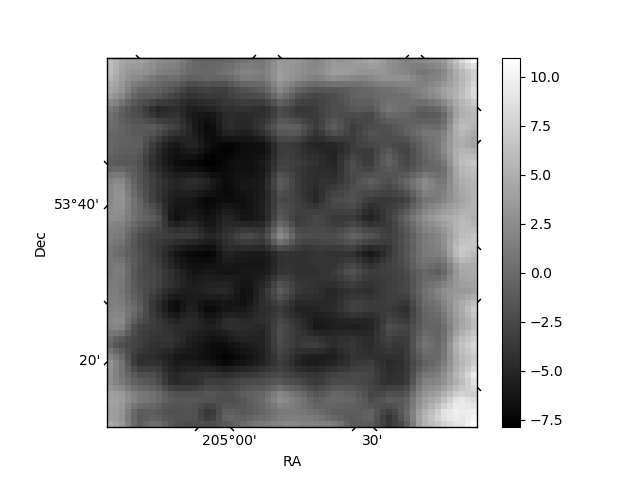
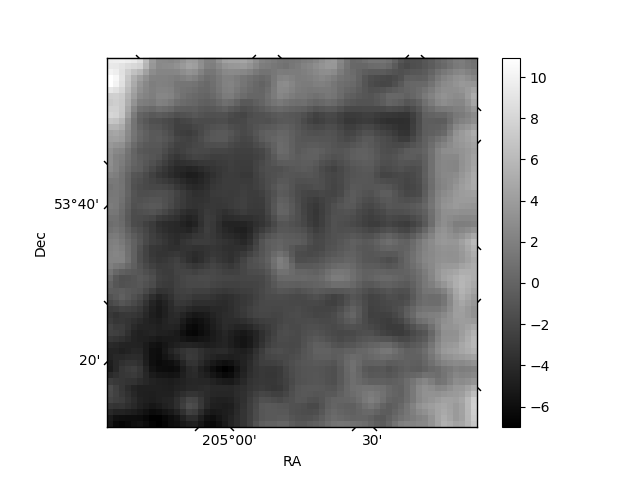
Histogram calculated using DETX and DETY for each event in the final _common_clean file
| Quadrant A | 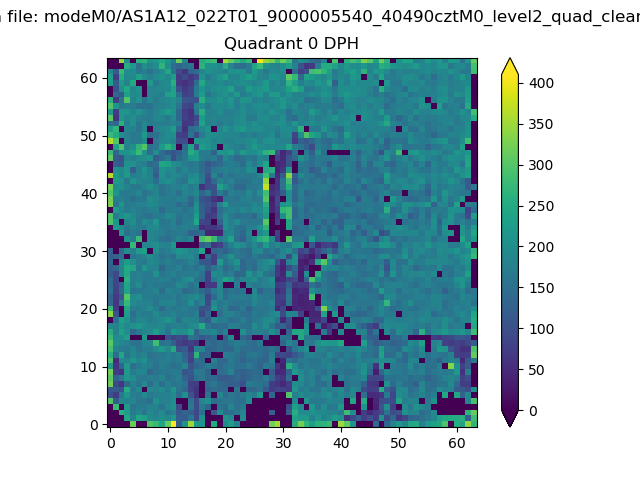 |
 |
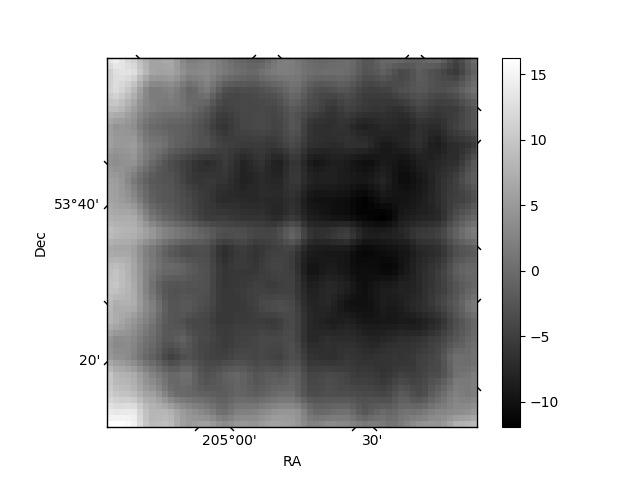
Quadrant B |
|---|---|---|---|
| Quadrant D | 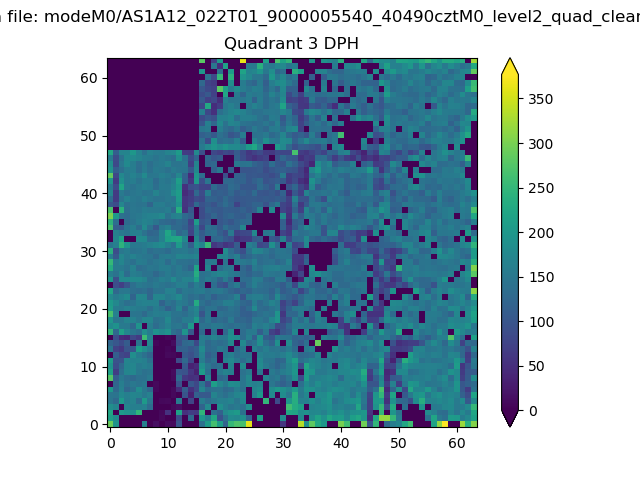 |
 |
Quadrant C |
| Plot type | Count rate plots | Images |
|---|---|---|
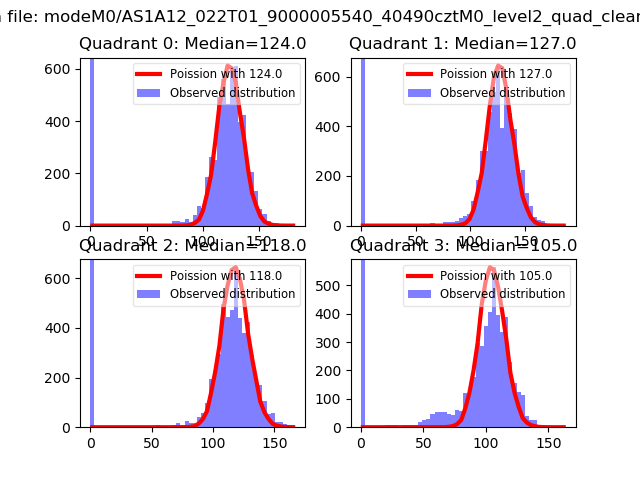
| Comparison with Poisson distribution Blue bars denote a histogram of data divided into 1 sec bins. Red curve is a Poisson curve with rate = median count rate of data. |
 |
 |
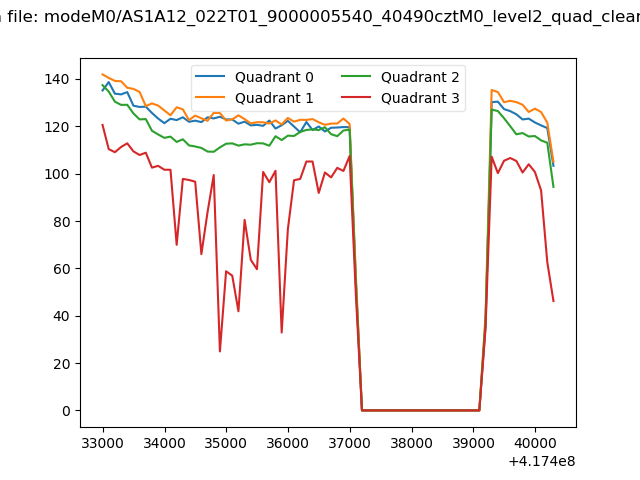
| Quadrant-wise count rates Data is divided into 100 sec bins |
 |
|
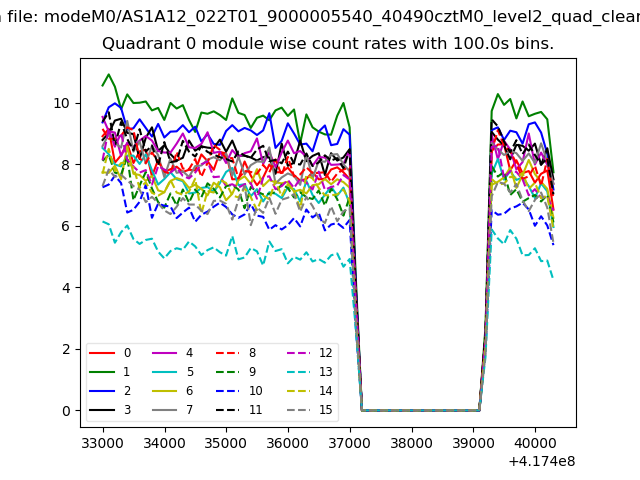
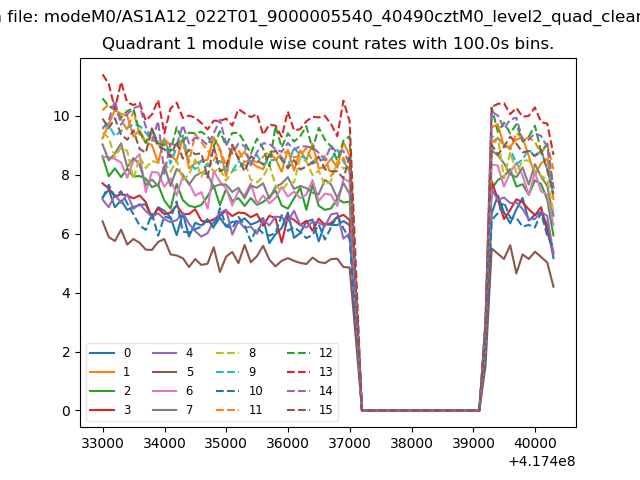
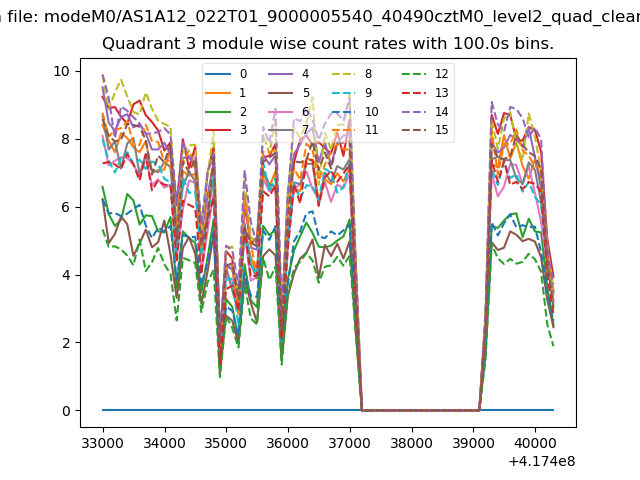
| Module-wise count rates for Quadrant A Data is divided into 100 sec bins |
 |
 |
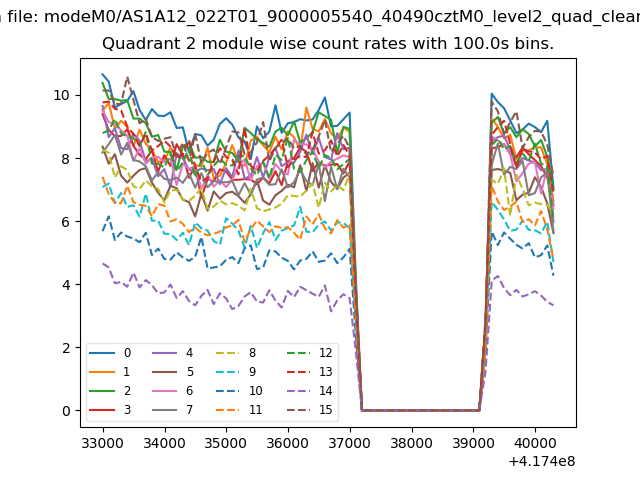
| Module-wise count rates for Quadrant B Data is divided into 100 sec bins |
 |
 |
| Module-wise count rates for Quadrant C Data is divided into 100 sec bins |
 |
 |
| Module-wise count rates for Quadrant D Data is divided into 100 sec bins |
 |
 |
| Parameter | Plot |
|---|---|
| CZT HV Monitor | 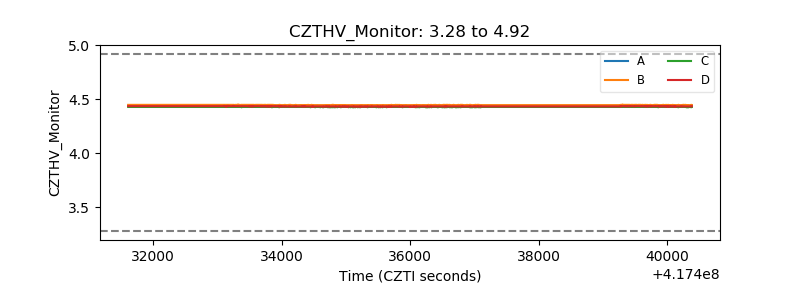 |
| D_VDD | 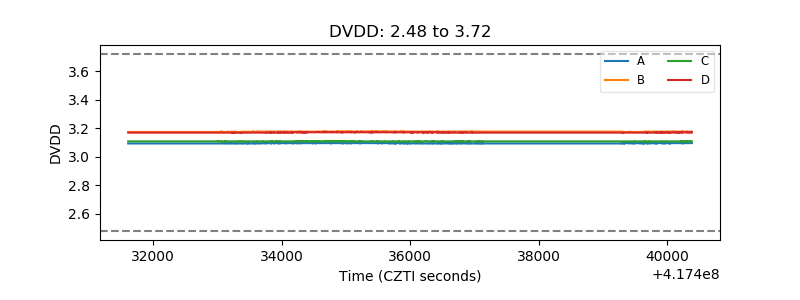 |
| Temperature 1 | 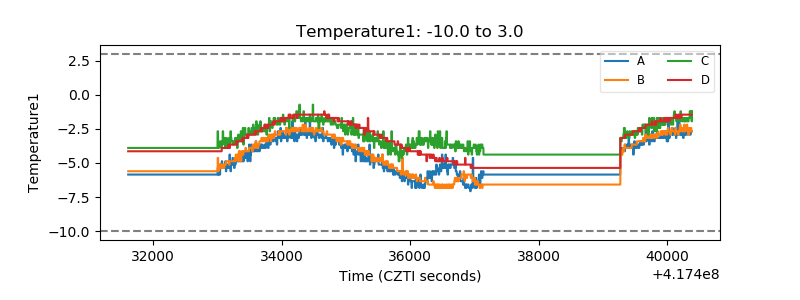 |
| Veto HV Monitor | 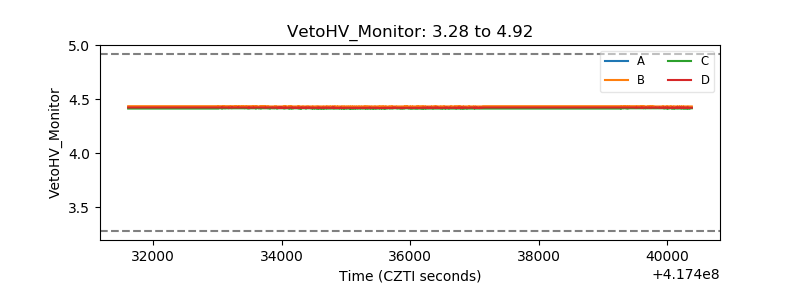 |
| Veto LLD | 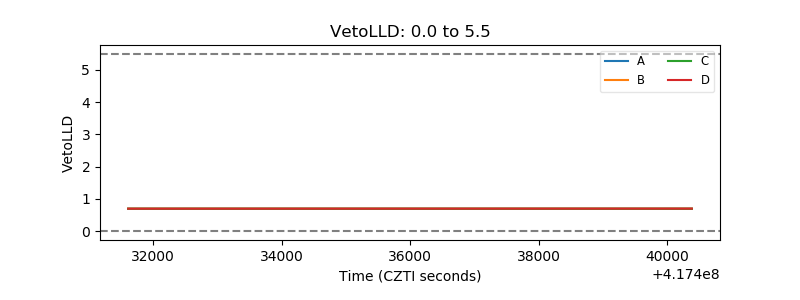 |
| Alpha Counter | 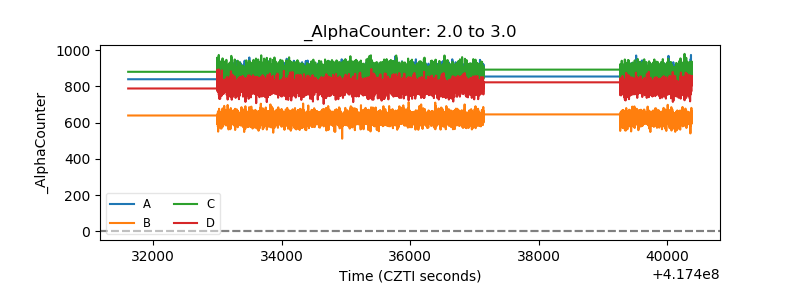 |
| _CPM_Rate | 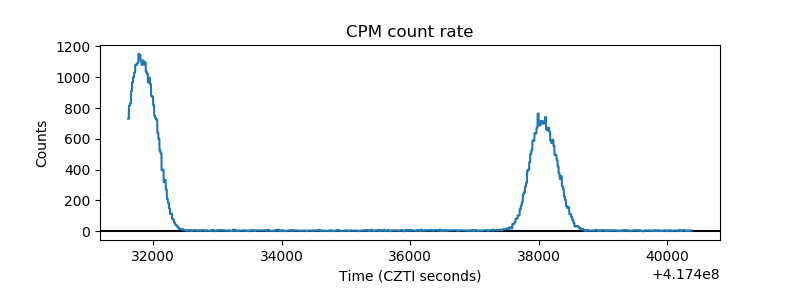 |
| CZT Counter | 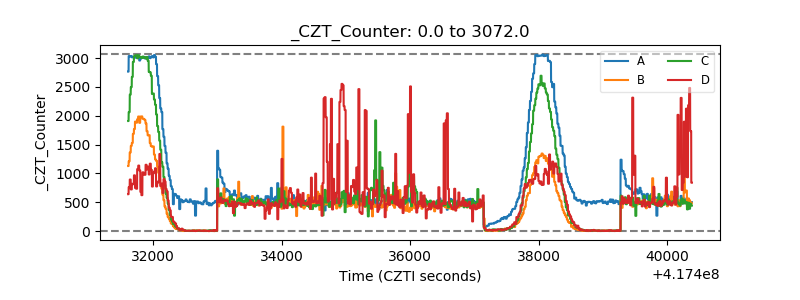 |
| +2.5 Volts monitor | 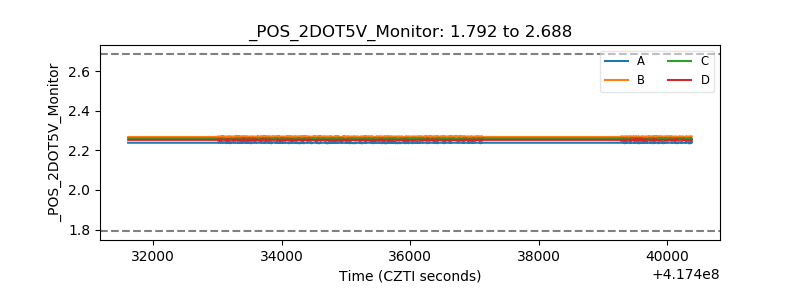 |
| +5 Volts monitor | 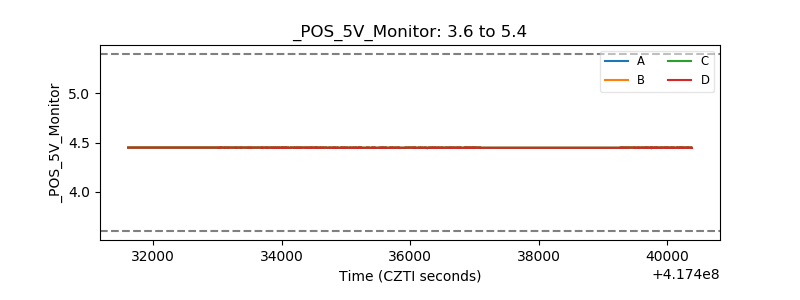 |
| _ROLL_ROT | 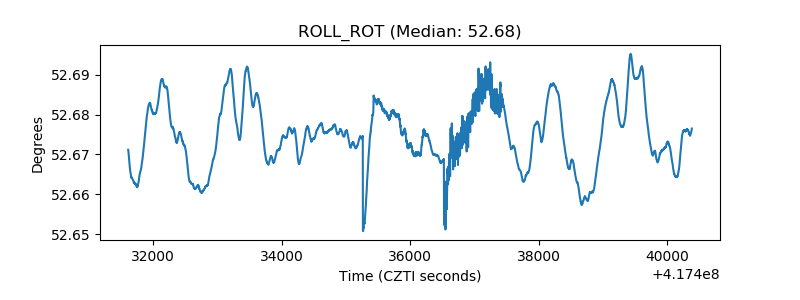 |
| _Roll_DEC | 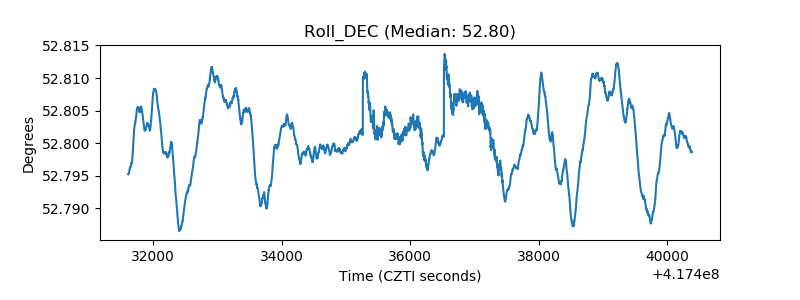 |
| _Roll_RA | 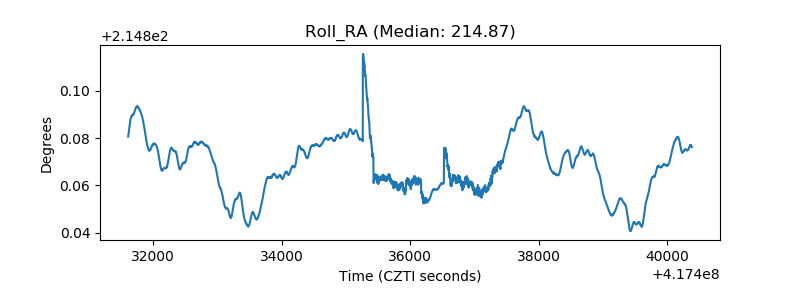 |
| Veto Counter | 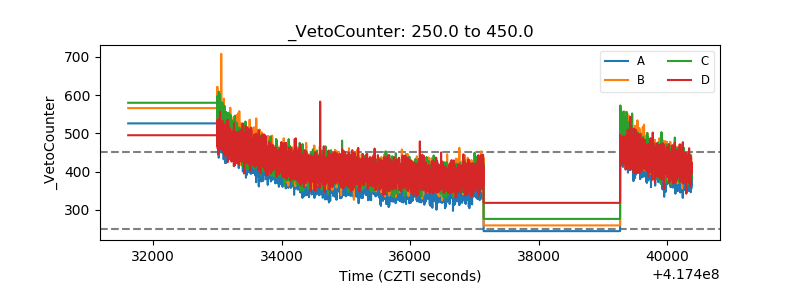 |