| Param | Original file | Final file |
|---|---|---|
| Filename | modeM0/AS1A12_022T01_9000005540_40491cztM0_level2.fits | modeM0/AS1A12_022T01_9000005540_40491cztM0_level2_quad_clean.evt |
| Size (bytes) | 345,499,200 | 85,291,200 |
| Size | 329.5 MB | 81.3 MB |
| Events in quadrant A | 2,808,807 | 611,855 |
| Events in quadrant B | 2,675,918 | 621,097 |
| Events in quadrant C | 2,500,923 | 583,730 |
| Events in quadrant D | 4,402,844 | 406,083 |
| Mode M0 | |||
|---|---|---|---|
| Quadrant | BADHDUFLAG | Total packets | Discarded packets |
| A | 0 | 11443 | 3 |
| B | 0 | 11353 | 2 |
| C | 0 | 10494 | 2 |
| D | 0 | 16592 | 2 |
| Mode M9 | |||
|---|---|---|---|
| Quadrant | BADHDUFLAG | Total packets | Discarded packets |
| A | 0 | 32 | 0 |
| B | 0 | 32 | 0 |
| C | 0 | 32 | 0 |
| D | 0 | 33 | 0 |
| Mode SS | |||
|---|---|---|---|
| Quadrant | BADHDUFLAG | Total packets | Discarded packets |
| A | 0 | 104 | 0 |
| B | 0 | 104 | 0 |
| C | 0 | 104 | 0 |
| D | 0 | 104 | 0 |
| Quadrant | Total seconds | Saturated seconds | Saturation percentage |
|---|---|---|---|
| A | 5131 | 9 | 0.175404% |
| B | 5131 | 55 | 1.071916% |
| C | 5131 | 7 | 0.136426% |
| D | 5131 | 1511 | 29.448451% |
Noise dominated data is calculated using 1-second bins in cleaned event files. If a bin has >2000 counts, and if more than 50% of those come from <1% of pixels, then it is considered to be noise-dominated and hence unusable.
| Quadrant | # 1 sec bins | Bins with >0 counts | Bins with >2000 counts | High rate bins dominated by noise | Noise dominated (total time) | Noise dominated (detector-on time) | Marked lightcurve |
|---|---|---|---|---|---|---|---|
| A | 7254 | 5132 | 3 | 3 | 0.04% | 0.06% | 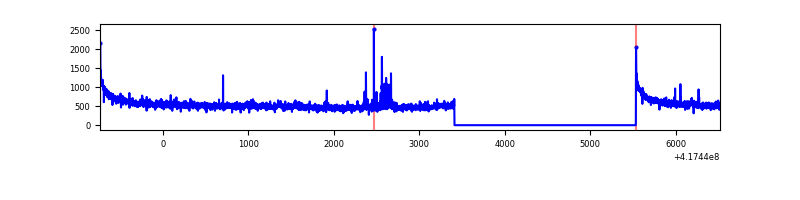 |
| B | 7254 | 5132 | 42 | 42 | 0.58% | 0.82% | 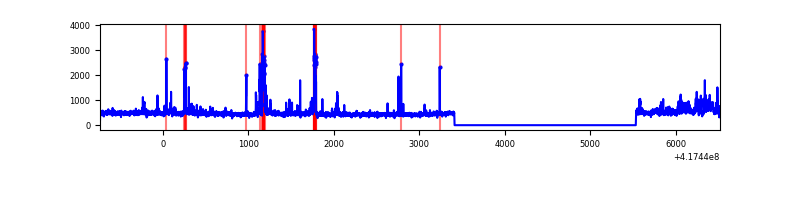 |
| C | 7254 | 5132 | 3 | 3 | 0.04% | 0.06% | 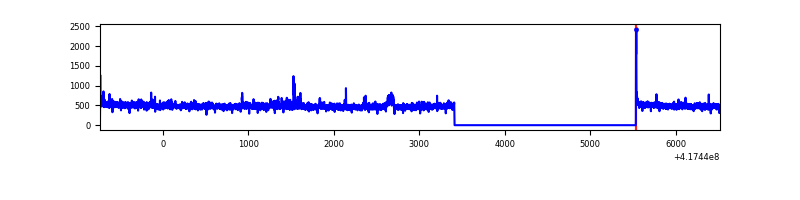 |
| D | 7254 | 5132 | 549 | 549 | 7.57% | 10.70% | 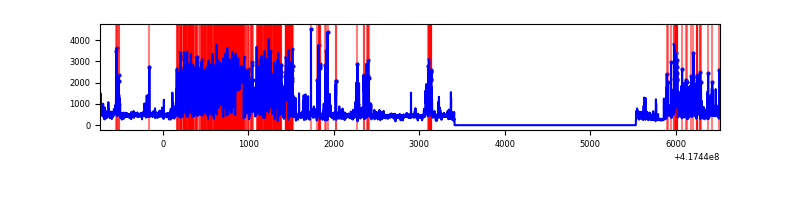 |
Top three noisy pixels from each quadrant. If the there are fewer than three noisy pixels in the level2.evt file, extra rows are filled as -1
| Pixel properties | Quadrant properties | ||||||
|---|---|---|---|---|---|---|---|
| Quadrant | DetID | PixID | Counts | Sigma | Mean | Median | Sigma |
| A | 10 | 83 | 481247 | 4137.62 | 578 | 568 | 116.2 |
| A | 13 | 248 | 46411 | 394.61 | 578 | 568 | 116.2 |
| A | 2 | 79 | 18566 | 154.92 | 578 | 568 | 116.2 |
| B | 4 | 170 | 235520 | 2133.45 | 570 | 554 | 110.1 |
| B | 5 | 255 | 98108 | 885.77 | 570 | 554 | 110.1 |
| B | 0 | 230 | 41506 | 371.84 | 570 | 554 | 110.1 |
| C | 15 | 214 | 225320 | 1732.66 | 561 | 566 | 129.7 |
| C | 9 | 187 | 46452 | 353.74 | 561 | 566 | 129.7 |
| C | 10 | 20 | 18106 | 135.22 | 561 | 566 | 129.7 |
| D | 2 | 250 | 2049375 | 17473.0 | 475 | 462 | 117.3 |
| D | 12 | 191 | 185414 | 1577.26 | 475 | 462 | 117.3 |
| D | 13 | 249 | 125717 | 1068.17 | 475 | 462 | 117.3 |
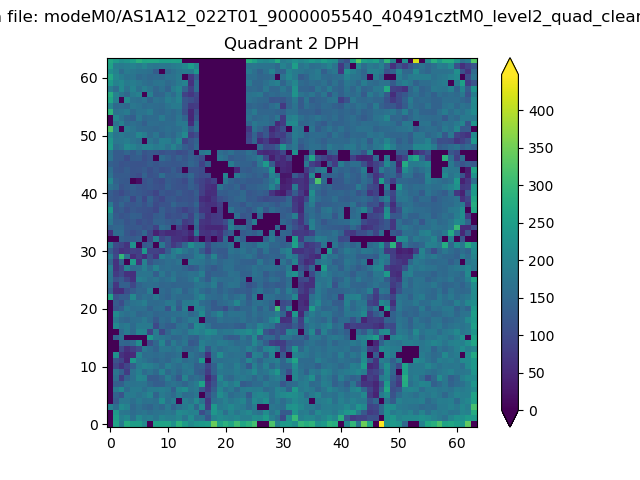
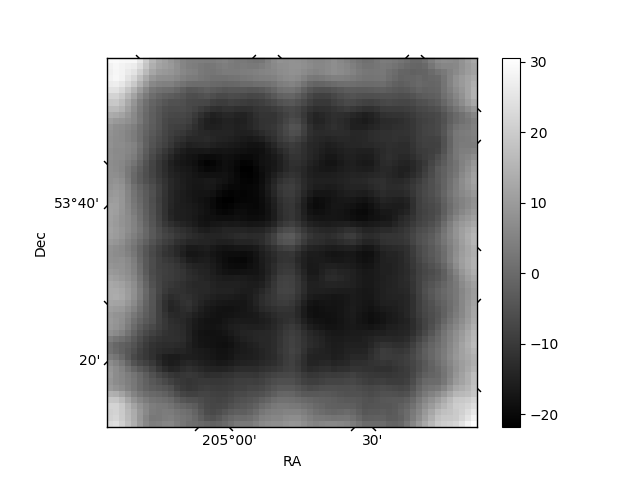
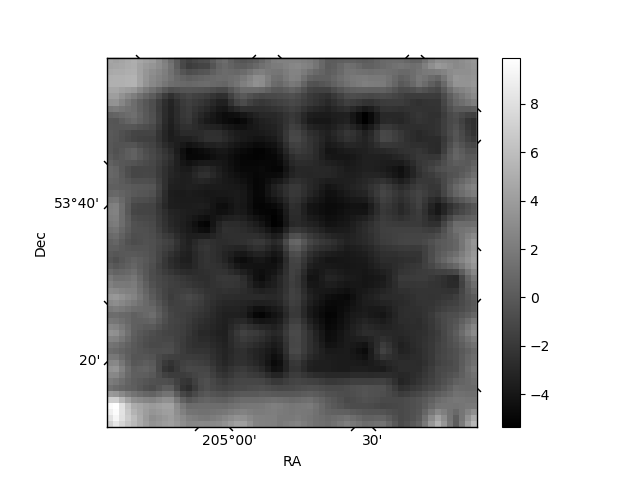
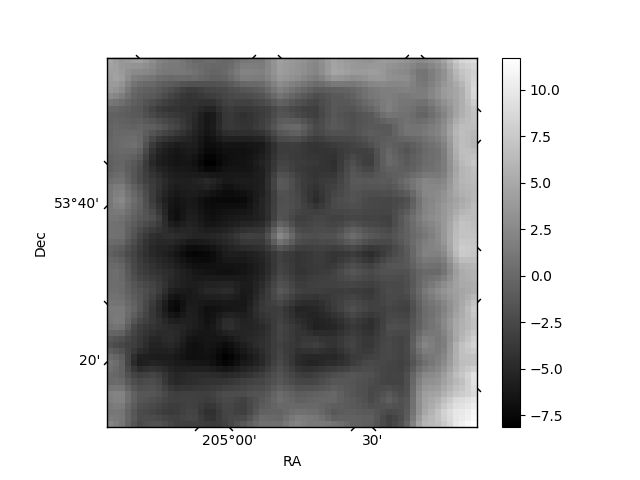
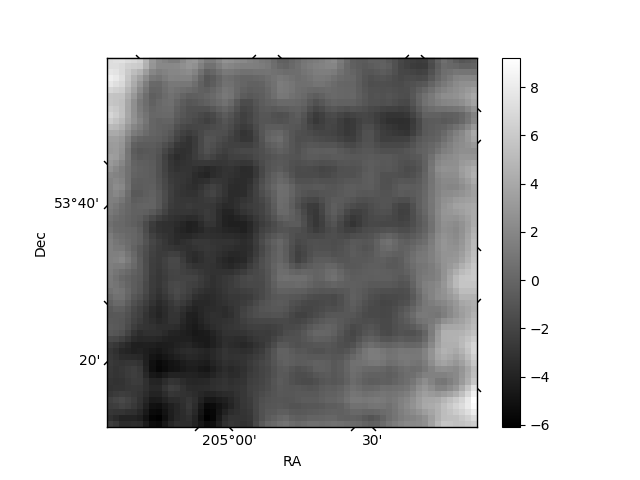
Histogram calculated using DETX and DETY for each event in the final _common_clean file
| Quadrant A | 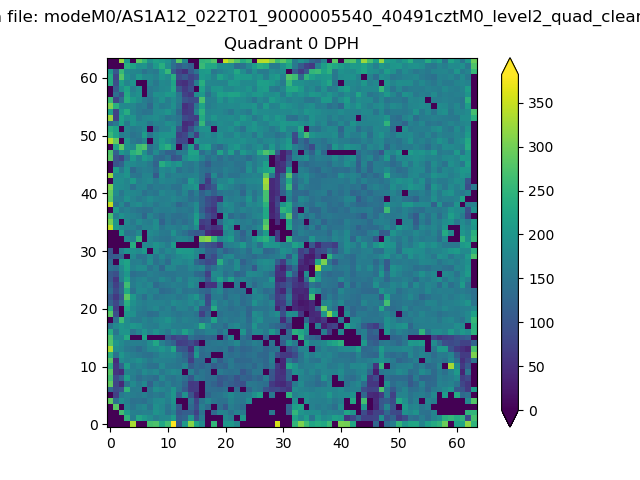 |
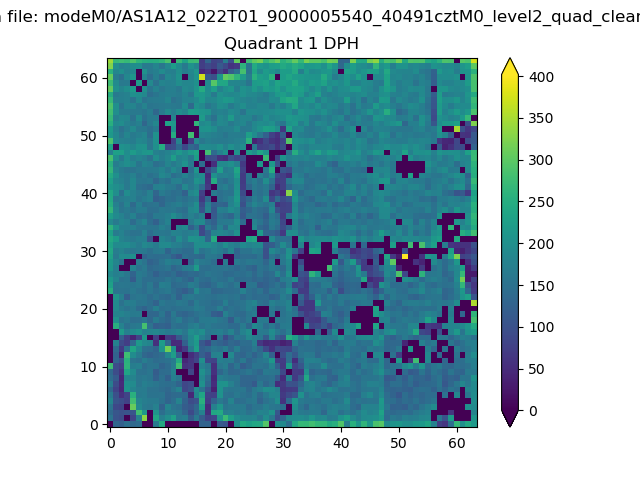 |
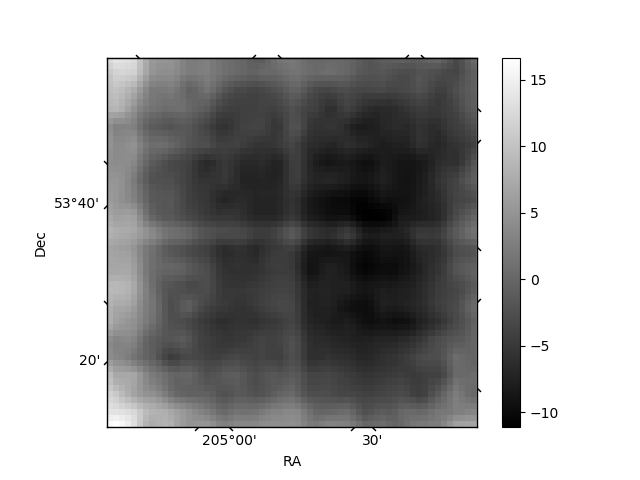
Quadrant B |
|---|---|---|---|
| Quadrant D | 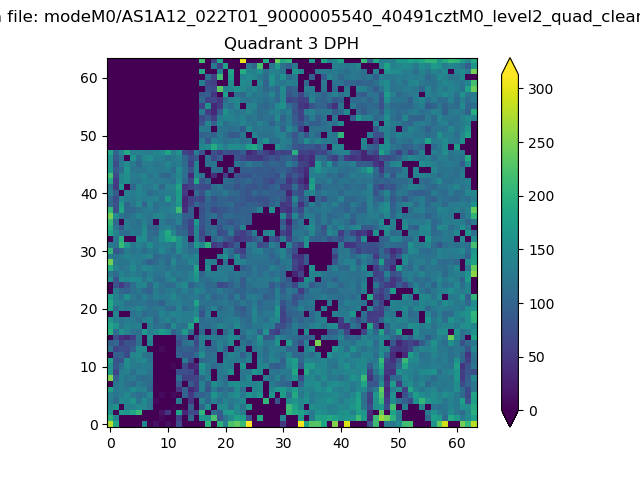 |
 |
Quadrant C |
| Plot type | Count rate plots | Images |
|---|---|---|
| Comparison with Poisson distribution Blue bars denote a histogram of data divided into 1 sec bins. Red curve is a Poisson curve with rate = median count rate of data. |
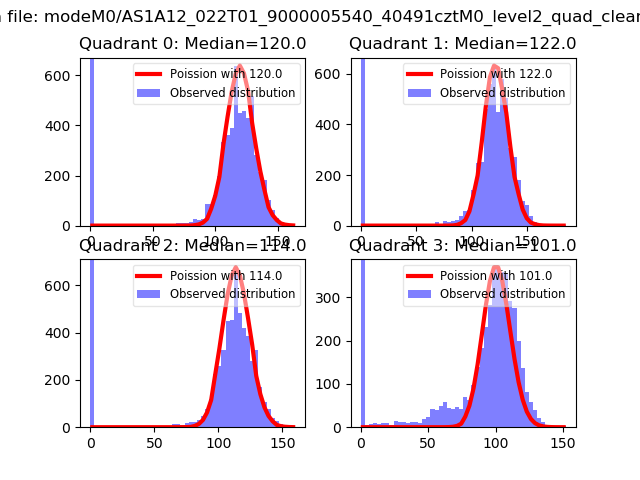 |
 |
| Quadrant-wise count rates Data is divided into 100 sec bins |
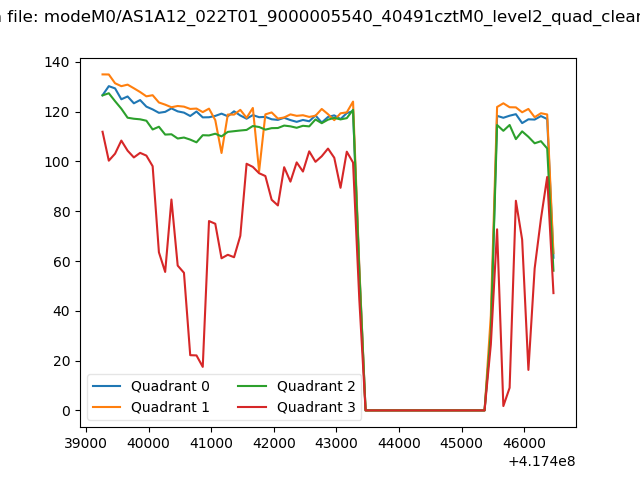 |
|
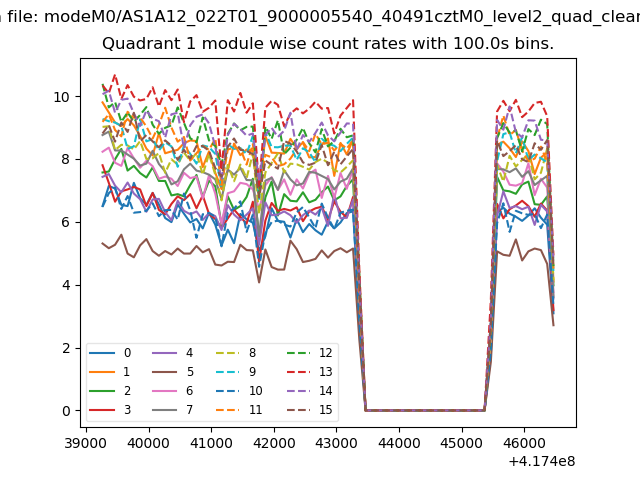
| Module-wise count rates for Quadrant A Data is divided into 100 sec bins |
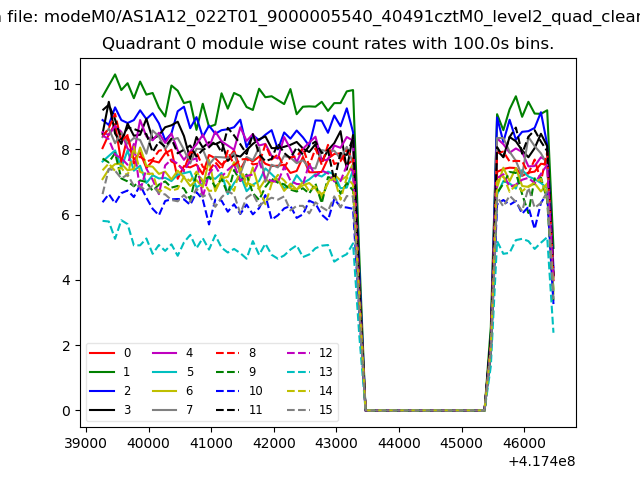 |
 |
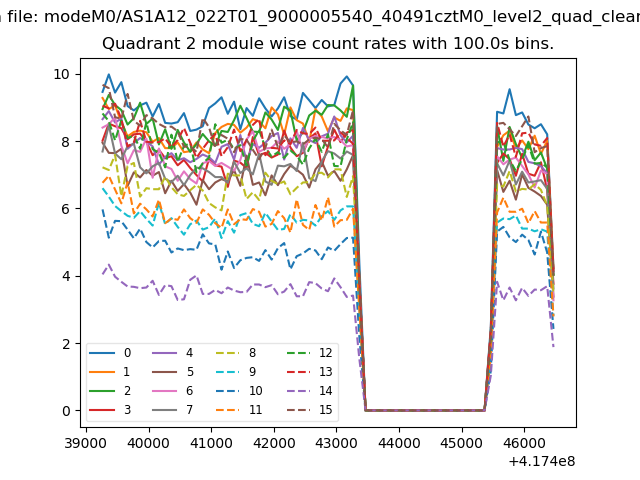
| Module-wise count rates for Quadrant B Data is divided into 100 sec bins |
 |
 |
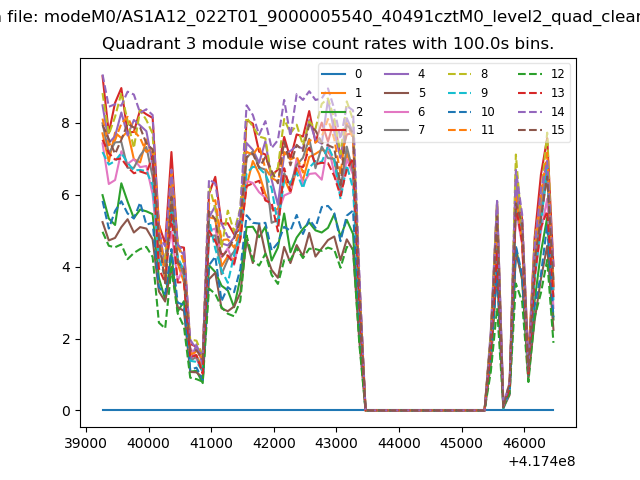
| Module-wise count rates for Quadrant C Data is divided into 100 sec bins |
 |
 |
| Module-wise count rates for Quadrant D Data is divided into 100 sec bins |
 |
 |
| Parameter | Plot |
|---|---|
| CZT HV Monitor | 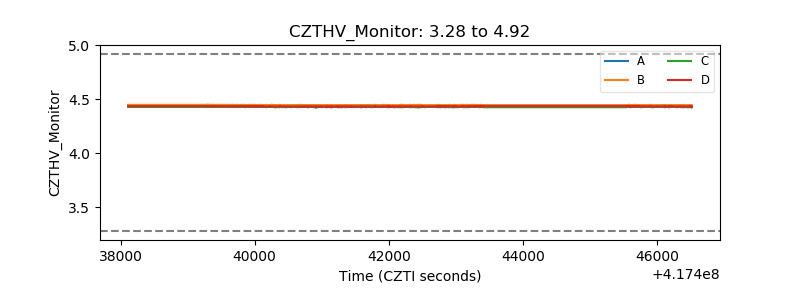 |
| D_VDD | 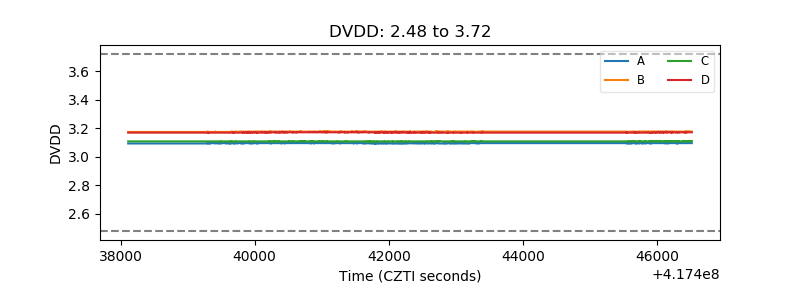 |
| Temperature 1 | 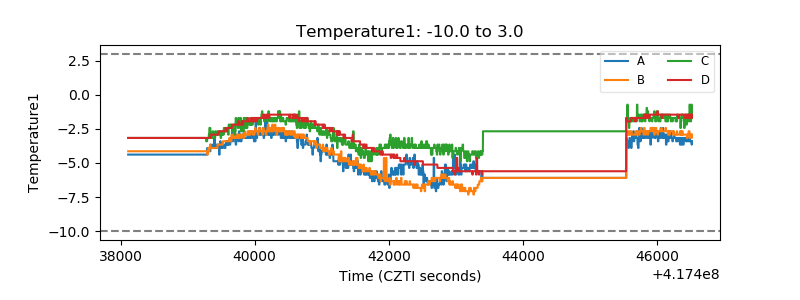 |
| Veto HV Monitor | 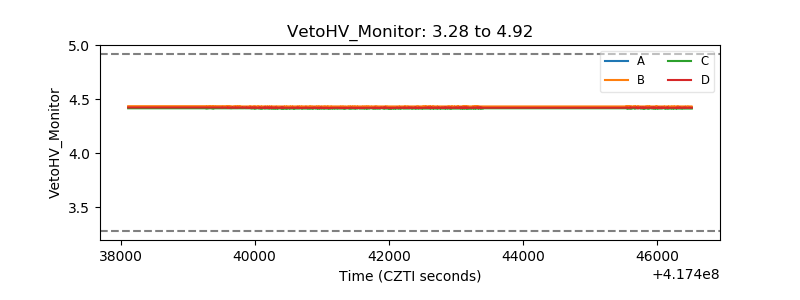 |
| Veto LLD | 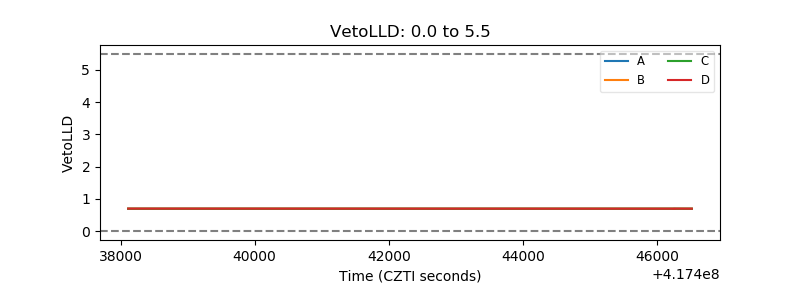 |
| Alpha Counter | 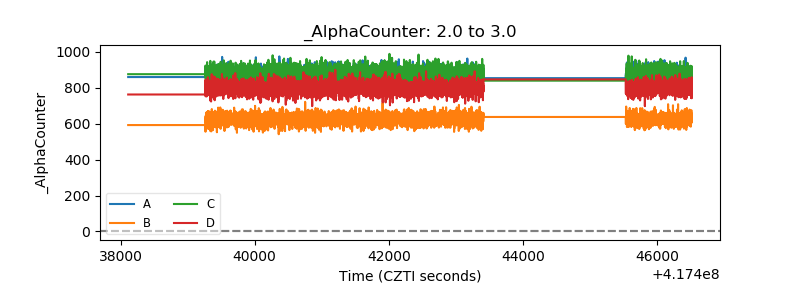 |
| _CPM_Rate | 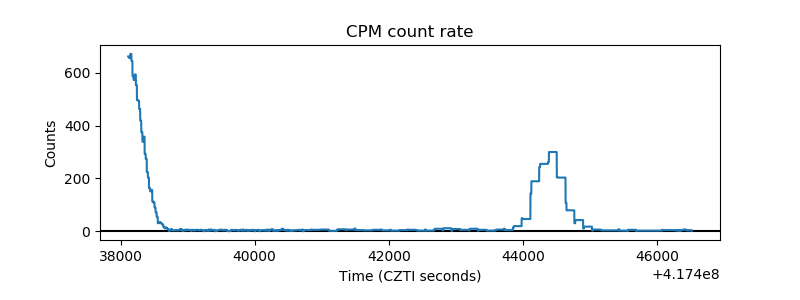 |
| CZT Counter | 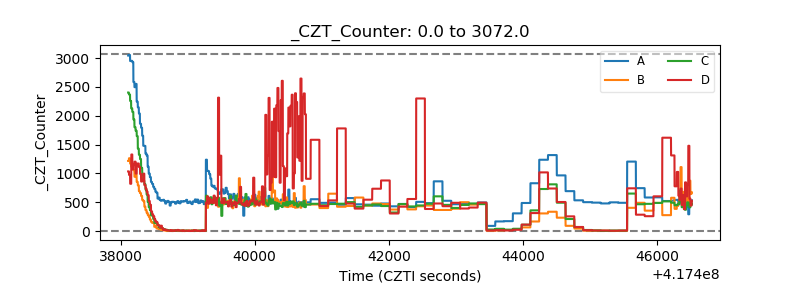 |
| +2.5 Volts monitor | 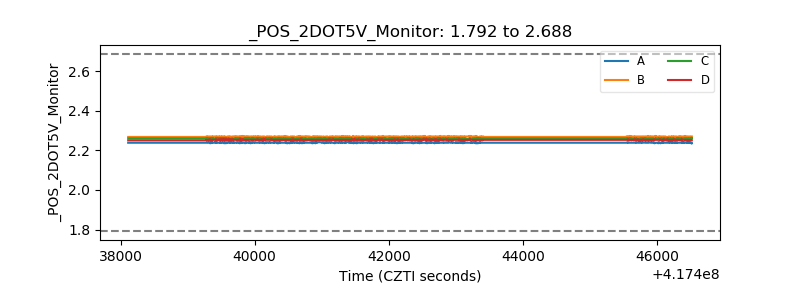 |
| +5 Volts monitor | 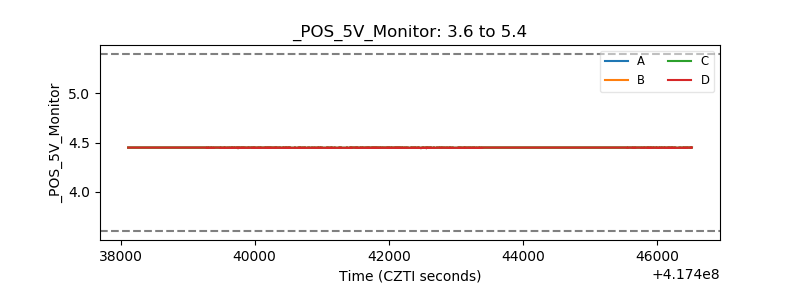 |
| _ROLL_ROT | 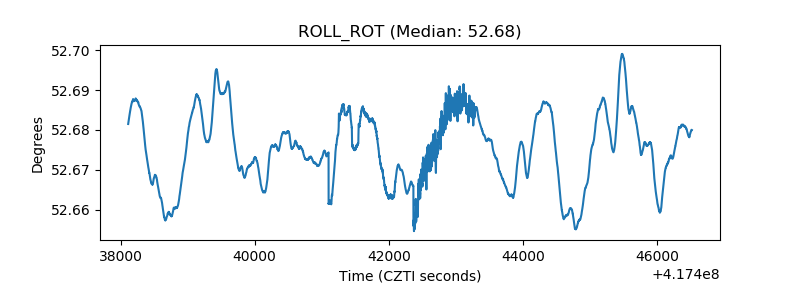 |
| _Roll_DEC | 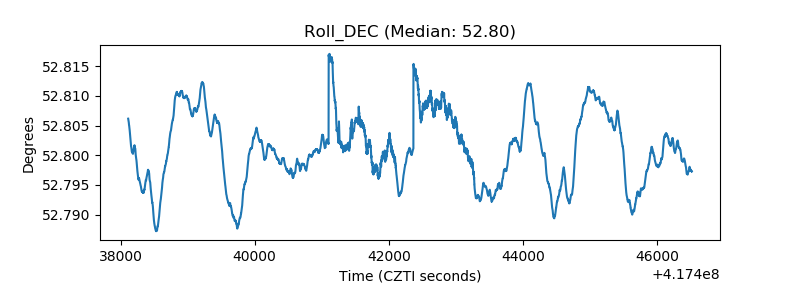 |
| _Roll_RA | 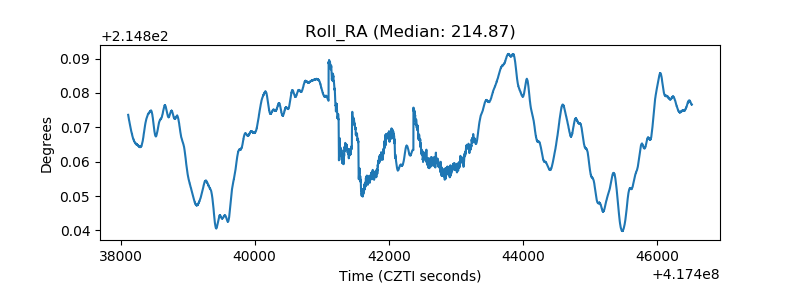 |
| Veto Counter | 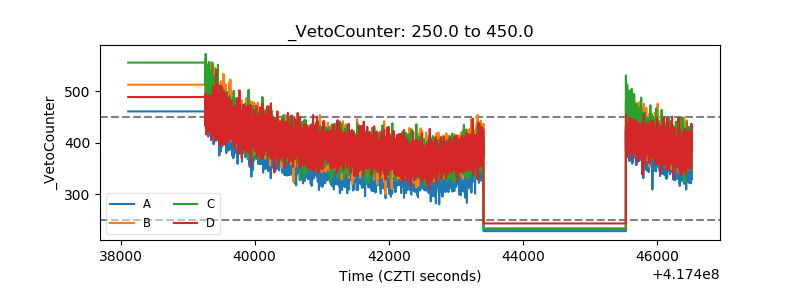 |