| Param | Original file | Final file |
|---|---|---|
| Filename | modeM0/AS1A12_022T01_9000005540_40492cztM0_level2.fits | modeM0/AS1A12_022T01_9000005540_40492cztM0_level2_quad_clean.evt |
| Size (bytes) | 312,261,120 | 84,090,240 |
| Size | 297.8 MB | 80.2 MB |
| Events in quadrant A | 2,704,355 | 594,318 |
| Events in quadrant B | 2,719,938 | 598,813 |
| Events in quadrant C | 2,451,982 | 571,582 |
| Events in quadrant D | 3,276,751 | 417,879 |
| Mode M0 | |||
|---|---|---|---|
| Quadrant | BADHDUFLAG | Total packets | Discarded packets |
| A | 0 | 11296 | 3 |
| B | 0 | 11477 | 2 |
| C | 0 | 10549 | 2 |
| D | 0 | 13422 | 2 |
| Mode M9 | |||
|---|---|---|---|
| Quadrant | BADHDUFLAG | Total packets | Discarded packets |
| A | 0 | 29 | 0 |
| B | 0 | 29 | 0 |
| C | 0 | 29 | 0 |
| D | 0 | 30 | 0 |
| Mode SS | |||
|---|---|---|---|
| Quadrant | BADHDUFLAG | Total packets | Discarded packets |
| A | 0 | 106 | 0 |
| B | 0 | 106 | 0 |
| C | 0 | 106 | 0 |
| D | 0 | 106 | 0 |
| Quadrant | Total seconds | Saturated seconds | Saturation percentage |
|---|---|---|---|
| A | 5190 | 7 | 0.134875% |
| B | 5190 | 57 | 1.098266% |
| C | 5190 | 8 | 0.154143% |
| D | 5190 | 1207 | 23.256262% |
Noise dominated data is calculated using 1-second bins in cleaned event files. If a bin has >2000 counts, and if more than 50% of those come from <1% of pixels, then it is considered to be noise-dominated and hence unusable.
| Quadrant | # 1 sec bins | Bins with >0 counts | Bins with >2000 counts | High rate bins dominated by noise | Noise dominated (total time) | Noise dominated (detector-on time) | Marked lightcurve |
|---|---|---|---|---|---|---|---|
| A | 7163 | 5191 | 1 | 1 | 0.01% | 0.02% | 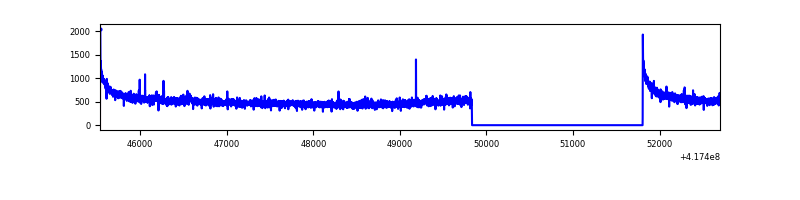 |
| B | 7163 | 5191 | 43 | 43 | 0.60% | 0.83% | 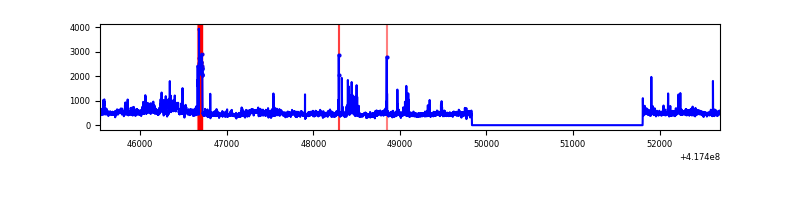 |
| C | 7163 | 5191 | 5 | 5 | 0.07% | 0.10% | 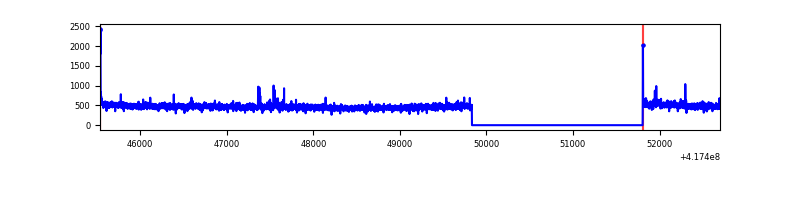 |
| D | 7163 | 5191 | 135 | 135 | 1.88% | 2.60% | 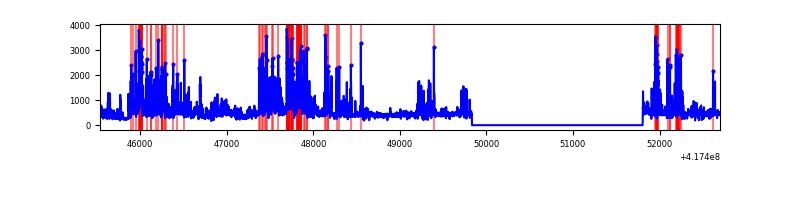 |
Top three noisy pixels from each quadrant. If the there are fewer than three noisy pixels in the level2.evt file, extra rows are filled as -1
| Pixel properties | Quadrant properties | ||||||
|---|---|---|---|---|---|---|---|
| Quadrant | DetID | PixID | Counts | Sigma | Mean | Median | Sigma |
| A | 10 | 83 | 476664 | 4112.47 | 564 | 553 | 115.8 |
| A | 12 | 189 | 21194 | 178.29 | 564 | 553 | 115.8 |
| A | 2 | 79 | 10345 | 84.58 | 564 | 553 | 115.8 |
| B | 4 | 170 | 325999 | 3002.64 | 558 | 544 | 108.4 |
| B | 0 | 230 | 121187 | 1113.05 | 558 | 544 | 108.4 |
| B | 3 | 112 | 44109 | 401.93 | 558 | 544 | 108.4 |
| C | 15 | 214 | 227195 | 1756.89 | 554 | 557 | 129.0 |
| C | 9 | 187 | 23260 | 175.99 | 554 | 557 | 129.0 |
| C | 0 | 10 | 17742 | 133.22 | 554 | 557 | 129.0 |
| D | 2 | 250 | 731846 | 6135.13 | 478 | 464 | 119.2 |
| D | 12 | 191 | 226133 | 1893.0 | 478 | 464 | 119.2 |
| D | 12 | 227 | 187526 | 1569.15 | 478 | 464 | 119.2 |
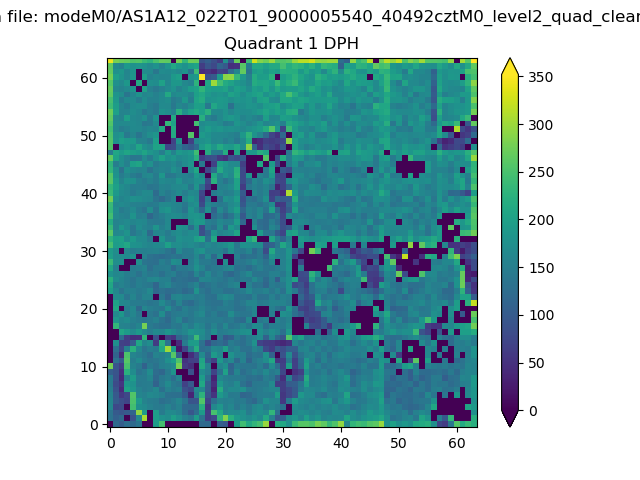
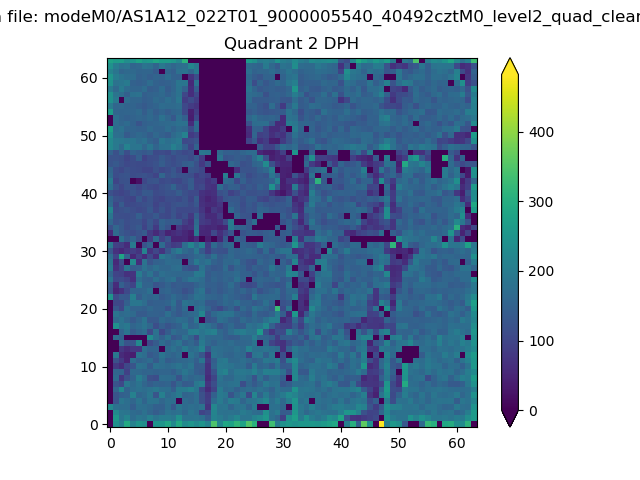
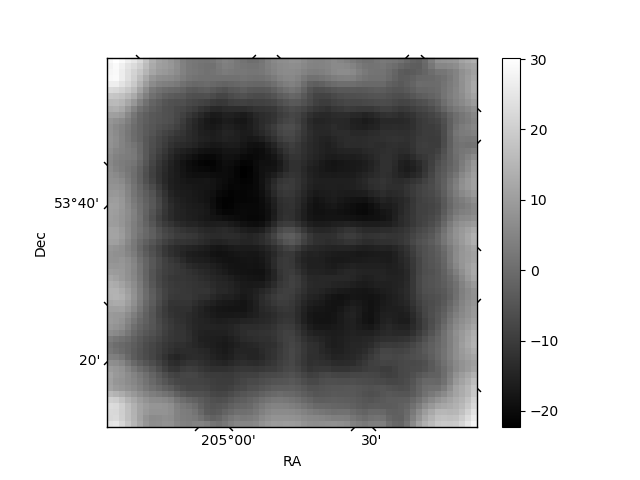
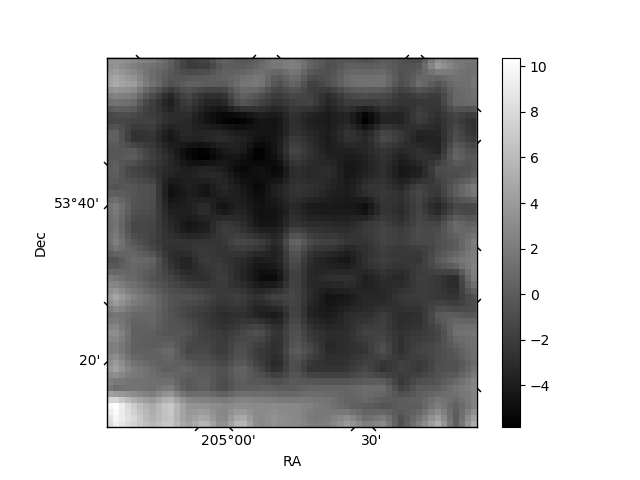
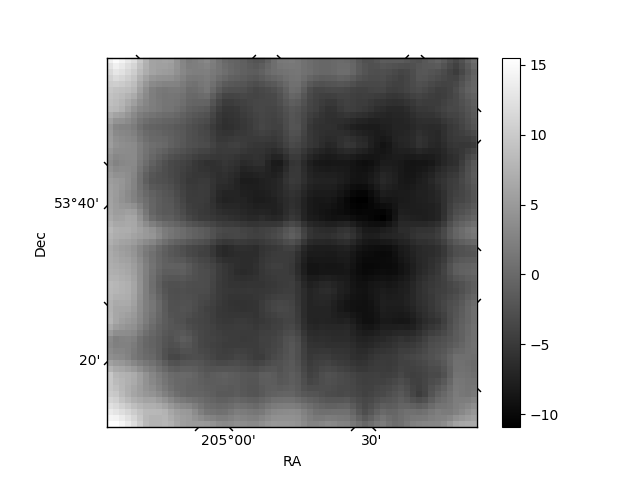
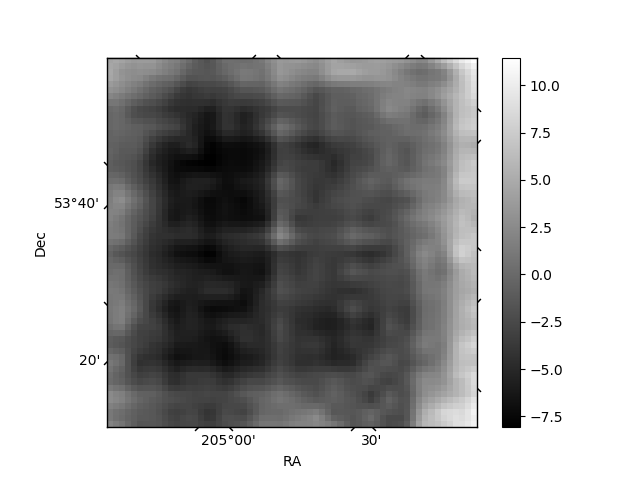
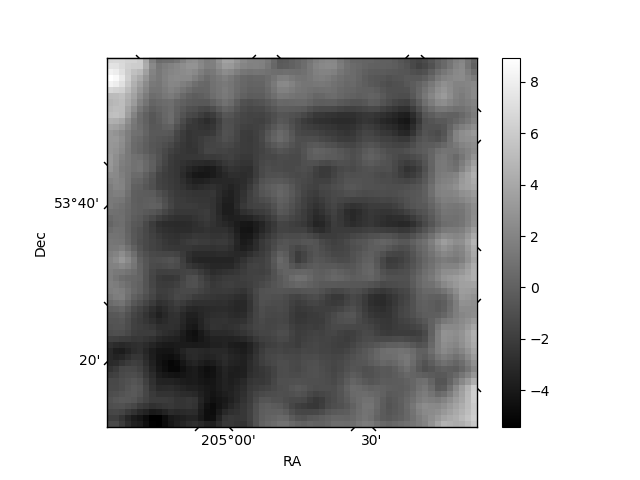
Histogram calculated using DETX and DETY for each event in the final _common_clean file
| Quadrant A |  |
 |
Quadrant B |
|---|---|---|---|
| Quadrant D | 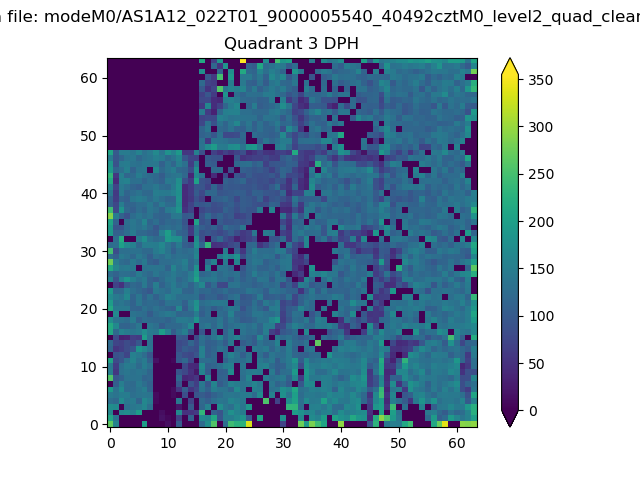 |
 |
Quadrant C |
| Plot type | Count rate plots | Images |
|---|---|---|
| Comparison with Poisson distribution Blue bars denote a histogram of data divided into 1 sec bins. Red curve is a Poisson curve with rate = median count rate of data. |
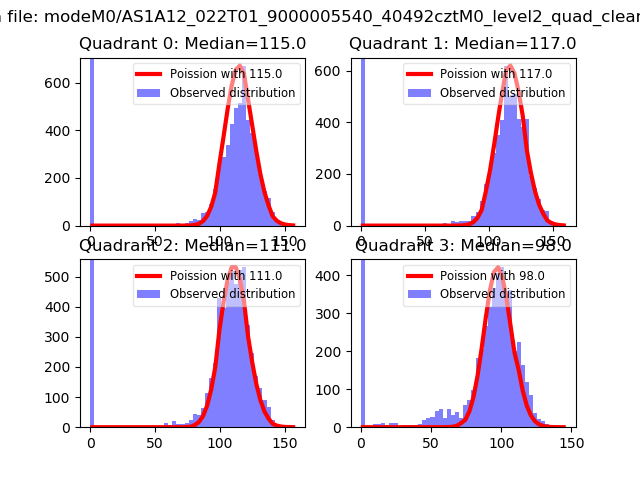 |
 |
| Quadrant-wise count rates Data is divided into 100 sec bins |
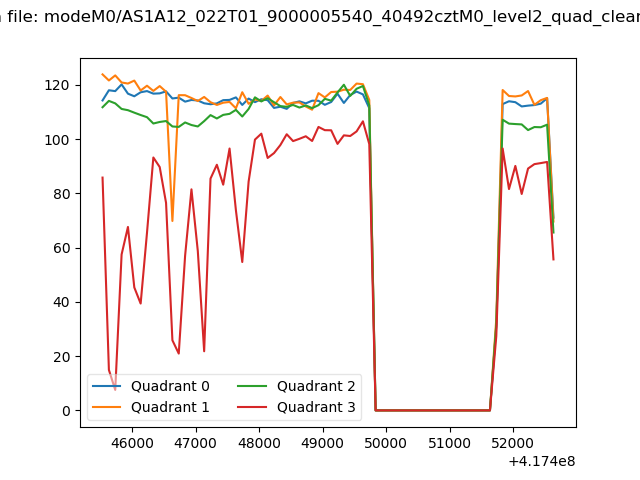 |
|
| Module-wise count rates for Quadrant A Data is divided into 100 sec bins |
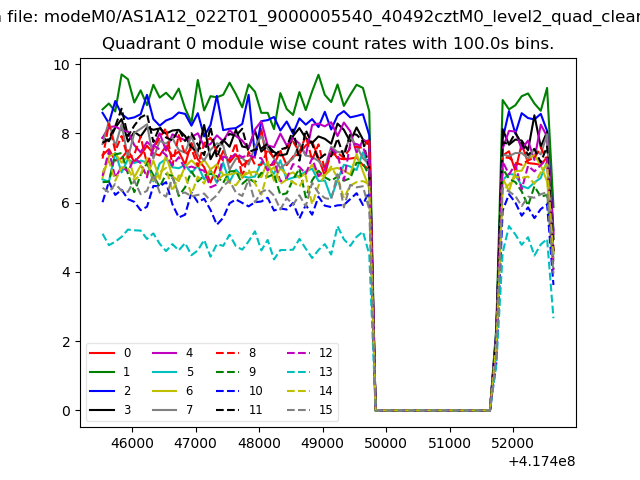 |
 |
| Module-wise count rates for Quadrant B Data is divided into 100 sec bins |
 |
 |
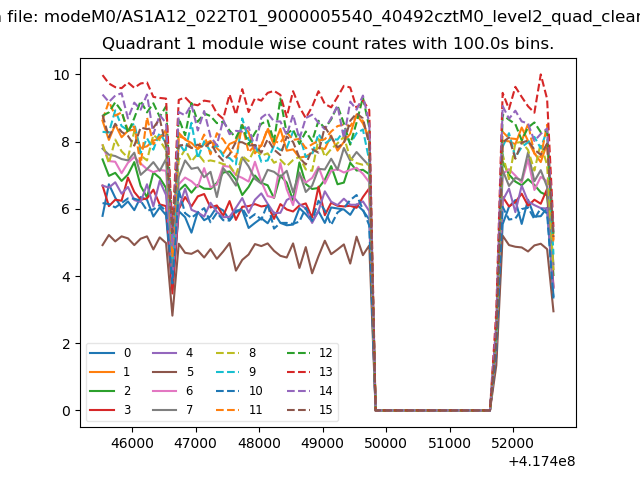
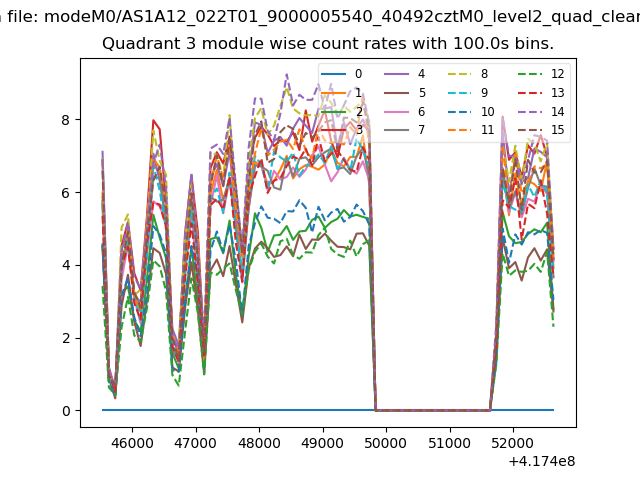
| Module-wise count rates for Quadrant C Data is divided into 100 sec bins |
 |
 |
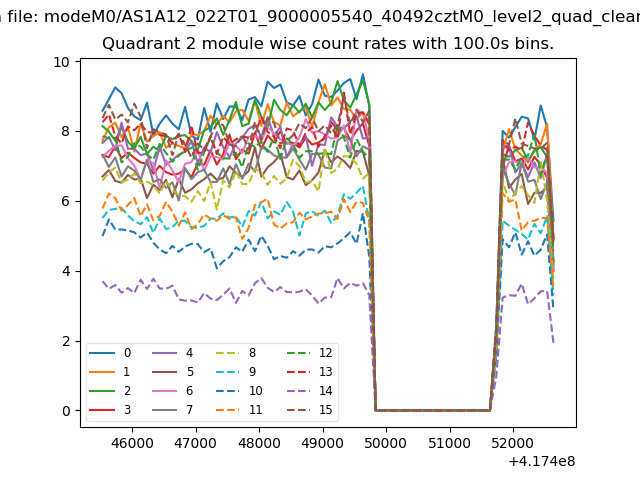
| Module-wise count rates for Quadrant D Data is divided into 100 sec bins |
 |
 |
| Parameter | Plot |
|---|---|
| CZT HV Monitor | 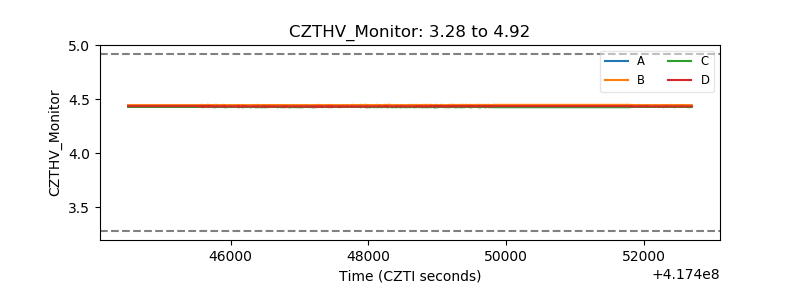 |
| D_VDD |  |
| Temperature 1 | 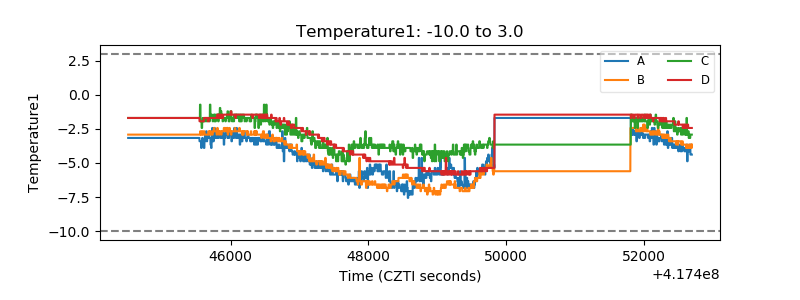 |
| Veto HV Monitor | 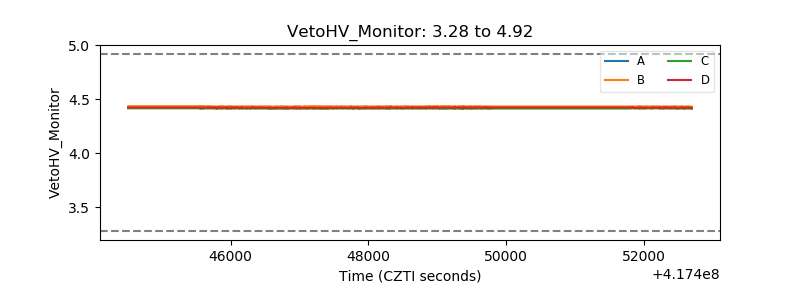 |
| Veto LLD | 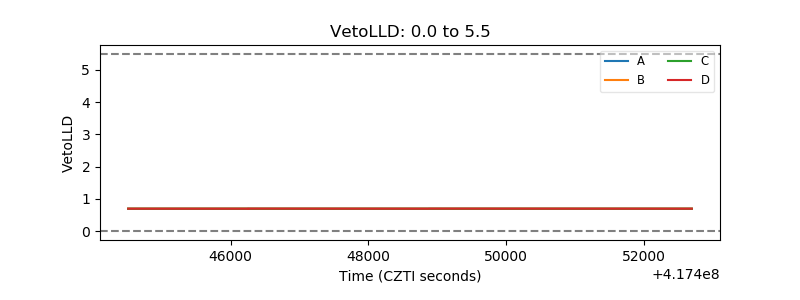 |
| Alpha Counter | 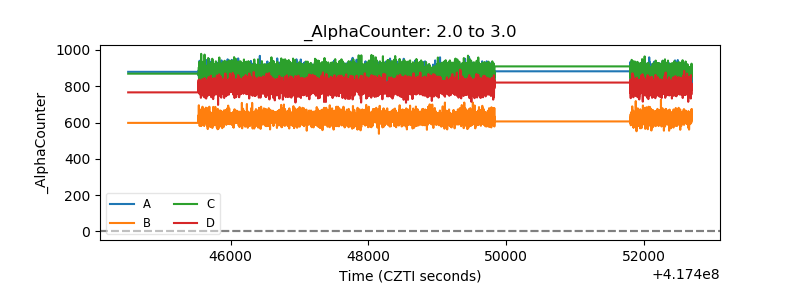 |
| _CPM_Rate | 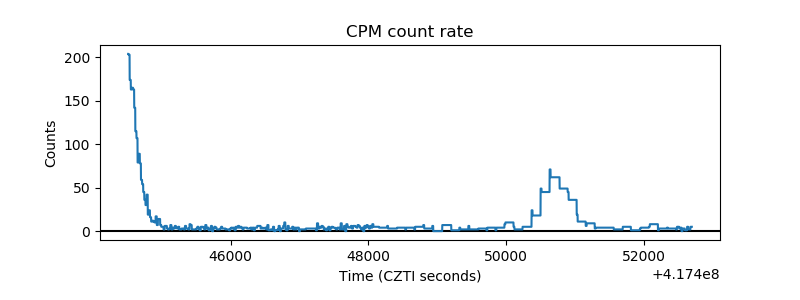 |
| CZT Counter | 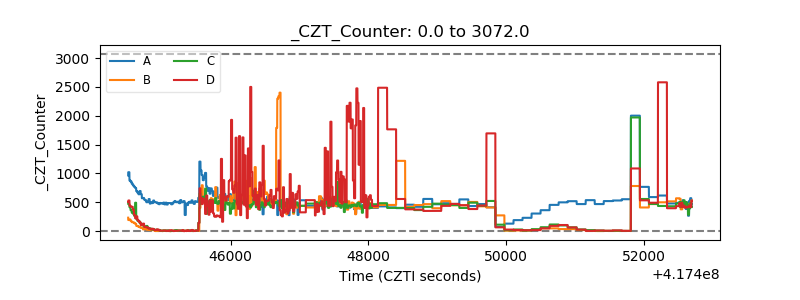 |
| +2.5 Volts monitor | 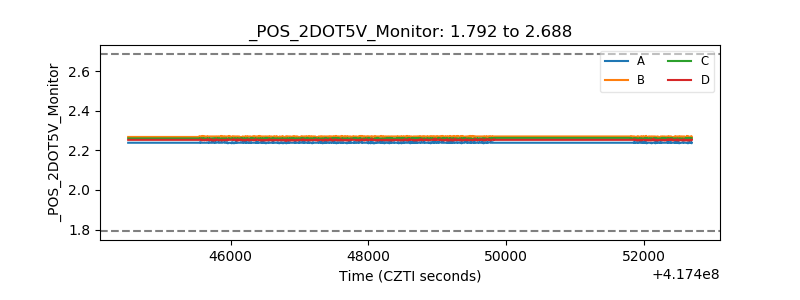 |
| +5 Volts monitor | 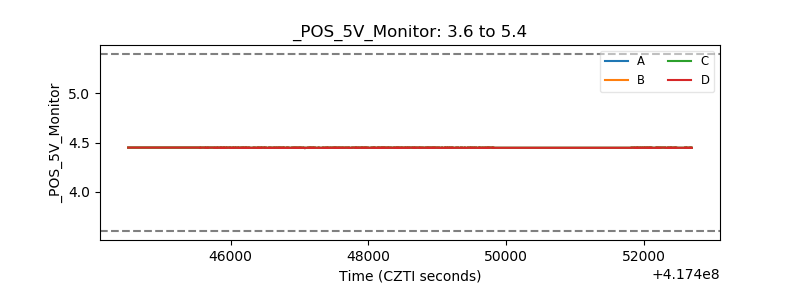 |
| _ROLL_ROT | 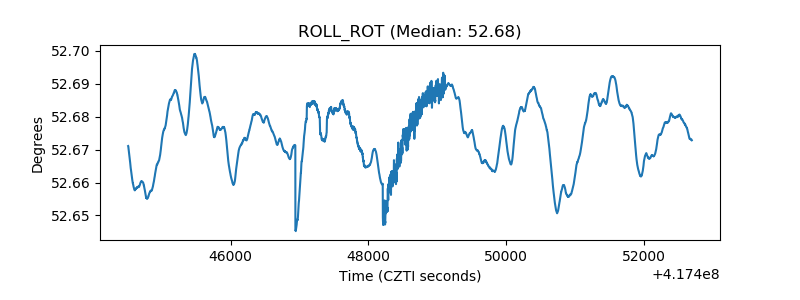 |
| _Roll_DEC | 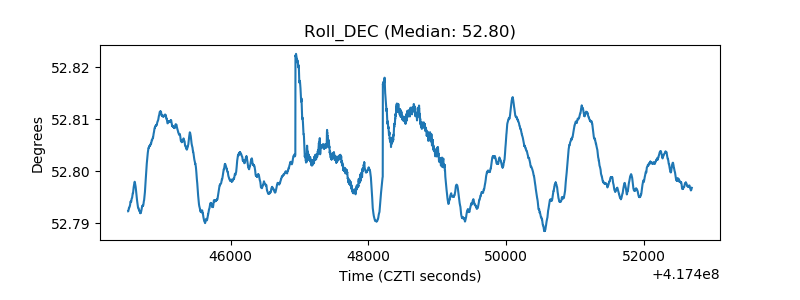 |
| _Roll_RA | 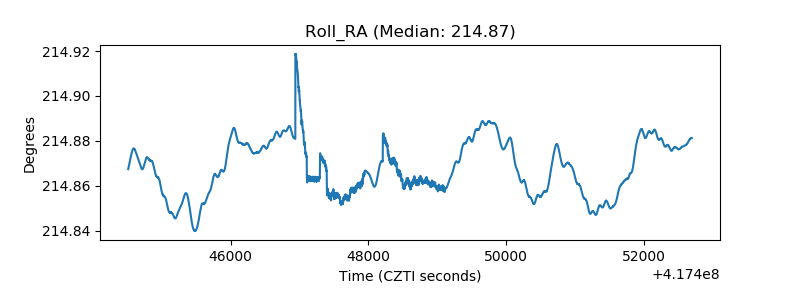 |
| Veto Counter | 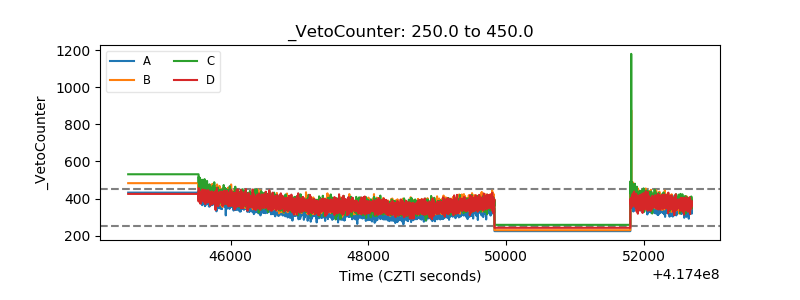 |