| Param | Original file | Final file |
|---|---|---|
| Filename | modeM0/AS1A12_022T01_9000005540_40495cztM0_level2.fits | modeM0/AS1A12_022T01_9000005540_40495cztM0_level2_quad_clean.evt |
| Size (bytes) | 406,543,680 | 95,137,920 |
| Size | 387.7 MB | 90.7 MB |
| Events in quadrant A | 3,089,343 | 648,402 |
| Events in quadrant B | 5,190,474 | 633,913 |
| Events in quadrant C | 2,778,308 | 639,201 |
| Events in quadrant D | 3,524,002 | 540,002 |
| Mode M0 | |||
|---|---|---|---|
| Quadrant | BADHDUFLAG | Total packets | Discarded packets |
| A | 0 | 12995 | 3 |
| B | 0 | 19472 | 2 |
| C | 0 | 12224 | 2 |
| D | 0 | 14740 | 2 |
| Mode M9 | |||
|---|---|---|---|
| Quadrant | BADHDUFLAG | Total packets | Discarded packets |
| A | 0 | 27 | 0 |
| B | 0 | 27 | 0 |
| C | 0 | 27 | 0 |
| D | 0 | 27 | 0 |
| Mode SS | |||
|---|---|---|---|
| Quadrant | BADHDUFLAG | Total packets | Discarded packets |
| A | 0 | 124 | 0 |
| B | 0 | 124 | 0 |
| C | 0 | 124 | 0 |
| D | 0 | 124 | 0 |
| Quadrant | Total seconds | Saturated seconds | Saturation percentage |
|---|---|---|---|
| A | 5998 | 11 | 0.183394% |
| B | 5998 | 380 | 6.335445% |
| C | 5998 | 10 | 0.166722% |
| D | 5998 | 590 | 9.836612% |
Noise dominated data is calculated using 1-second bins in cleaned event files. If a bin has >2000 counts, and if more than 50% of those come from <1% of pixels, then it is considered to be noise-dominated and hence unusable.
| Quadrant | # 1 sec bins | Bins with >0 counts | Bins with >2000 counts | High rate bins dominated by noise | Noise dominated (total time) | Noise dominated (detector-on time) | Marked lightcurve |
|---|---|---|---|---|---|---|---|
| A | 8684 | 6000 | 4 | 4 | 0.05% | 0.07% | 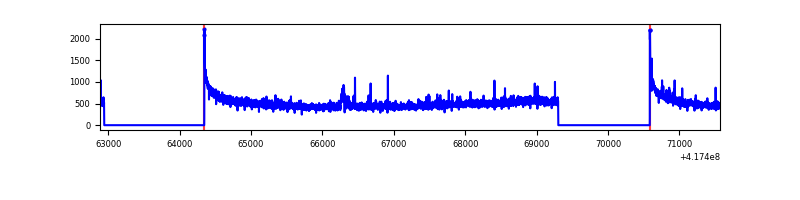 |
| B | 8684 | 6000 | 328 | 328 | 3.78% | 5.47% | 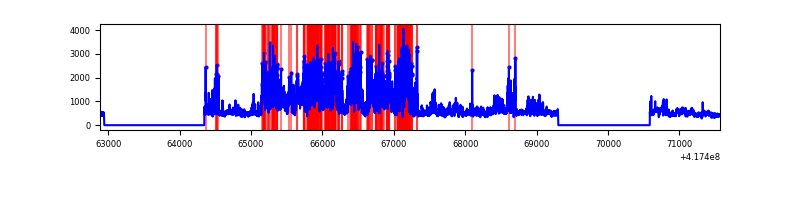 |
| C | 8684 | 6000 | 6 | 6 | 0.07% | 0.10% | 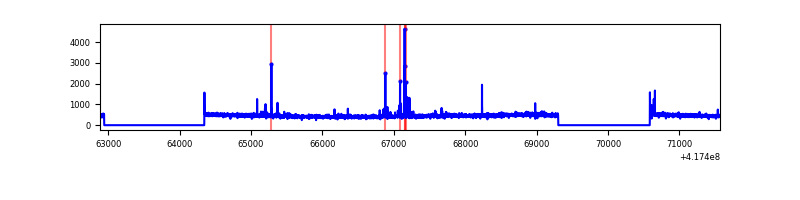 |
| D | 8684 | 6000 | 133 | 133 | 1.53% | 2.22% | 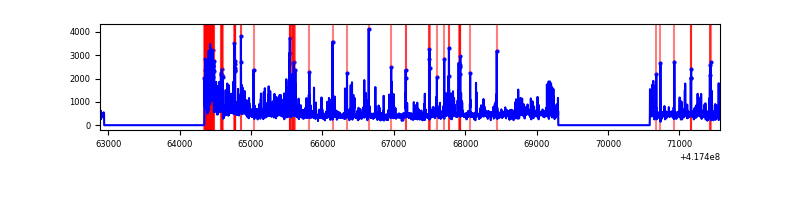 |
Top three noisy pixels from each quadrant. If the there are fewer than three noisy pixels in the level2.evt file, extra rows are filled as -1
| Pixel properties | Quadrant properties | ||||||
|---|---|---|---|---|---|---|---|
| Quadrant | DetID | PixID | Counts | Sigma | Mean | Median | Sigma |
| A | 10 | 83 | 528495 | 4077.92 | 636 | 624 | 129.4 |
| A | 12 | 189 | 56395 | 430.84 | 636 | 624 | 129.4 |
| A | 2 | 79 | 15414 | 114.26 | 636 | 624 | 129.4 |
| B | 4 | 170 | 2581282 | 21371.9 | 621 | 602 | 120.8 |
| B | 0 | 230 | 133639 | 1101.75 | 621 | 602 | 120.8 |
| B | 3 | 112 | 15900 | 126.69 | 621 | 602 | 120.8 |
| C | 15 | 214 | 259062 | 1766.91 | 624 | 628 | 146.3 |
| C | 14 | 254 | 78503 | 532.43 | 624 | 628 | 146.3 |
| C | 0 | 10 | 5541 | 33.59 | 624 | 628 | 146.3 |
| D | 12 | 128 | 431946 | 2918.76 | 594 | 578 | 147.8 |
| D | 2 | 250 | 350716 | 2369.13 | 594 | 578 | 147.8 |
| D | 12 | 191 | 159424 | 1074.8 | 594 | 578 | 147.8 |
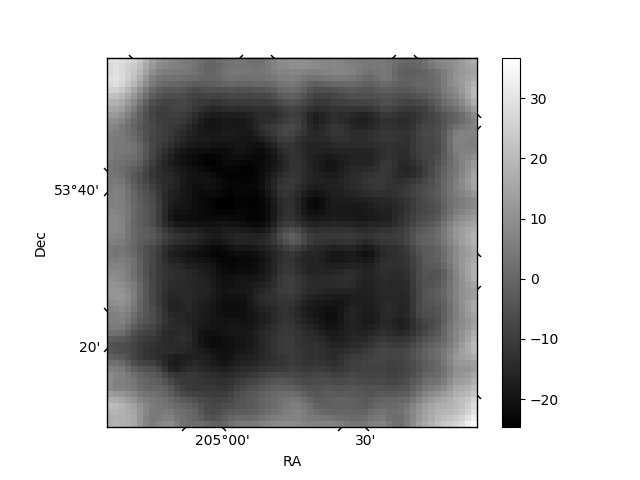
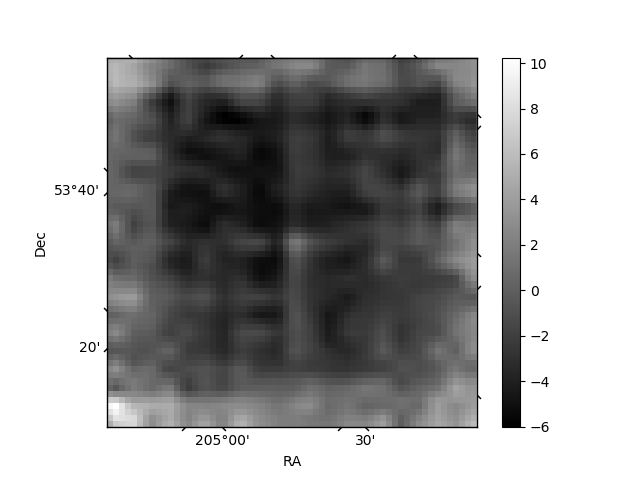
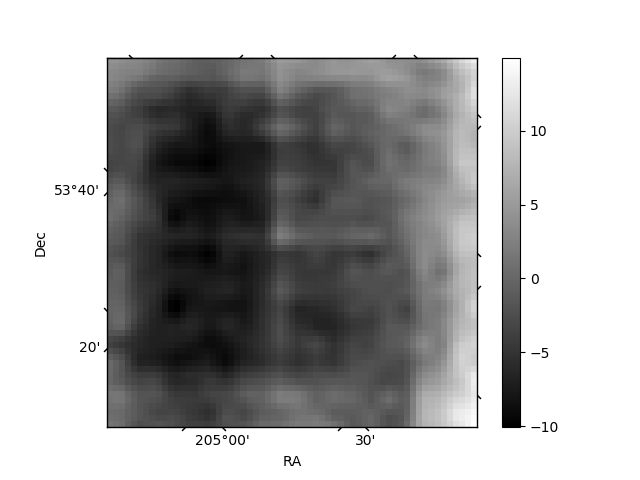
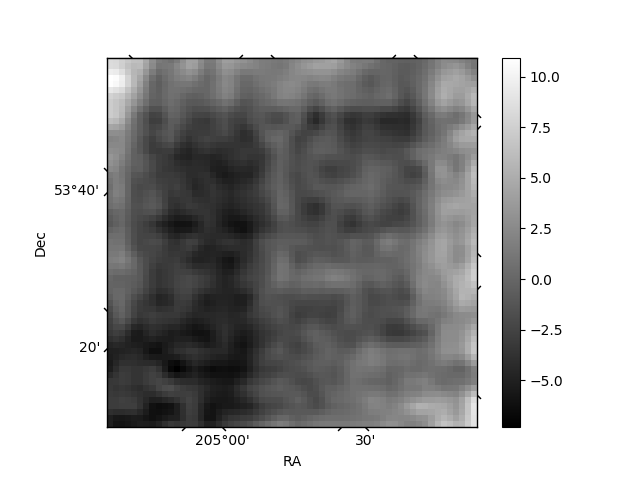
Histogram calculated using DETX and DETY for each event in the final _common_clean file
| Quadrant A | 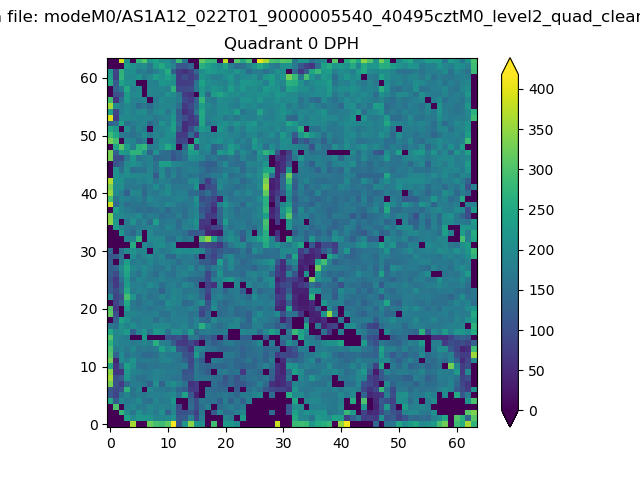 |
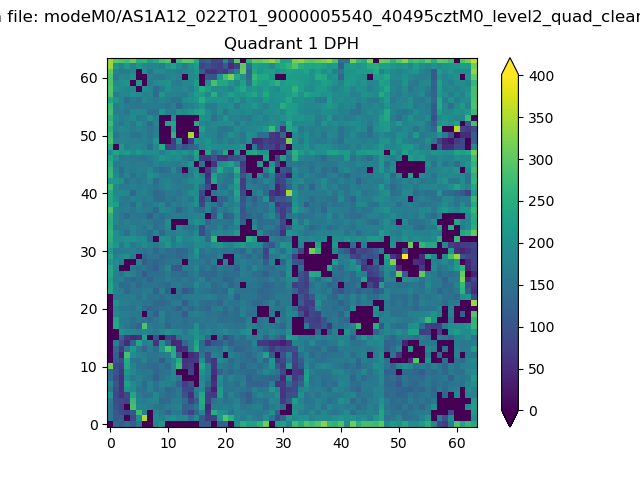 |
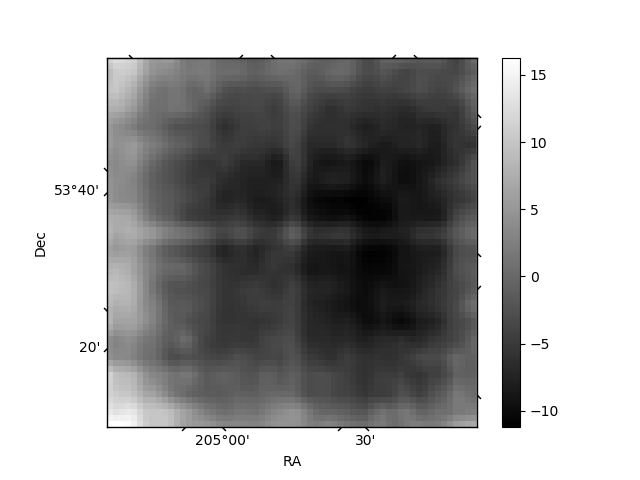
Quadrant B |
|---|---|---|---|
| Quadrant D | 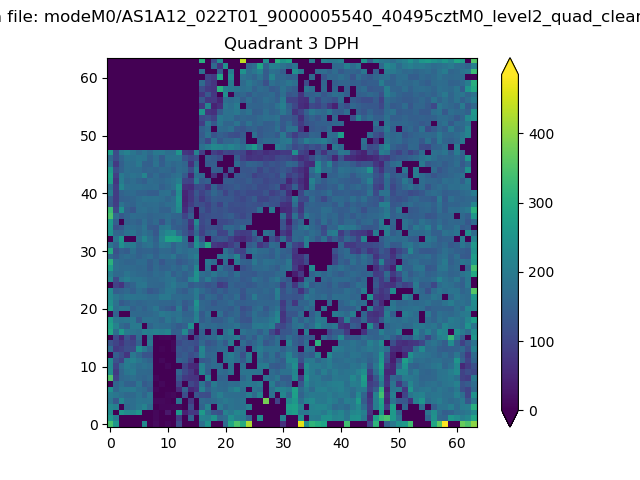 |
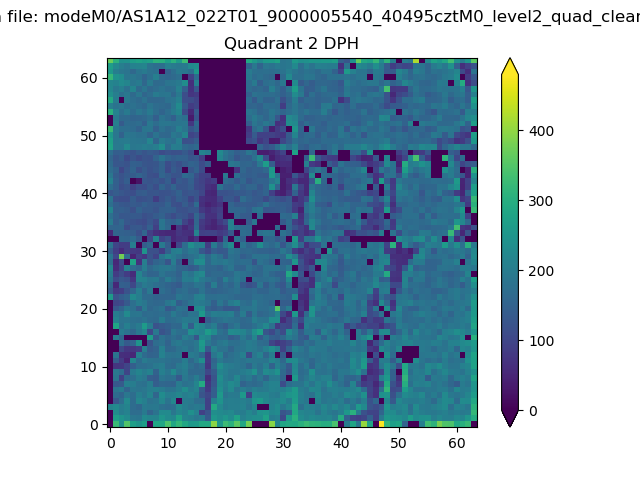 |
Quadrant C |
| Plot type | Count rate plots | Images |
|---|---|---|
| Comparison with Poisson distribution Blue bars denote a histogram of data divided into 1 sec bins. Red curve is a Poisson curve with rate = median count rate of data. |
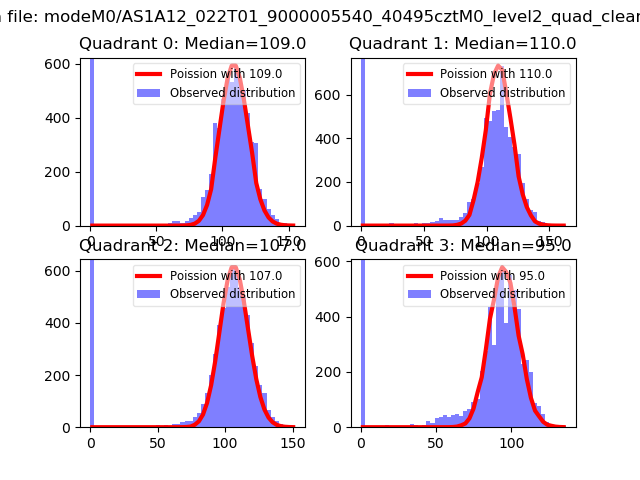 |
 |
| Quadrant-wise count rates Data is divided into 100 sec bins |
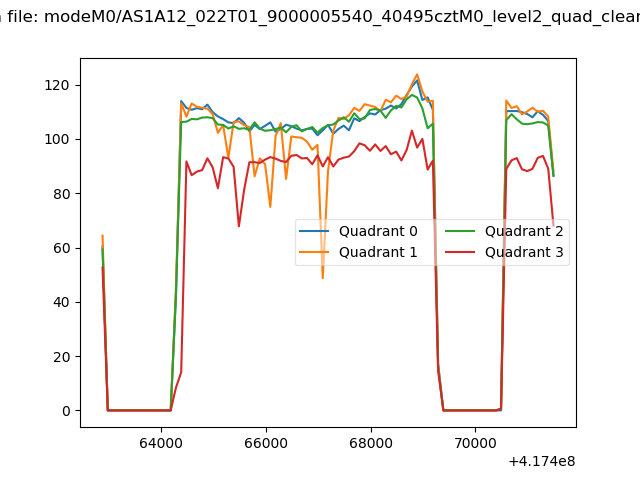 |
|
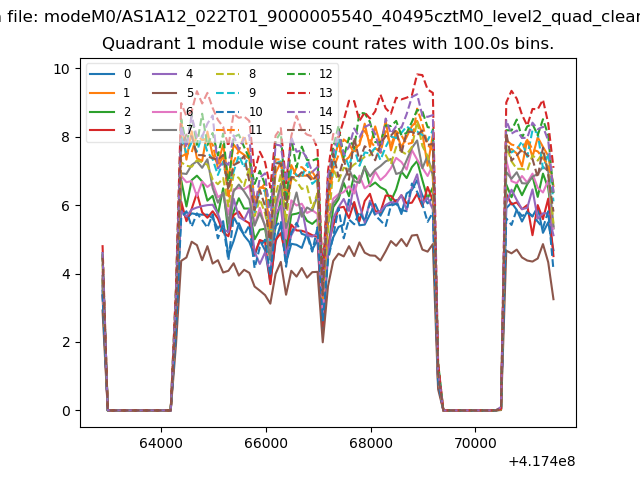
| Module-wise count rates for Quadrant A Data is divided into 100 sec bins |
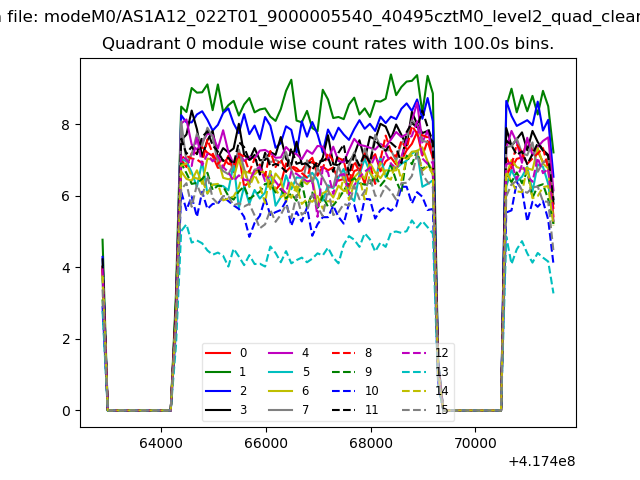 |
 |
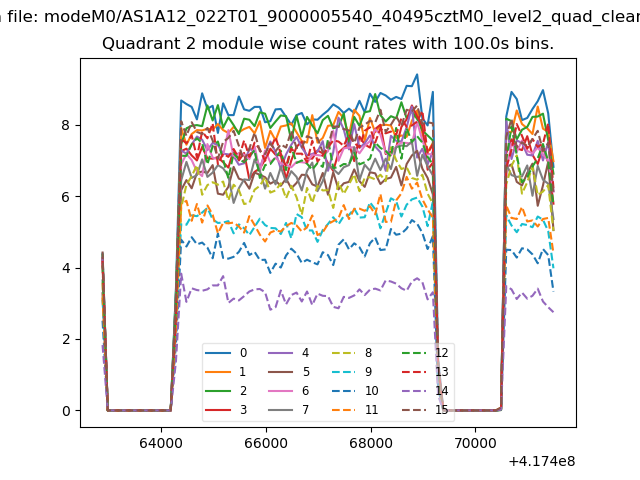
| Module-wise count rates for Quadrant B Data is divided into 100 sec bins |
 |
 |
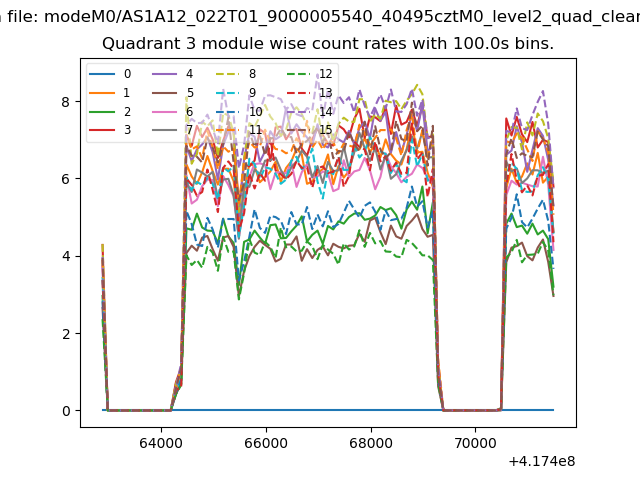
| Module-wise count rates for Quadrant C Data is divided into 100 sec bins |
 |
 |
| Module-wise count rates for Quadrant D Data is divided into 100 sec bins |
 |
 |
| Parameter | Plot |
|---|---|
| CZT HV Monitor | 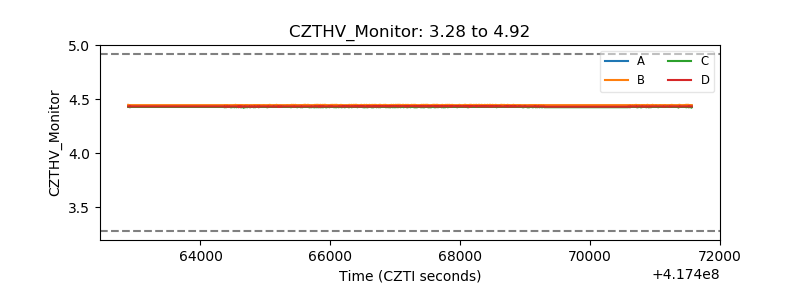 |
| D_VDD | 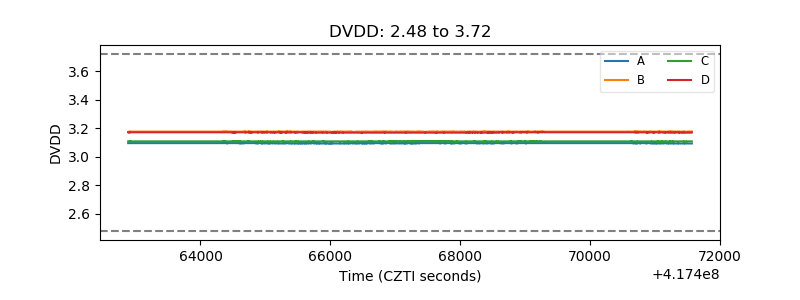 |
| Temperature 1 | 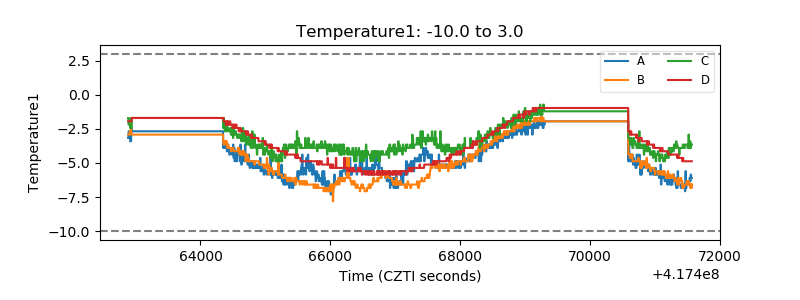 |
| Veto HV Monitor | 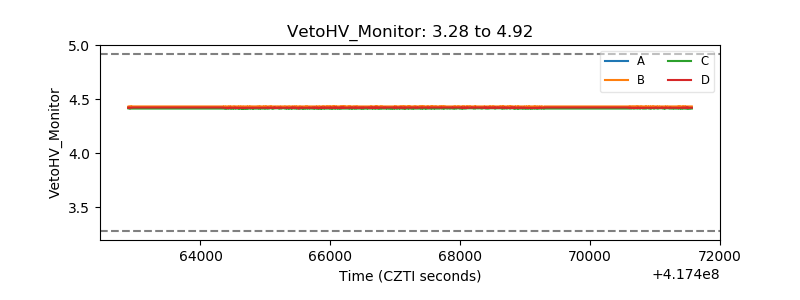 |
| Veto LLD | 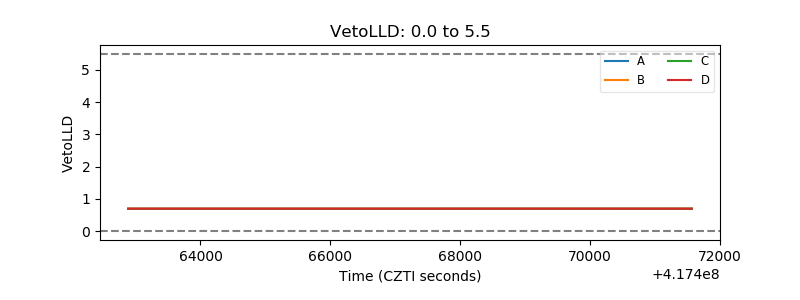 |
| Alpha Counter | 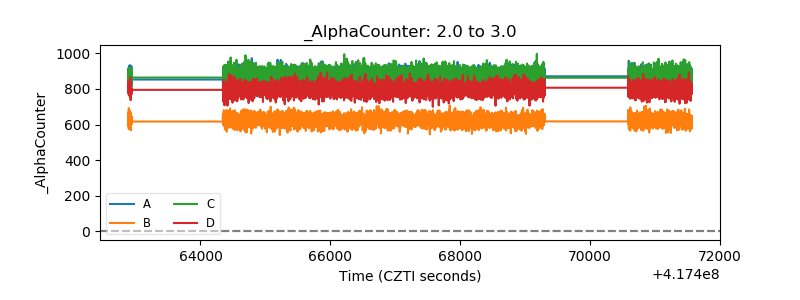 |
| _CPM_Rate | 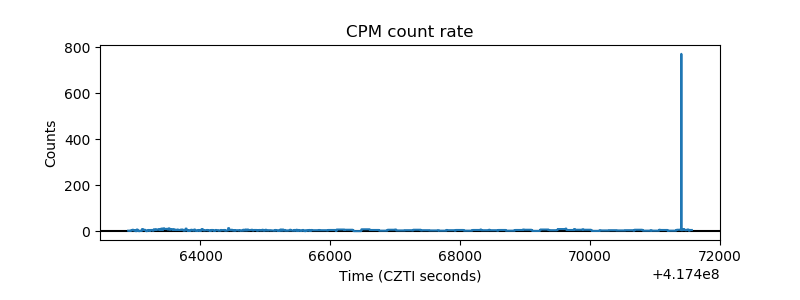 |
| CZT Counter | 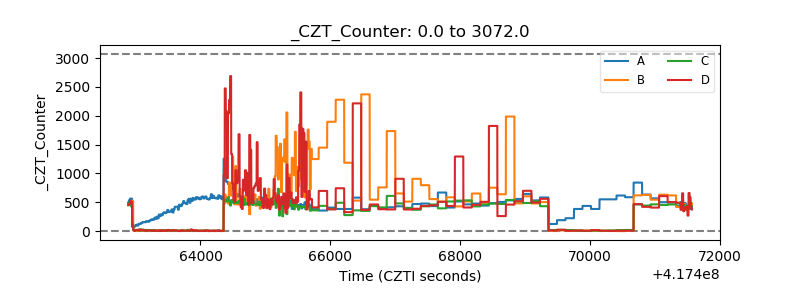 |
| +2.5 Volts monitor | 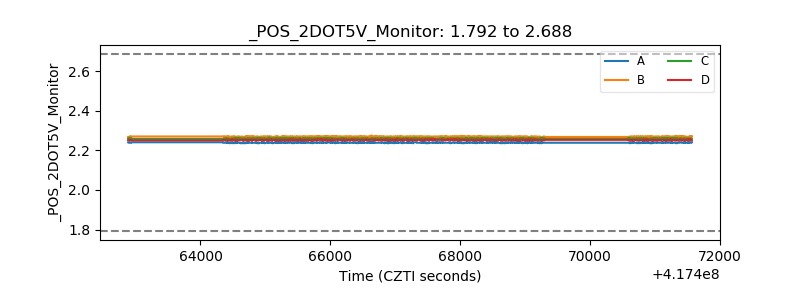 |
| +5 Volts monitor | 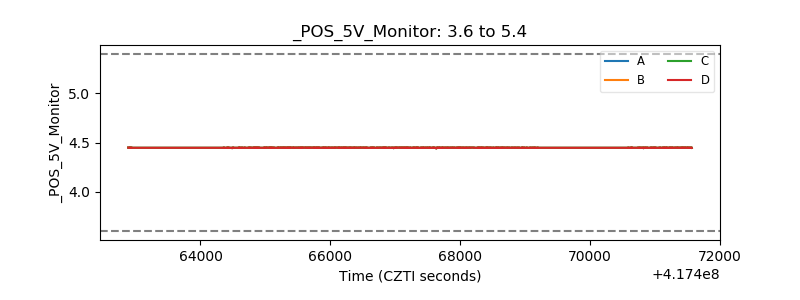 |
| _ROLL_ROT | 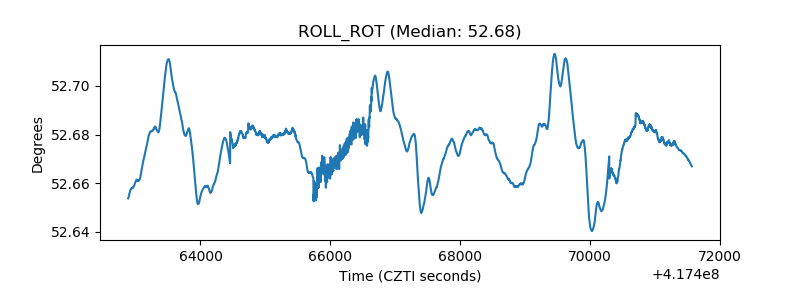 |
| _Roll_DEC | 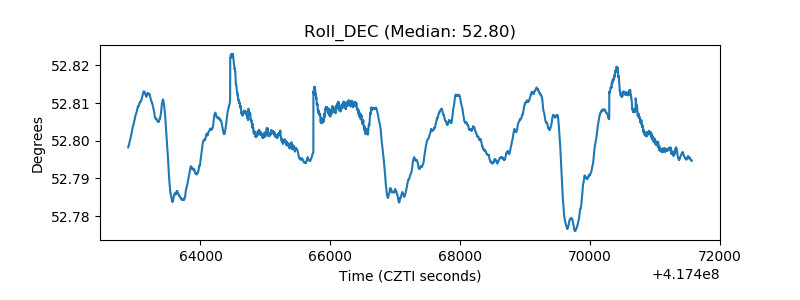 |
| _Roll_RA | 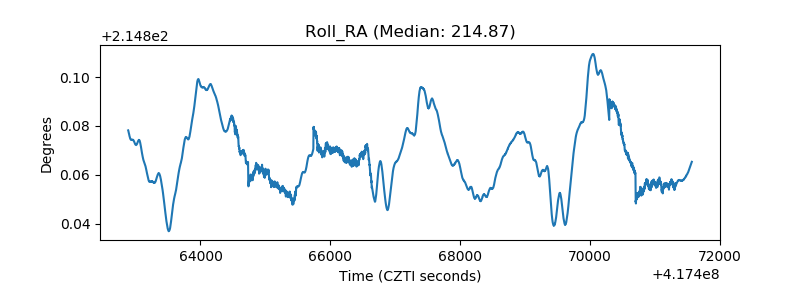 |
| Veto Counter | 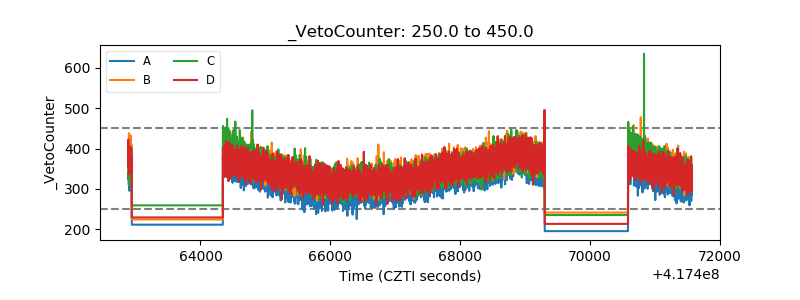 |