| Param | Original file | Final file |
|---|---|---|
| Filename | modeM0/AS1A12_022T01_9000005540_40498cztM0_level2.fits | modeM0/AS1A12_022T01_9000005540_40498cztM0_level2_quad_clean.evt |
| Size (bytes) | 919,857,600 | 244,419,840 |
| Size | 877.2 MB | 233.1 MB |
| Events in quadrant A | 7,821,776 | 1,651,446 |
| Events in quadrant B | 7,281,785 | 1,685,943 |
| Events in quadrant C | 8,845,625 | 1,636,879 |
| Events in quadrant D | 8,889,851 | 1,348,533 |
| Mode M0 | |||
|---|---|---|---|
| Quadrant | BADHDUFLAG | Total packets | Discarded packets |
| A | 0 | 33423 | 5 |
| B | 0 | 33281 | 4 |
| C | 0 | 36863 | 4 |
| D | 0 | 37953 | 4 |
| Mode M9 | |||
|---|---|---|---|
| Quadrant | BADHDUFLAG | Total packets | Discarded packets |
| A | 0 | 53 | 0 |
| B | 0 | 53 | 0 |
| C | 0 | 53 | 0 |
| D | 0 | 54 | 0 |
| Mode SS | |||
|---|---|---|---|
| Quadrant | BADHDUFLAG | Total packets | Discarded packets |
| A | 0 | 320 | 0 |
| B | 0 | 320 | 0 |
| C | 0 | 320 | 0 |
| D | 0 | 320 | 0 |
| Quadrant | Total seconds | Saturated seconds | Saturation percentage |
|---|---|---|---|
| A | 15608 | 26 | 0.166581% |
| B | 15608 | 50 | 0.320349% |
| C | 15608 | 39 | 0.249872% |
| D | 15608 | 1783 | 11.423629% |
Noise dominated data is calculated using 1-second bins in cleaned event files. If a bin has >2000 counts, and if more than 50% of those come from <1% of pixels, then it is considered to be noise-dominated and hence unusable.
| Quadrant | # 1 sec bins | Bins with >0 counts | Bins with >2000 counts | High rate bins dominated by noise | Noise dominated (total time) | Noise dominated (detector-on time) | Marked lightcurve |
|---|---|---|---|---|---|---|---|
| A | 19848 | 15611 | 6 | 6 | 0.03% | 0.04% | 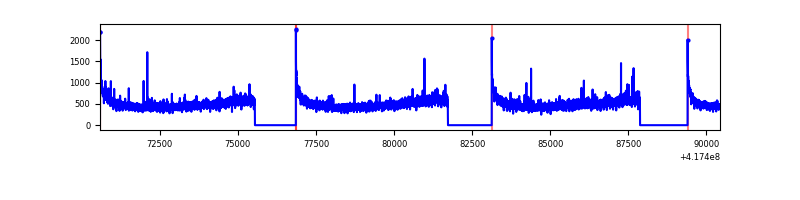 |
| B | 19848 | 15611 | 23 | 23 | 0.12% | 0.15% | 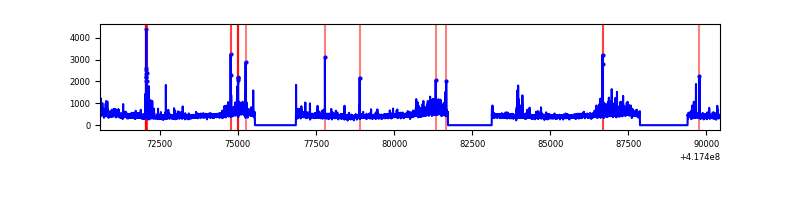 |
| C | 19848 | 15611 | 15 | 15 | 0.08% | 0.10% | 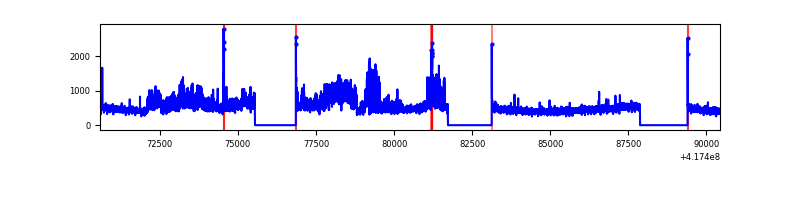 |
| D | 19848 | 15610 | 486 | 486 | 2.45% | 3.11% | 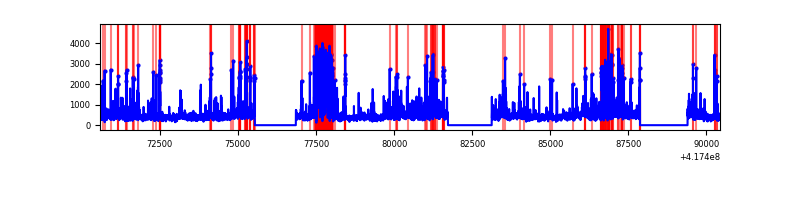 |
Top three noisy pixels from each quadrant. If the there are fewer than three noisy pixels in the level2.evt file, extra rows are filled as -1
| Pixel properties | Quadrant properties | ||||||
|---|---|---|---|---|---|---|---|
| Quadrant | DetID | PixID | Counts | Sigma | Mean | Median | Sigma |
| A | 10 | 83 | 1233309 | 3683.25 | 1648 | 1614 | 334.4 |
| A | 12 | 189 | 97303 | 286.15 | 1648 | 1614 | 334.4 |
| A | 2 | 79 | 60516 | 176.14 | 1648 | 1614 | 334.4 |
| B | 4 | 170 | 435726 | 1389.27 | 1636 | 1591 | 312.5 |
| B | 0 | 230 | 151501 | 479.72 | 1636 | 1591 | 312.5 |
| B | 4 | 171 | 116558 | 367.9 | 1636 | 1591 | 312.5 |
| C | 9 | 146 | 1807694 | 4868.03 | 1609 | 1618 | 371.0 |
| C | 15 | 214 | 672153 | 1807.33 | 1609 | 1618 | 371.0 |
| C | 14 | 254 | 48143 | 125.4 | 1609 | 1618 | 371.0 |
| D | 12 | 227 | 1283800 | 3464.23 | 1514 | 1471 | 370.2 |
| D | 2 | 250 | 608740 | 1640.55 | 1514 | 1471 | 370.2 |
| D | 12 | 191 | 423361 | 1139.74 | 1514 | 1471 | 370.2 |
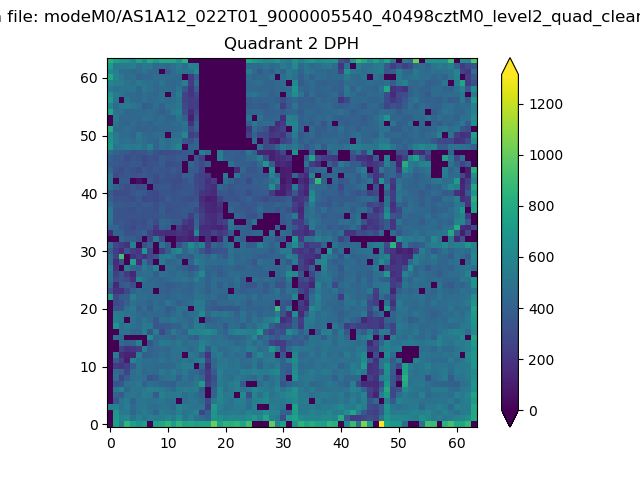
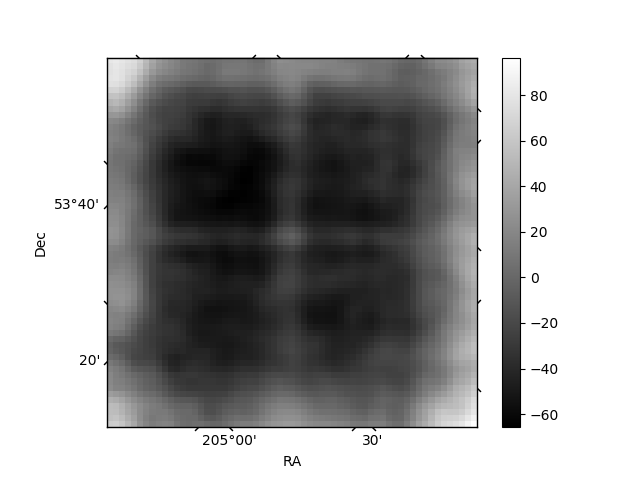
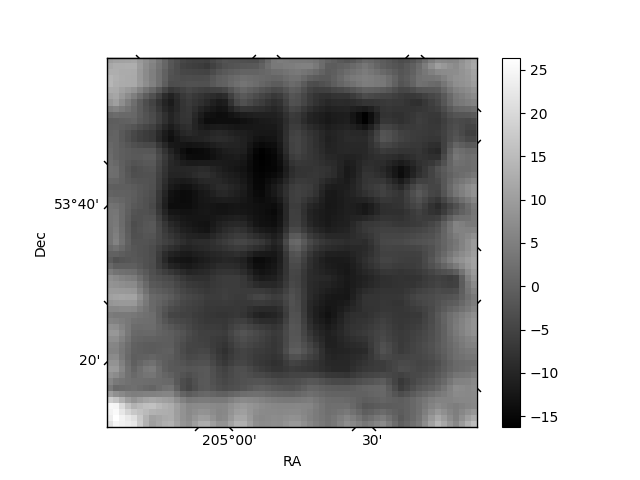
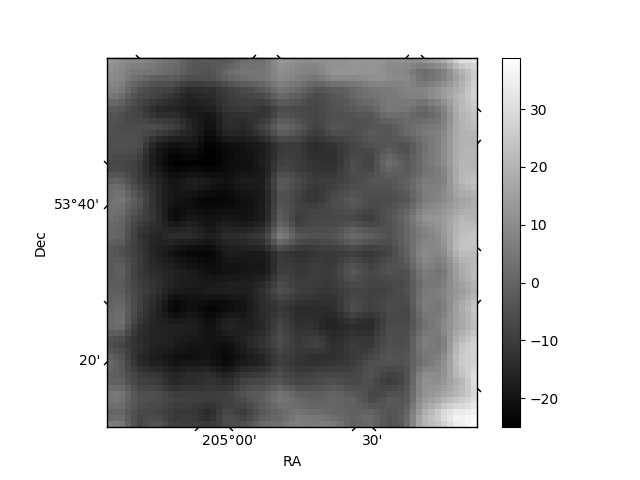
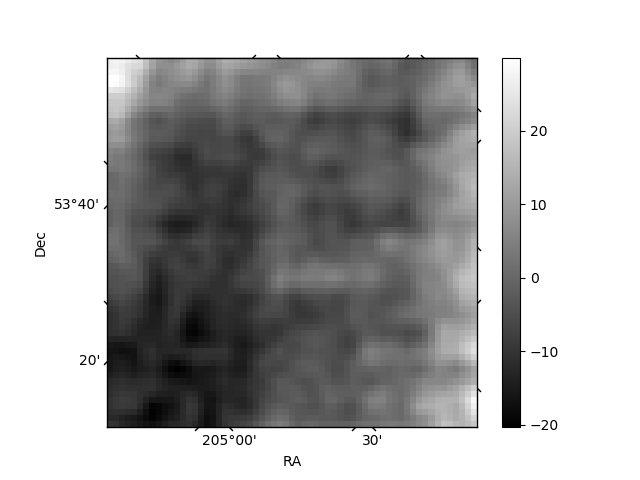
Histogram calculated using DETX and DETY for each event in the final _common_clean file
| Quadrant A | 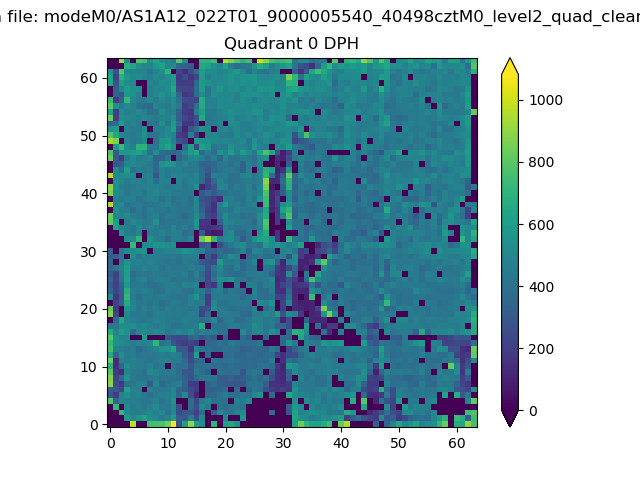 |
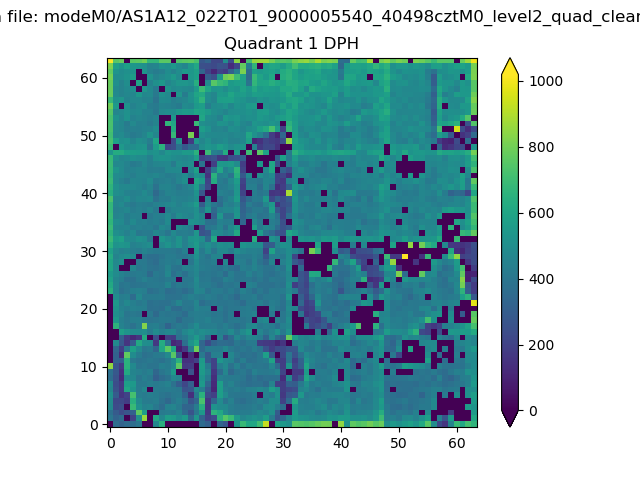 |
Quadrant B |
|---|---|---|---|
| Quadrant D | 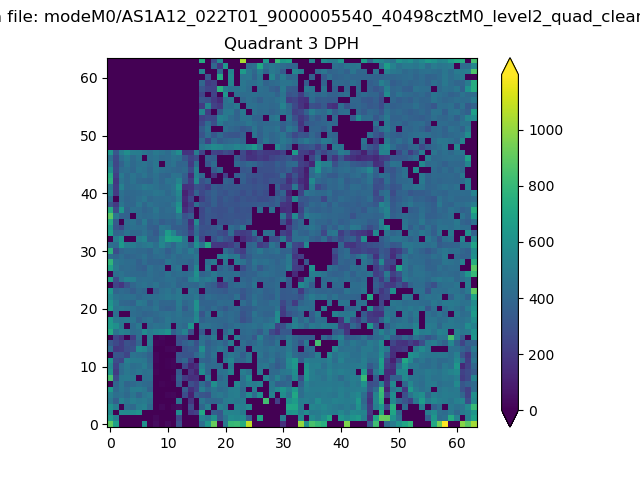 |
 |
Quadrant C |
| Plot type | Count rate plots | Images |
|---|---|---|
| Comparison with Poisson distribution Blue bars denote a histogram of data divided into 1 sec bins. Red curve is a Poisson curve with rate = median count rate of data. |
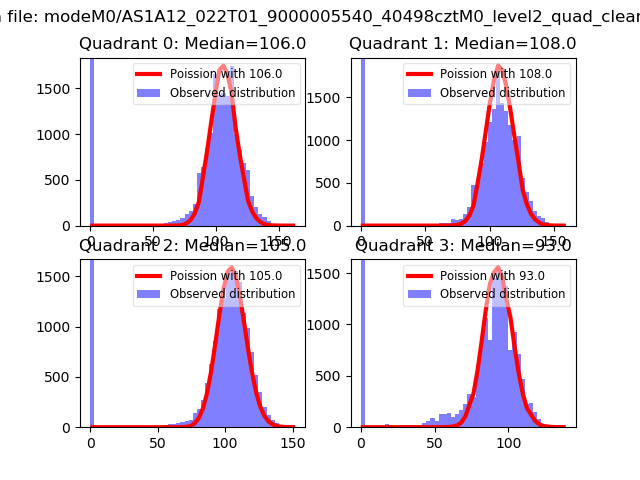 |
 |
| Quadrant-wise count rates Data is divided into 100 sec bins |
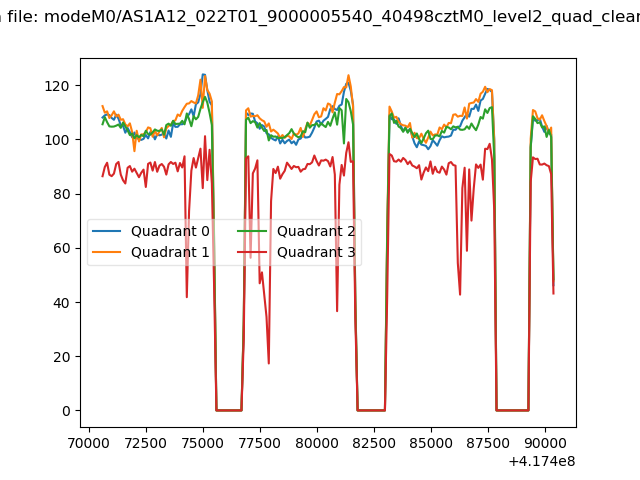 |
|
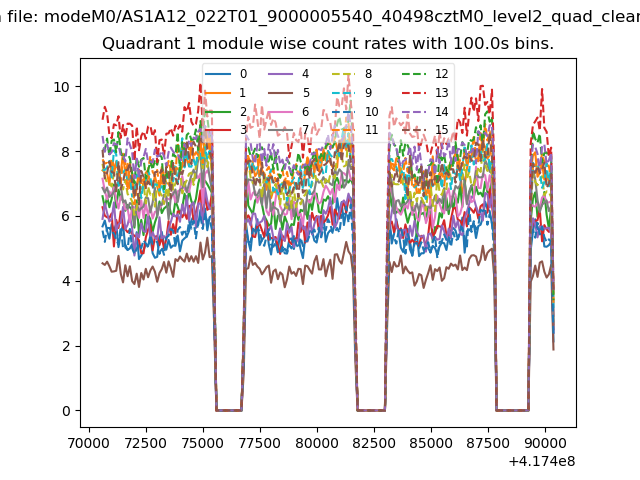
| Module-wise count rates for Quadrant A Data is divided into 100 sec bins |
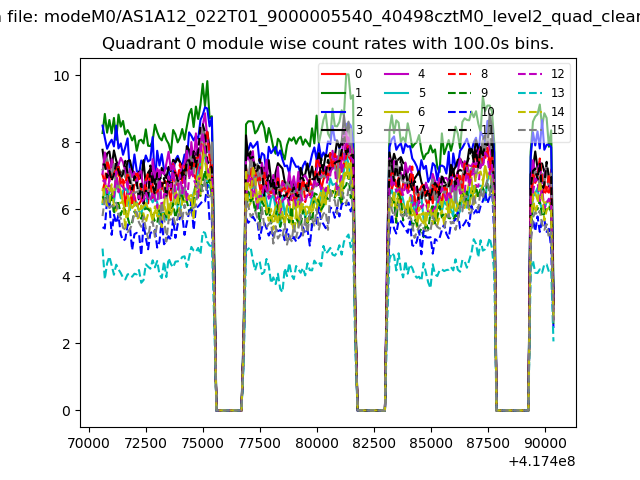 |
 |
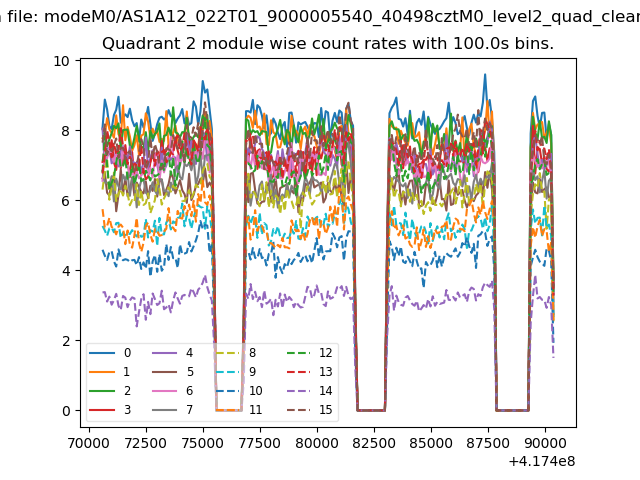
| Module-wise count rates for Quadrant B Data is divided into 100 sec bins |
 |
 |
| Module-wise count rates for Quadrant C Data is divided into 100 sec bins |
 |
 |
| Module-wise count rates for Quadrant D Data is divided into 100 sec bins |
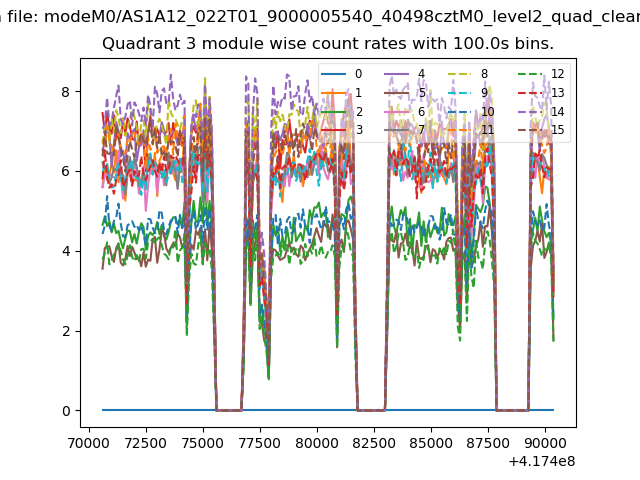 |
 |
| Parameter | Plot |
|---|---|
| CZT HV Monitor | 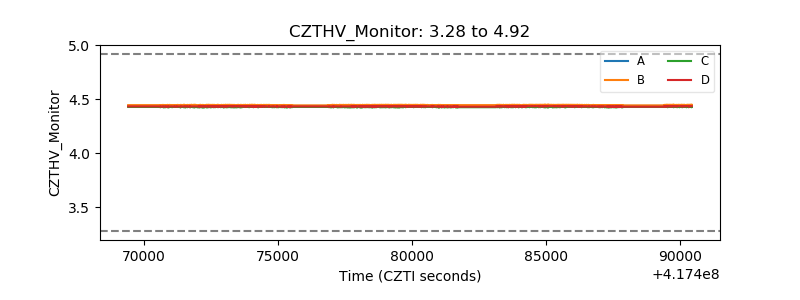 |
| D_VDD | 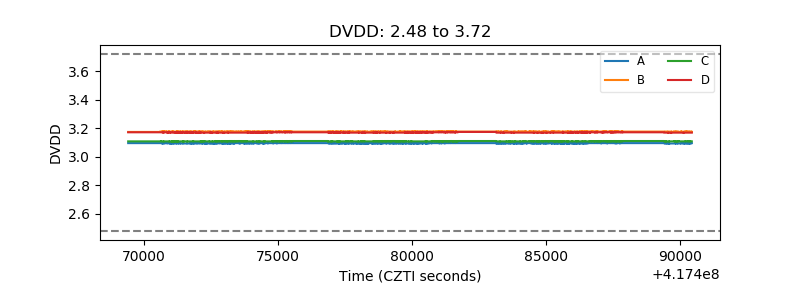 |
| Temperature 1 | 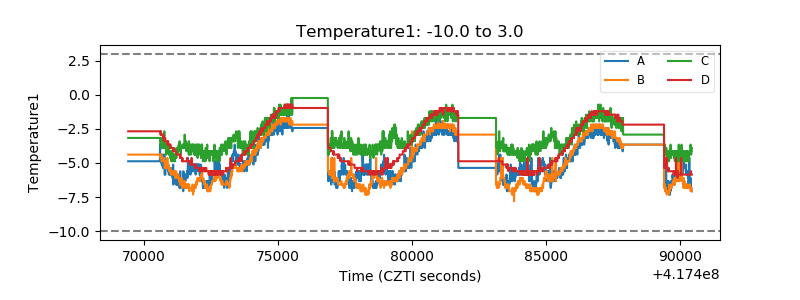 |
| Veto HV Monitor | 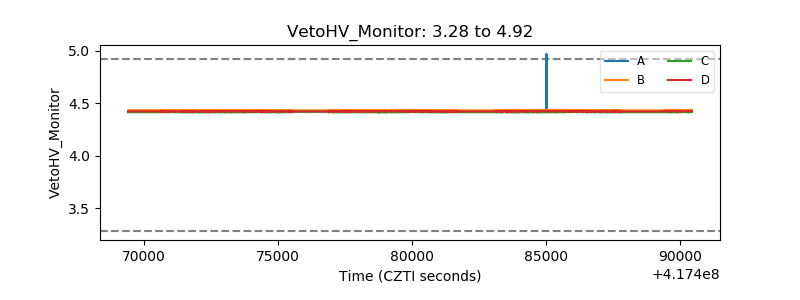 |
| Veto LLD | 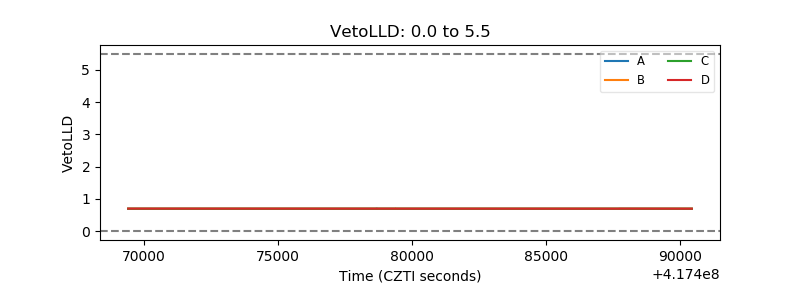 |
| Alpha Counter | 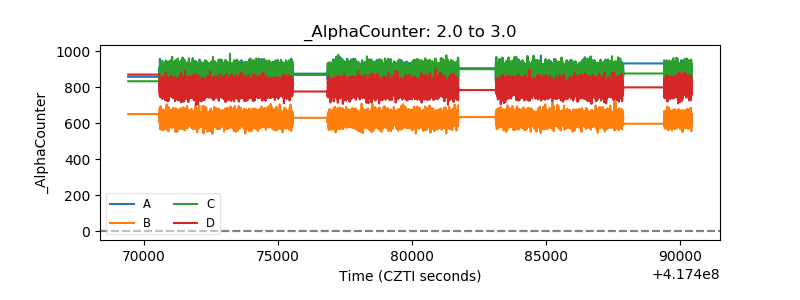 |
| _CPM_Rate | 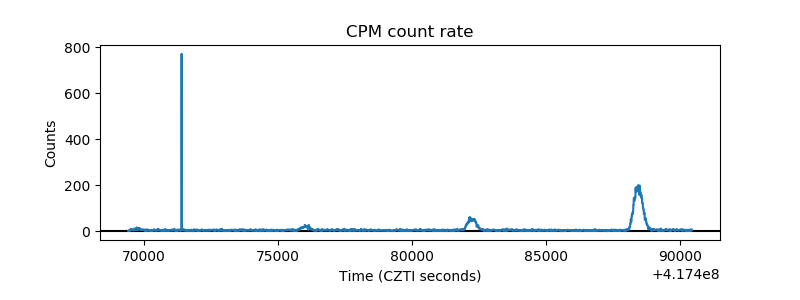 |
| CZT Counter | 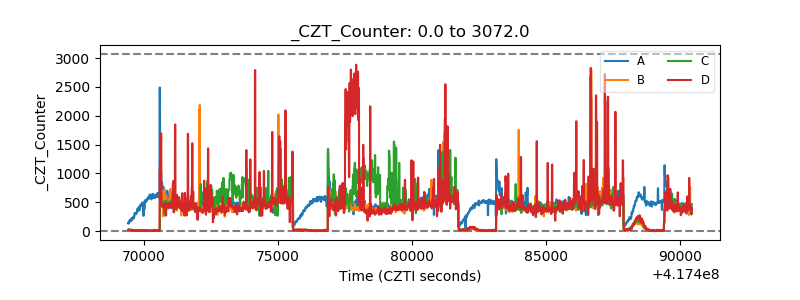 |
| +2.5 Volts monitor | 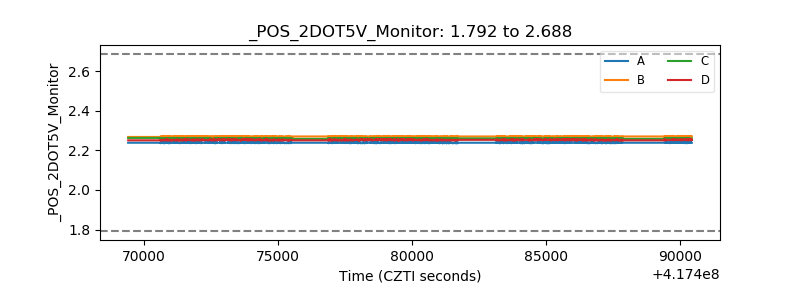 |
| +5 Volts monitor | 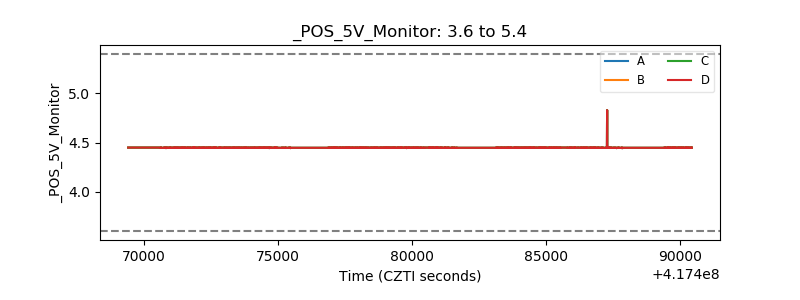 |
| _ROLL_ROT | 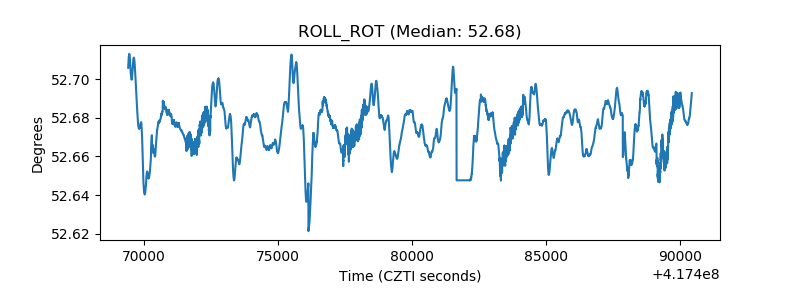 |
| _Roll_DEC | 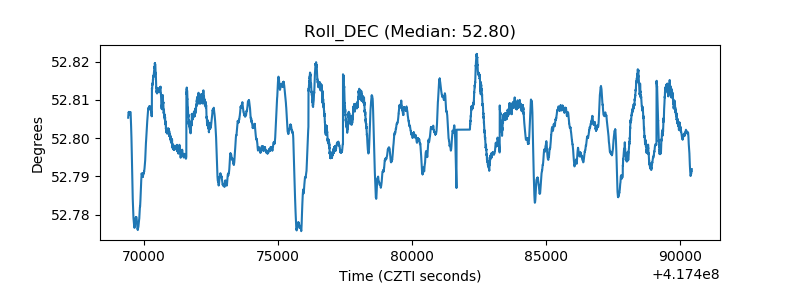 |
| _Roll_RA | 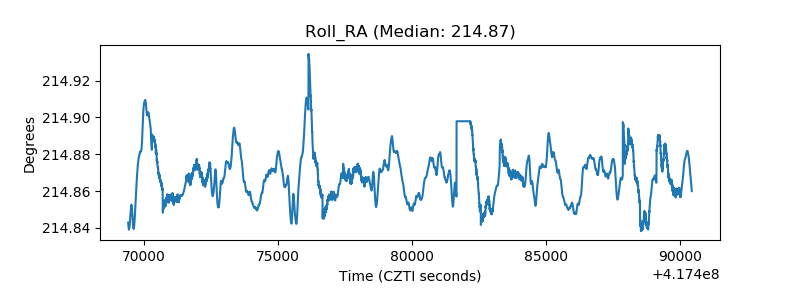 |
| Veto Counter | 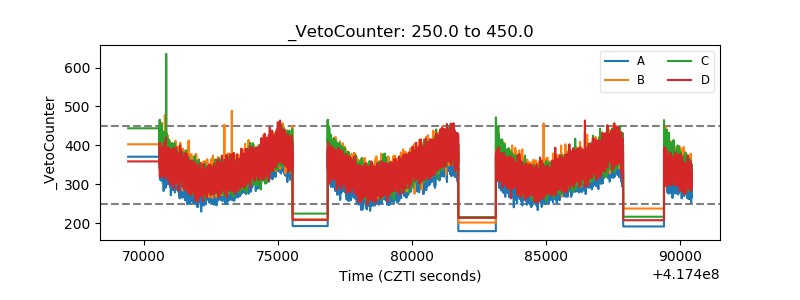 |