| Param | Original file | Final file |
|---|---|---|
| Filename | modeM0/AS1A12_022T01_9000005540_40499cztM0_level2.fits | modeM0/AS1A12_022T01_9000005540_40499cztM0_level2_quad_clean.evt |
| Size (bytes) | 304,801,920 | 88,444,800 |
| Size | 290.7 MB | 84.3 MB |
| Events in quadrant A | 2,835,852 | 593,541 |
| Events in quadrant B | 2,416,426 | 608,460 |
| Events in quadrant C | 2,582,803 | 582,886 |
| Events in quadrant D | 3,014,301 | 504,399 |
| Mode M0 | |||
|---|---|---|---|
| Quadrant | BADHDUFLAG | Total packets | Discarded packets |
| A | 0 | 11950 | 3 |
| B | 0 | 11303 | 2 |
| C | 0 | 11421 | 2 |
| D | 0 | 13124 | 2 |
| Mode M9 | |||
|---|---|---|---|
| Quadrant | BADHDUFLAG | Total packets | Discarded packets |
| A | 0 | 20 | 0 |
| B | 0 | 20 | 0 |
| C | 0 | 20 | 0 |
| D | 0 | 21 | 0 |
| Mode SS | |||
|---|---|---|---|
| Quadrant | BADHDUFLAG | Total packets | Discarded packets |
| A | 0 | 114 | 0 |
| B | 0 | 114 | 0 |
| C | 0 | 114 | 0 |
| D | 0 | 114 | 0 |
| Quadrant | Total seconds | Saturated seconds | Saturation percentage |
|---|---|---|---|
| A | 5552 | 8 | 0.144092% |
| B | 5552 | 8 | 0.144092% |
| C | 5552 | 13 | 0.234150% |
| D | 5552 | 413 | 7.438761% |
Noise dominated data is calculated using 1-second bins in cleaned event files. If a bin has >2000 counts, and if more than 50% of those come from <1% of pixels, then it is considered to be noise-dominated and hence unusable.
| Quadrant | # 1 sec bins | Bins with >0 counts | Bins with >2000 counts | High rate bins dominated by noise | Noise dominated (total time) | Noise dominated (detector-on time) | Marked lightcurve |
|---|---|---|---|---|---|---|---|
| A | 7195 | 5553 | 4 | 4 | 0.06% | 0.07% | 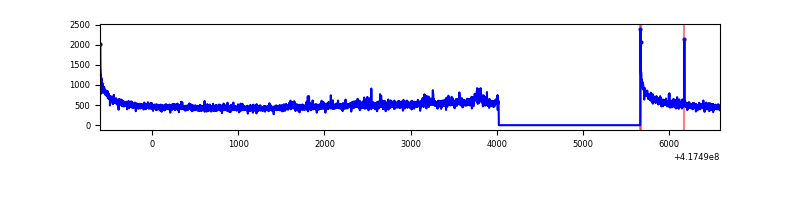 |
| B | 7195 | 5553 | 2 | 2 | 0.03% | 0.04% | 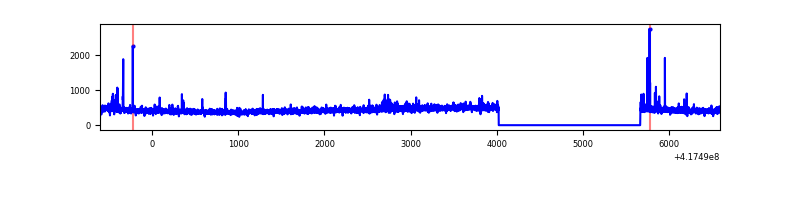 |
| C | 7195 | 5553 | 7 | 7 | 0.10% | 0.13% | 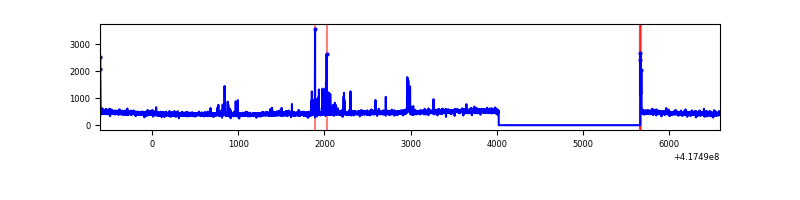 |
| D | 7195 | 5553 | 85 | 85 | 1.18% | 1.53% | 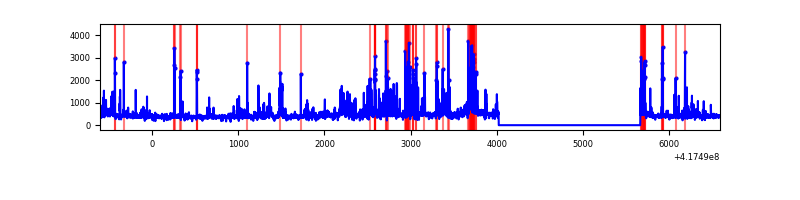 |
Top three noisy pixels from each quadrant. If the there are fewer than three noisy pixels in the level2.evt file, extra rows are filled as -1
| Pixel properties | Quadrant properties | ||||||
|---|---|---|---|---|---|---|---|
| Quadrant | DetID | PixID | Counts | Sigma | Mean | Median | Sigma |
| A | 10 | 83 | 496093 | 4140.84 | 585 | 574 | 119.7 |
| A | 12 | 189 | 53322 | 440.79 | 585 | 574 | 119.7 |
| A | 2 | 79 | 14321 | 114.88 | 585 | 574 | 119.7 |
| B | 3 | 112 | 43155 | 372.34 | 582 | 563 | 114.4 |
| B | 5 | 255 | 36482 | 314.01 | 582 | 563 | 114.4 |
| B | 4 | 170 | 32098 | 275.68 | 582 | 563 | 114.4 |
| C | 15 | 214 | 243970 | 1840.51 | 570 | 573 | 132.2 |
| C | 14 | 254 | 59463 | 445.31 | 570 | 573 | 132.2 |
| C | 0 | 207 | 26314 | 194.65 | 570 | 573 | 132.2 |
| D | 12 | 227 | 335023 | 2464.88 | 545 | 528 | 135.7 |
| D | 2 | 250 | 273025 | 2008.02 | 545 | 528 | 135.7 |
| D | 12 | 191 | 131634 | 966.11 | 545 | 528 | 135.7 |
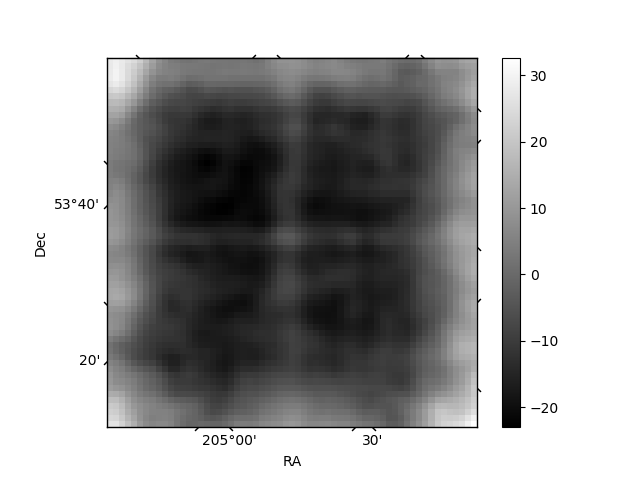
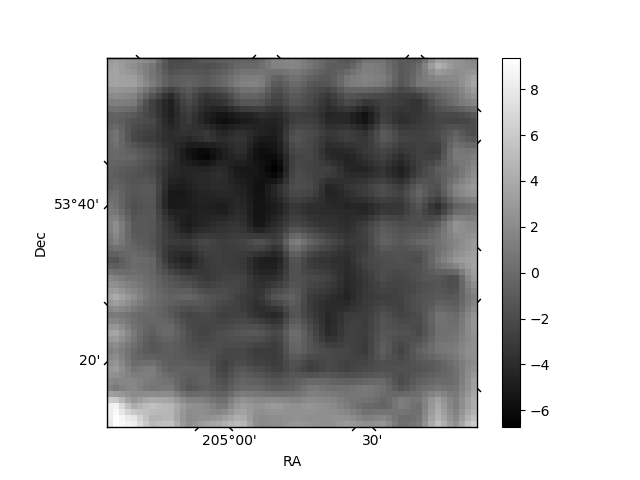
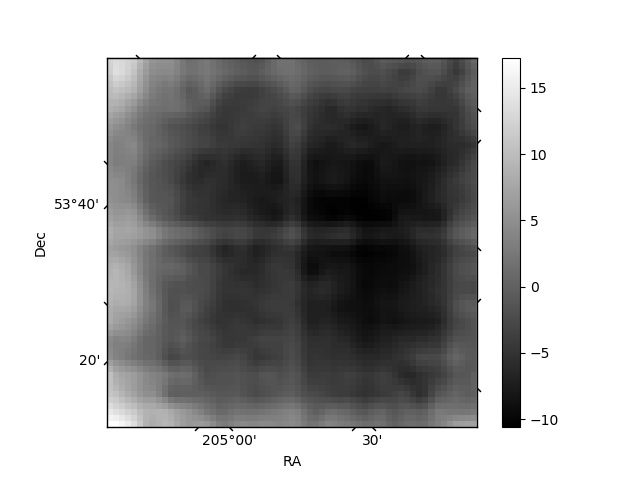
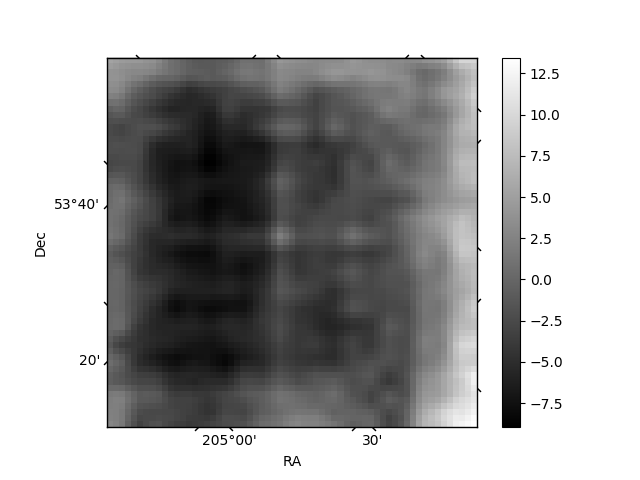
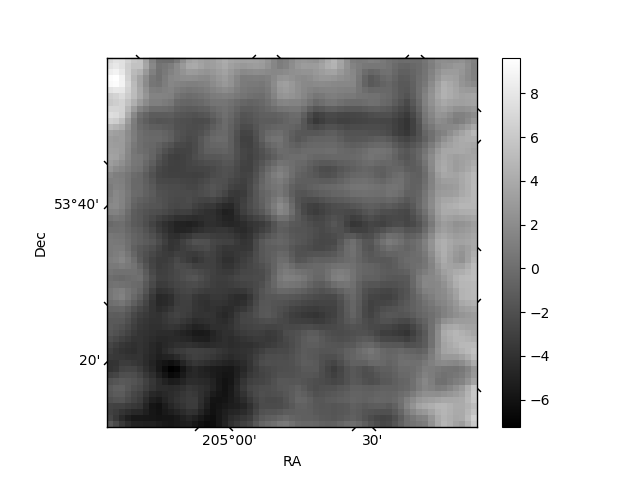
Histogram calculated using DETX and DETY for each event in the final _common_clean file
| Quadrant A | 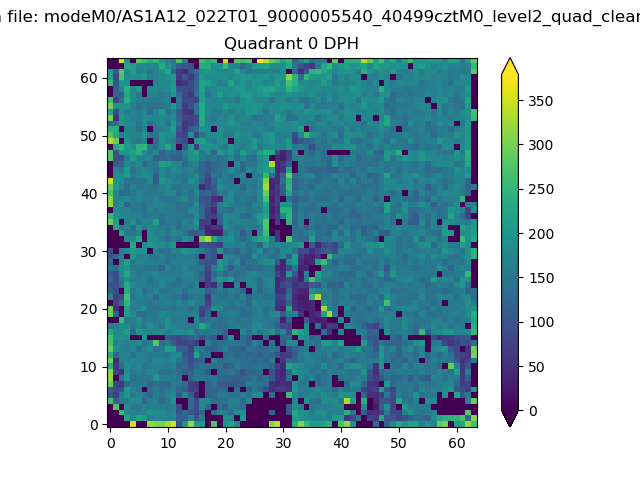 |
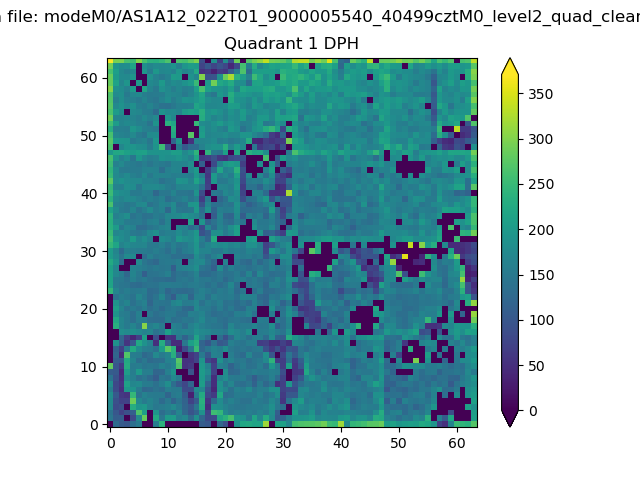 |
Quadrant B |
|---|---|---|---|
| Quadrant D | 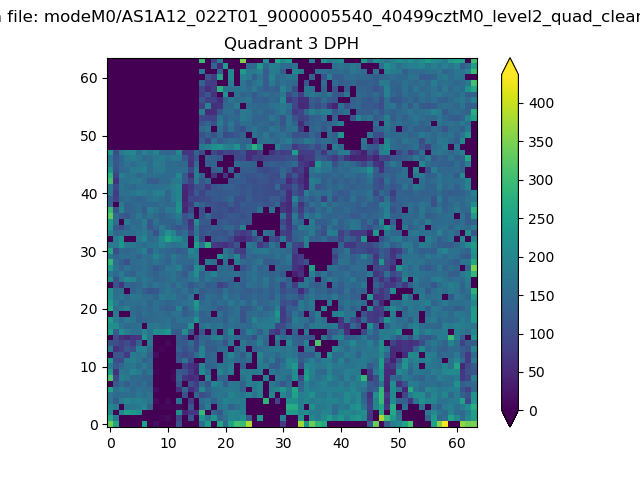 |
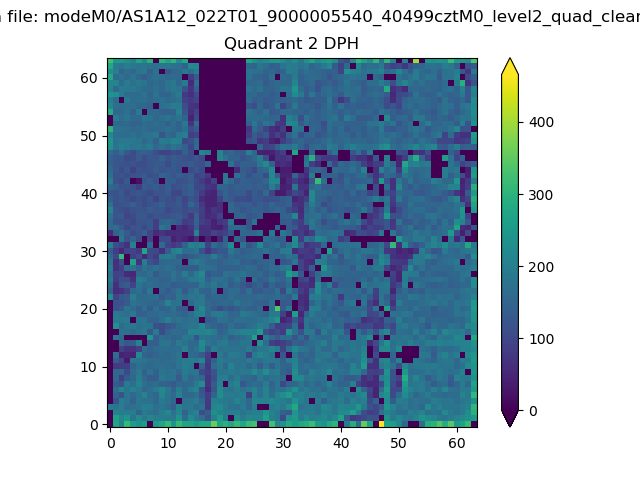 |
Quadrant C |
| Plot type | Count rate plots | Images |
|---|---|---|
| Comparison with Poisson distribution Blue bars denote a histogram of data divided into 1 sec bins. Red curve is a Poisson curve with rate = median count rate of data. |
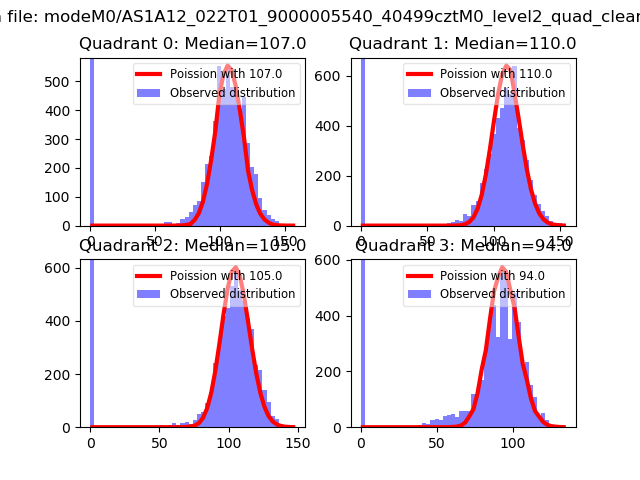 |
 |
| Quadrant-wise count rates Data is divided into 100 sec bins |
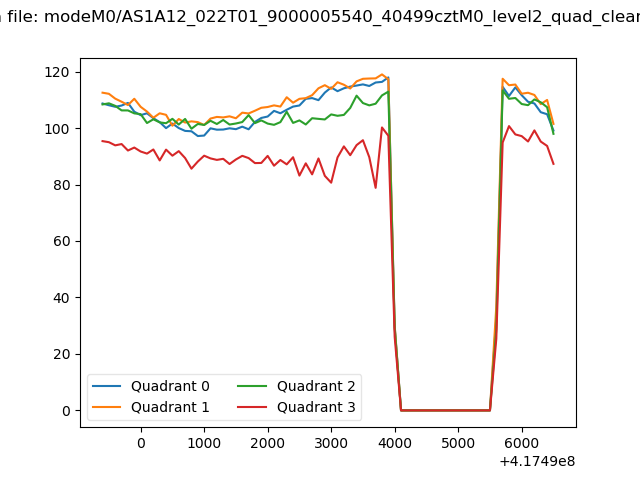 |
|
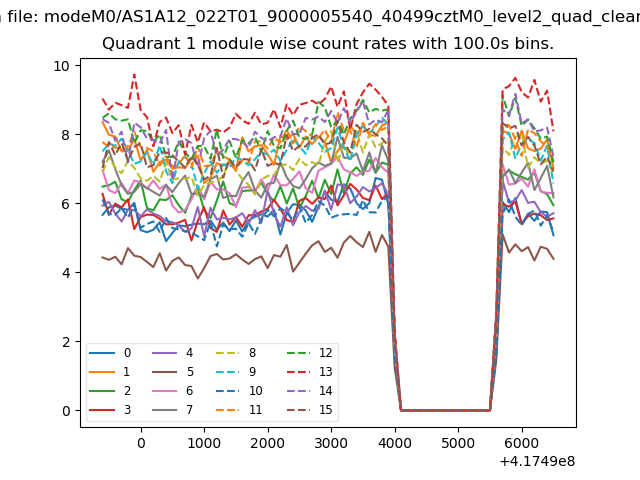
| Module-wise count rates for Quadrant A Data is divided into 100 sec bins |
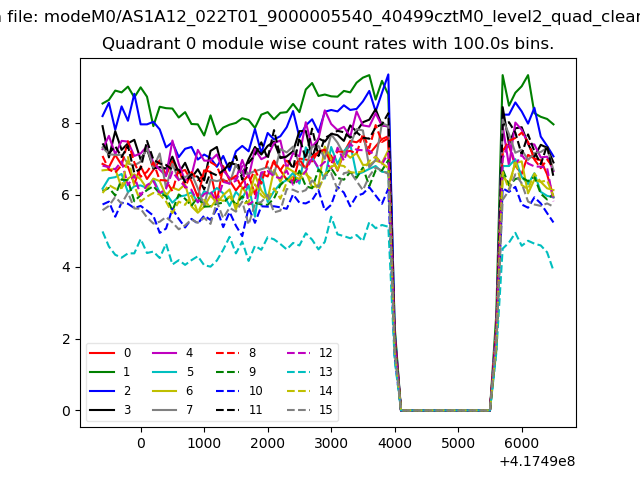 |
 |
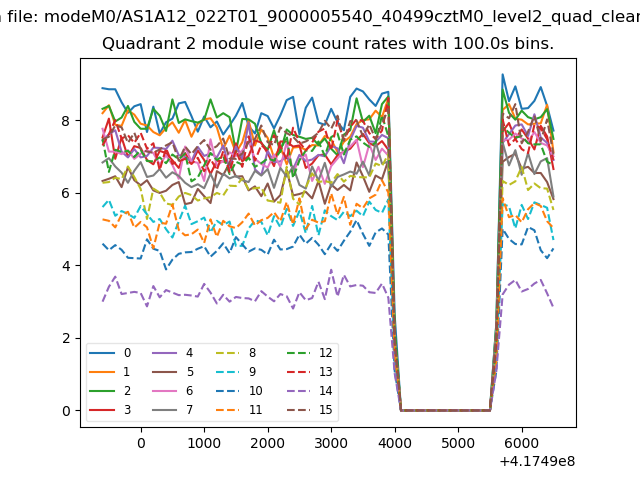
| Module-wise count rates for Quadrant B Data is divided into 100 sec bins |
 |
 |
| Module-wise count rates for Quadrant C Data is divided into 100 sec bins |
 |
 |
| Module-wise count rates for Quadrant D Data is divided into 100 sec bins |
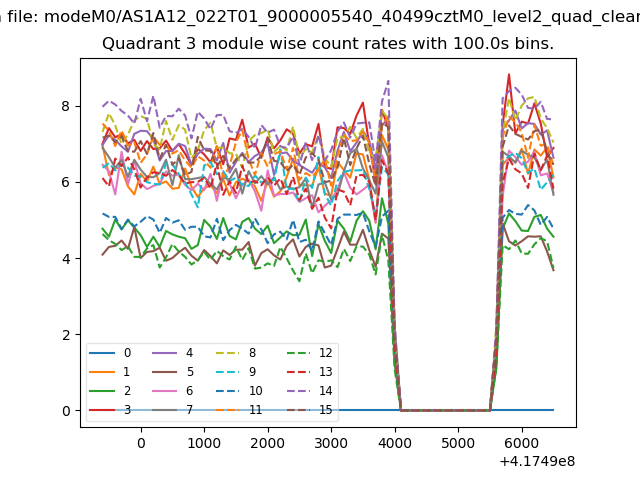 |
 |
| Parameter | Plot |
|---|---|
| CZT HV Monitor | 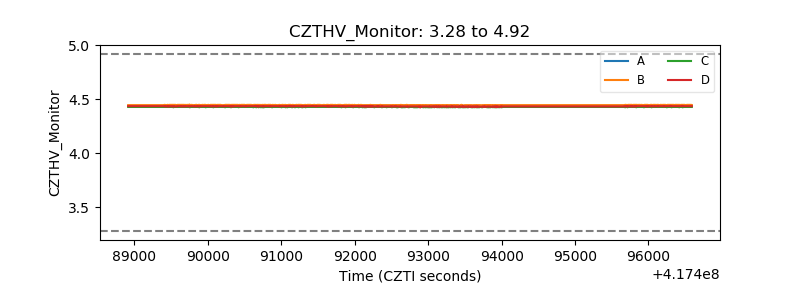 |
| D_VDD | 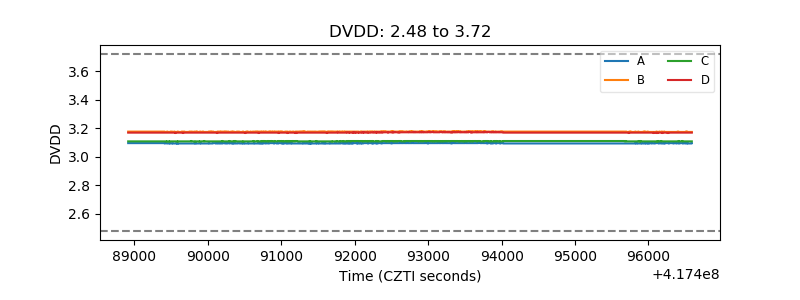 |
| Temperature 1 | 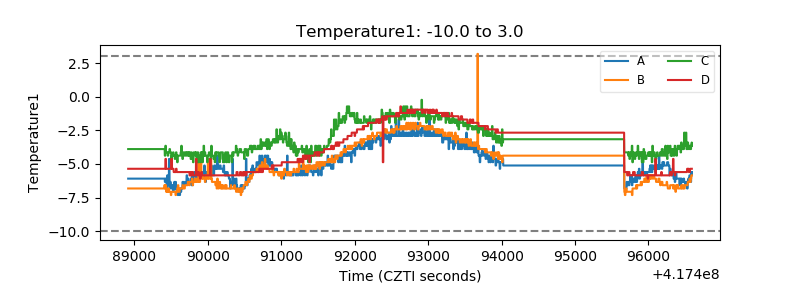 |
| Veto HV Monitor | 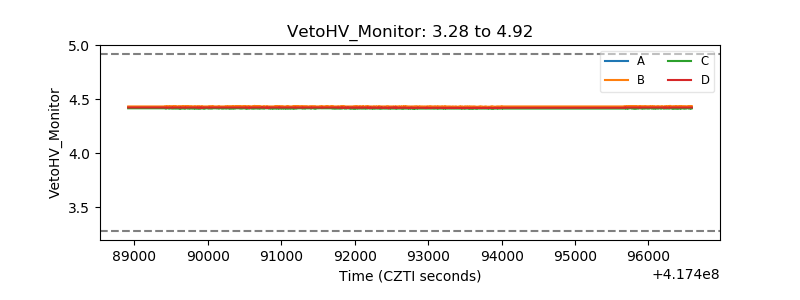 |
| Veto LLD |  |
| Alpha Counter | 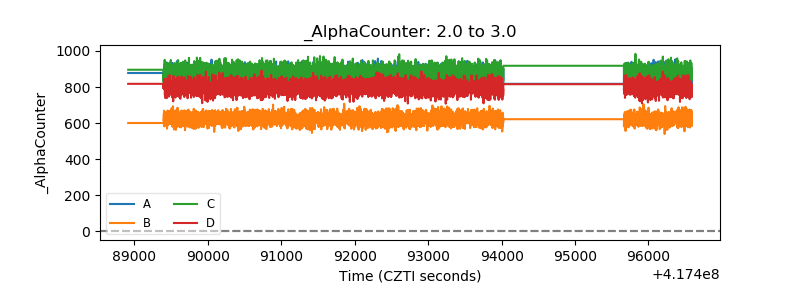 |
| _CPM_Rate | 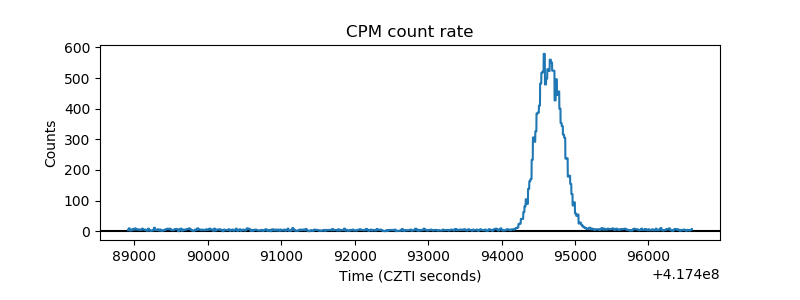 |
| CZT Counter | 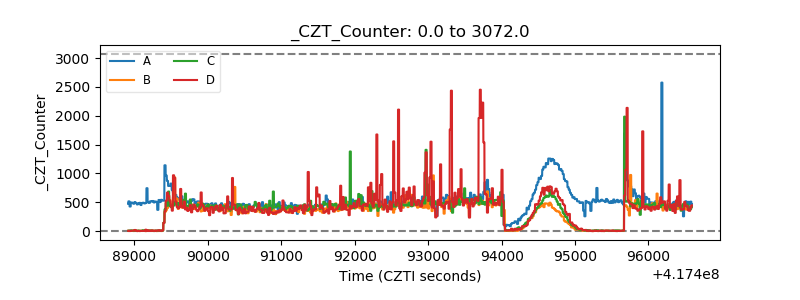 |
| +2.5 Volts monitor | 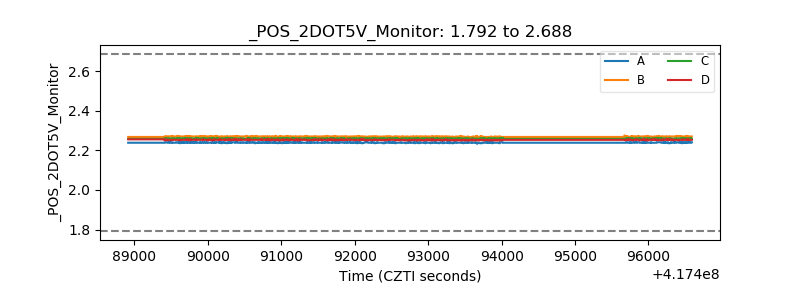 |
| +5 Volts monitor | 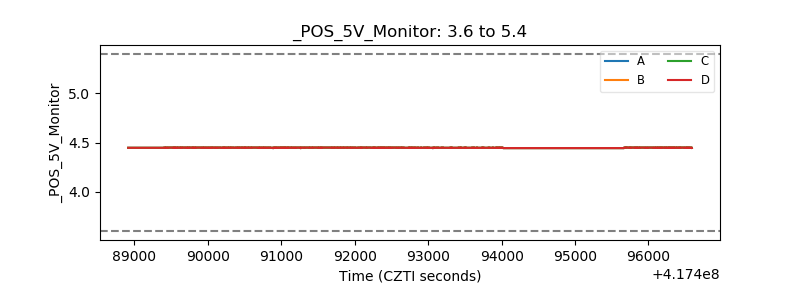 |
| _ROLL_ROT | 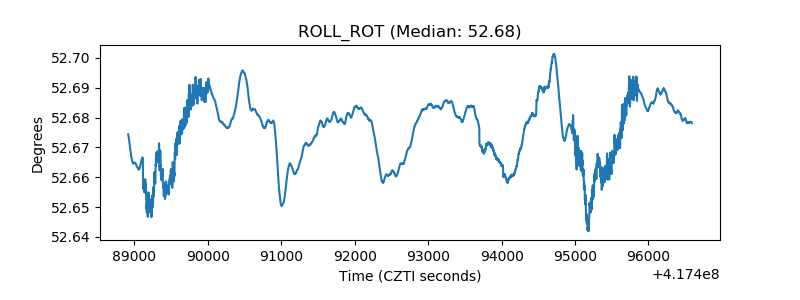 |
| _Roll_DEC | 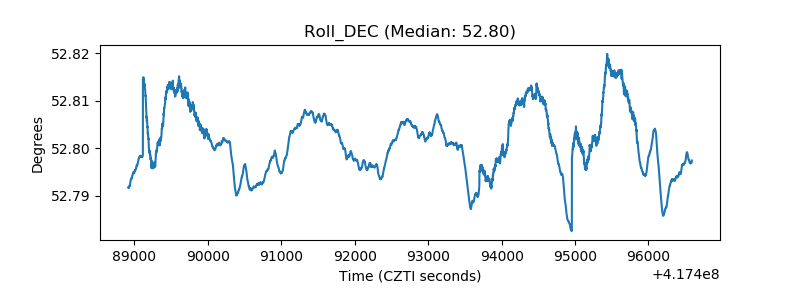 |
| _Roll_RA | 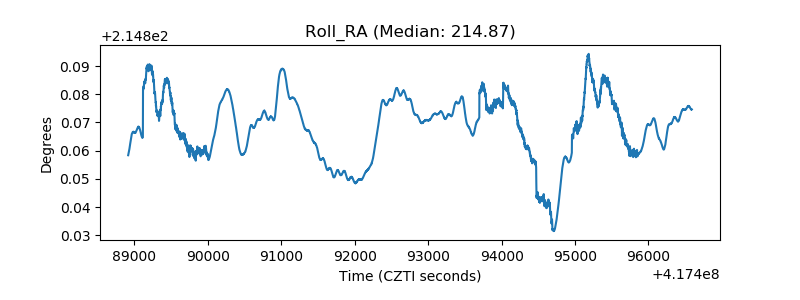 |
| Veto Counter |  |