| Param | Original file | Final file |
|---|---|---|
| Filename | modeM0/AS1A12_022T01_9000005540_40501cztM0_level2.fits | modeM0/AS1A12_022T01_9000005540_40501cztM0_level2_quad_clean.evt |
| Size (bytes) | 316,704,960 | 90,558,720 |
| Size | 302.0 MB | 86.4 MB |
| Events in quadrant A | 2,866,298 | 614,005 |
| Events in quadrant B | 2,530,469 | 630,662 |
| Events in quadrant C | 2,694,720 | 600,298 |
| Events in quadrant D | 3,195,614 | 505,824 |
| Mode M0 | |||
|---|---|---|---|
| Quadrant | BADHDUFLAG | Total packets | Discarded packets |
| A | 0 | 11891 | 3 |
| B | 0 | 11476 | 2 |
| C | 0 | 11746 | 2 |
| D | 0 | 13482 | 2 |
| Mode M9 | |||
|---|---|---|---|
| Quadrant | BADHDUFLAG | Total packets | Discarded packets |
| A | 0 | 18 | 0 |
| B | 0 | 18 | 0 |
| C | 0 | 18 | 0 |
| D | 0 | 19 | 0 |
| Mode SS | |||
|---|---|---|---|
| Quadrant | BADHDUFLAG | Total packets | Discarded packets |
| A | 0 | 114 | 0 |
| B | 0 | 114 | 0 |
| C | 0 | 114 | 0 |
| D | 0 | 114 | 0 |
| Quadrant | Total seconds | Saturated seconds | Saturation percentage |
|---|---|---|---|
| A | 5591 | 11 | 0.196745% |
| B | 5591 | 13 | 0.232517% |
| C | 5591 | 22 | 0.393490% |
| D | 5591 | 586 | 10.481130% |
Noise dominated data is calculated using 1-second bins in cleaned event files. If a bin has >2000 counts, and if more than 50% of those come from <1% of pixels, then it is considered to be noise-dominated and hence unusable.
| Quadrant | # 1 sec bins | Bins with >0 counts | Bins with >2000 counts | High rate bins dominated by noise | Noise dominated (total time) | Noise dominated (detector-on time) | Marked lightcurve |
|---|---|---|---|---|---|---|---|
| A | 7385 | 5592 | 4 | 4 | 0.05% | 0.07% | 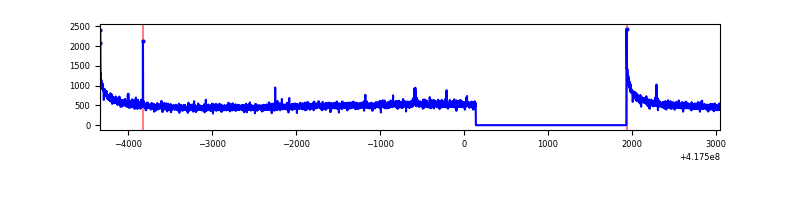 |
| B | 7385 | 5592 | 5 | 5 | 0.07% | 0.09% | 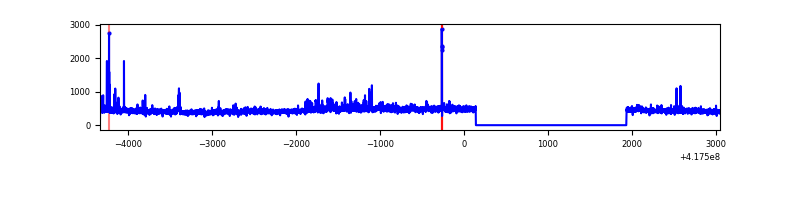 |
| C | 7385 | 5592 | 15 | 15 | 0.20% | 0.27% | 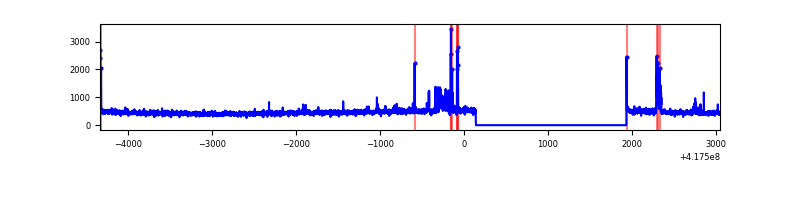 |
| D | 7385 | 5592 | 132 | 132 | 1.79% | 2.36% | 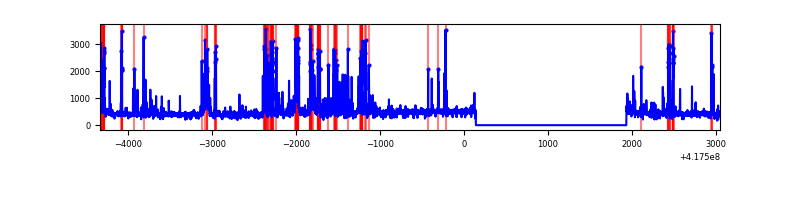 |
Top three noisy pixels from each quadrant. If the there are fewer than three noisy pixels in the level2.evt file, extra rows are filled as -1
| Pixel properties | Quadrant properties | ||||||
|---|---|---|---|---|---|---|---|
| Quadrant | DetID | PixID | Counts | Sigma | Mean | Median | Sigma |
| A | 10 | 83 | 512776 | 4186.17 | 600 | 590 | 122.4 |
| A | 12 | 189 | 12974 | 101.22 | 600 | 590 | 122.4 |
| A | 2 | 79 | 7550 | 56.89 | 600 | 590 | 122.4 |
| B | 3 | 112 | 60151 | 518.39 | 595 | 578 | 114.9 |
| B | 4 | 170 | 44480 | 382.02 | 595 | 578 | 114.9 |
| B | 4 | 171 | 40655 | 348.74 | 595 | 578 | 114.9 |
| C | 15 | 214 | 245164 | 1819.61 | 580 | 583 | 134.4 |
| C | 14 | 254 | 144342 | 1069.53 | 580 | 583 | 134.4 |
| C | 9 | 146 | 13964 | 99.55 | 580 | 583 | 134.4 |
| D | 12 | 0 | 321964 | 2369.34 | 552 | 536 | 135.7 |
| D | 12 | 227 | 238110 | 1751.23 | 552 | 536 | 135.7 |
| D | 2 | 250 | 207735 | 1527.32 | 552 | 536 | 135.7 |
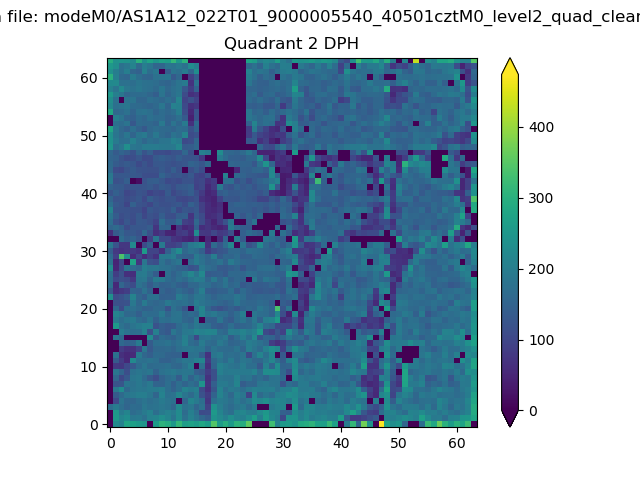
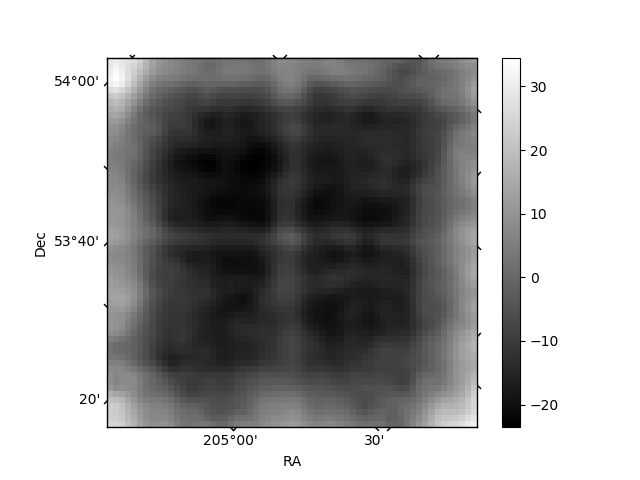
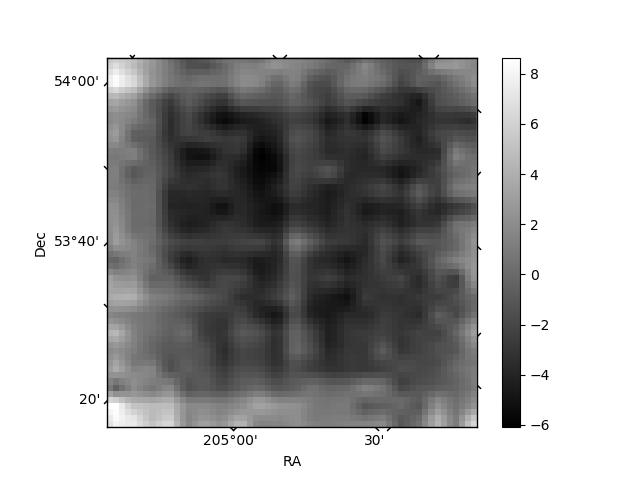
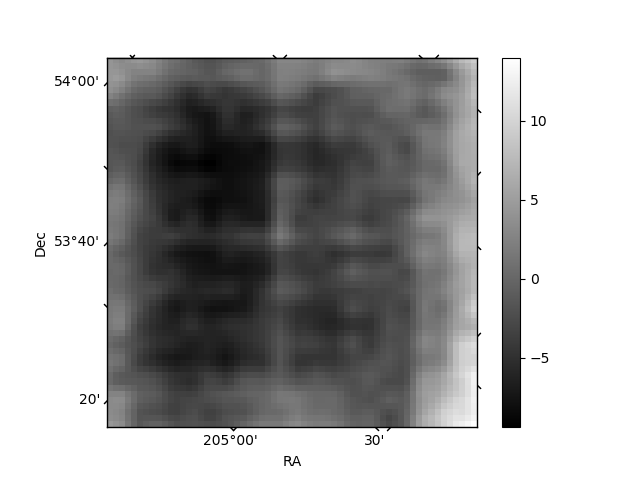
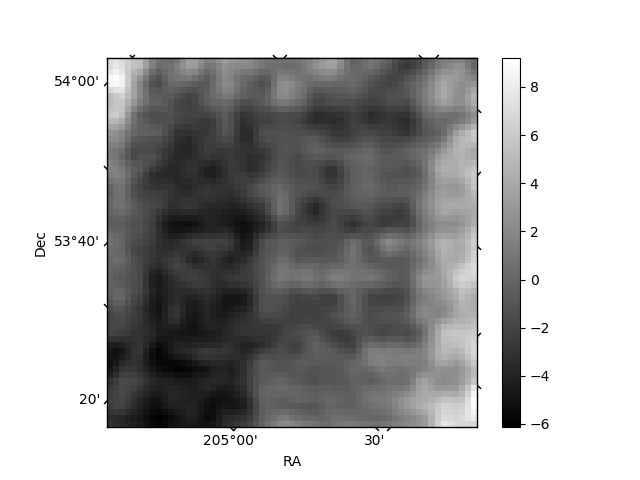
Histogram calculated using DETX and DETY for each event in the final _common_clean file
| Quadrant A | 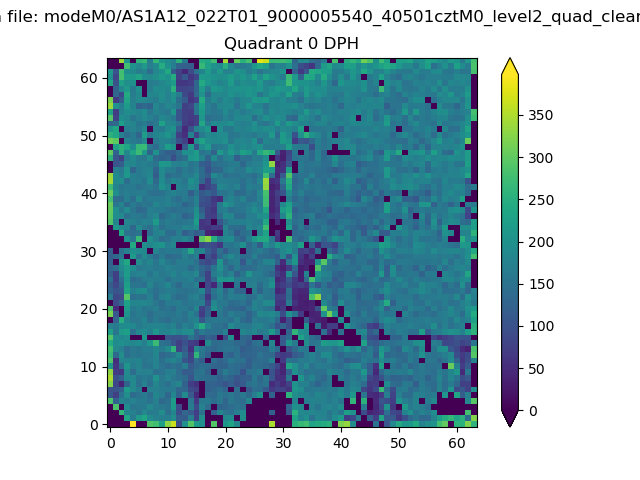 |
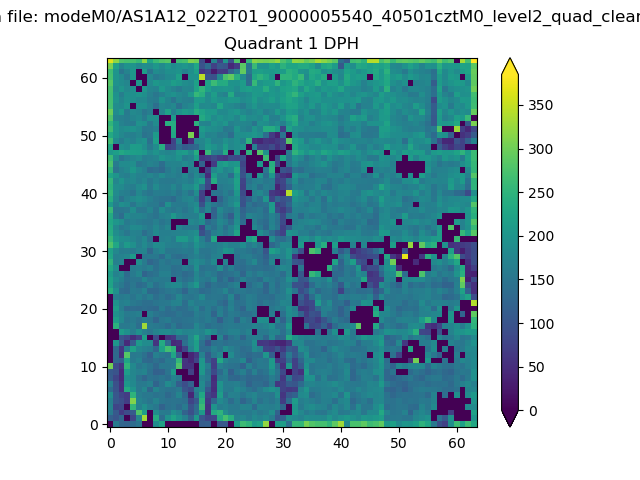 |
Quadrant B |
|---|---|---|---|
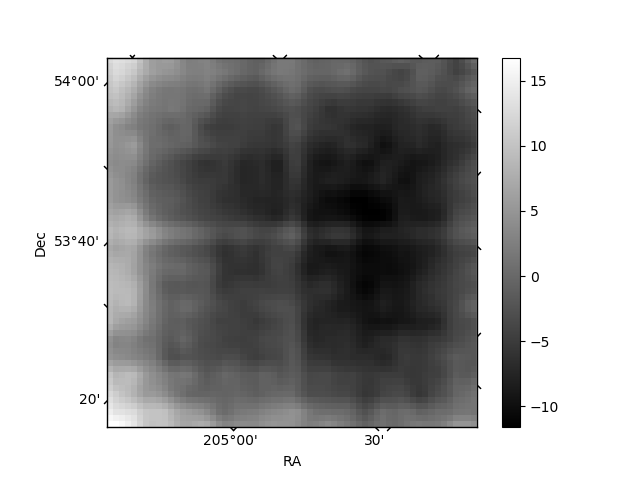
| Quadrant D | 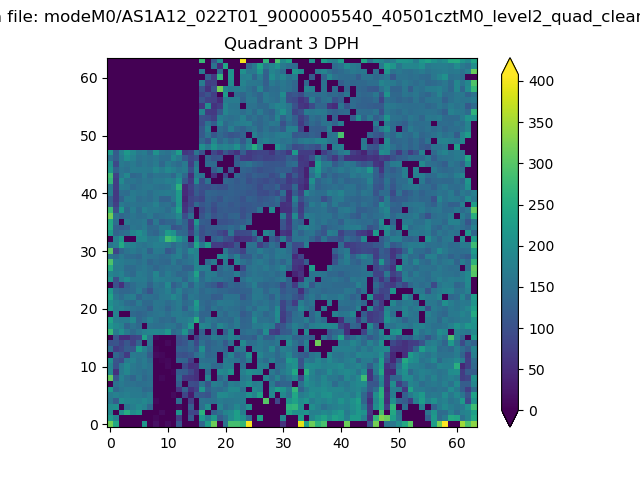 |
 |
Quadrant C |
| Plot type | Count rate plots | Images |
|---|---|---|
| Comparison with Poisson distribution Blue bars denote a histogram of data divided into 1 sec bins. Red curve is a Poisson curve with rate = median count rate of data. |
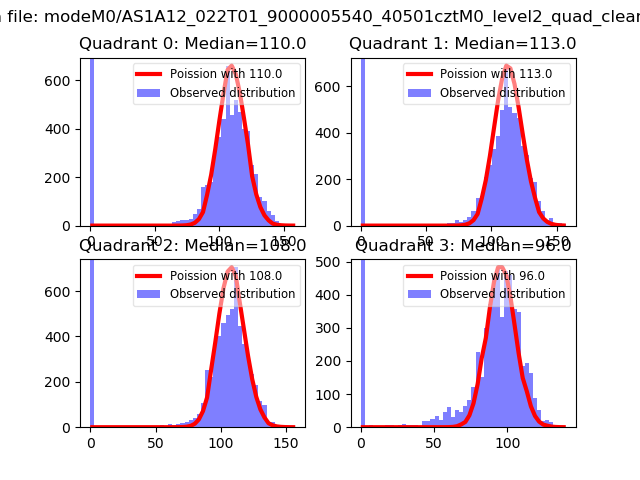 |
 |
| Quadrant-wise count rates Data is divided into 100 sec bins |
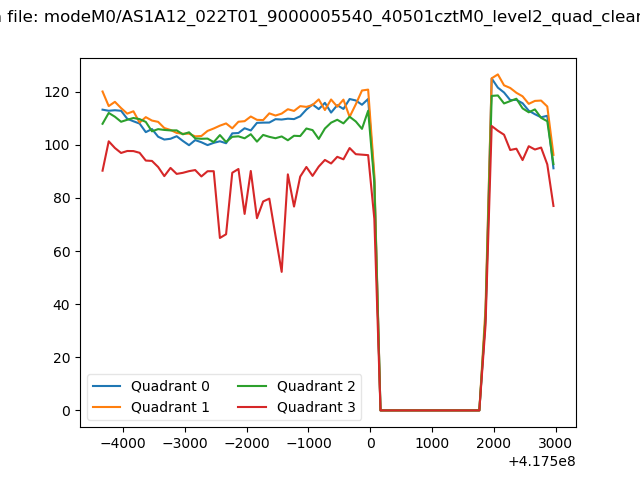 |
|
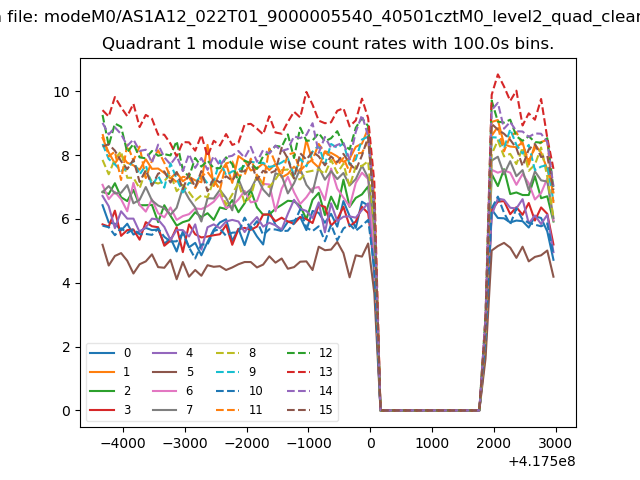
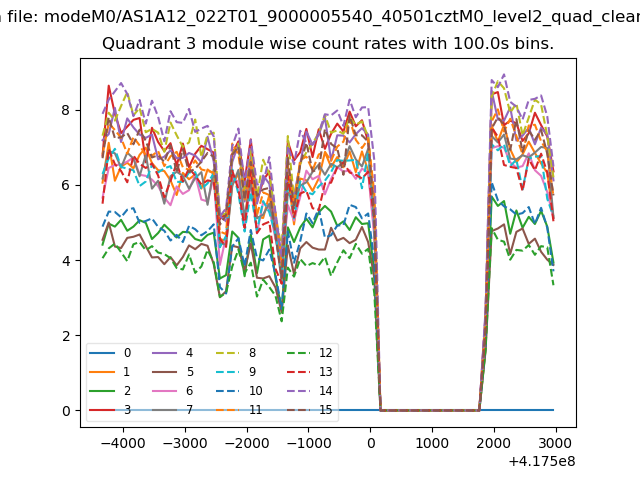
| Module-wise count rates for Quadrant A Data is divided into 100 sec bins |
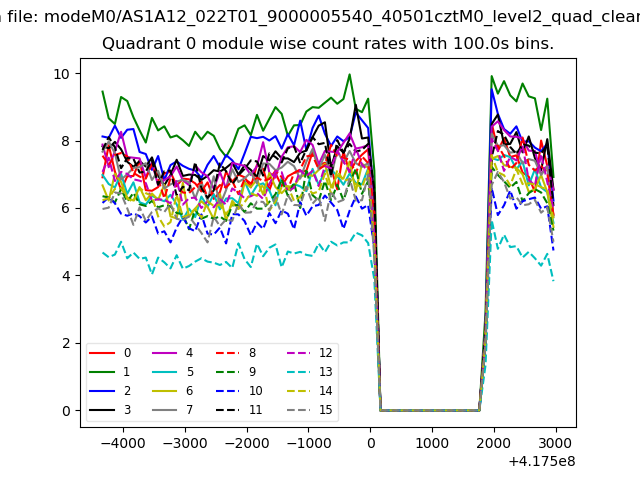 |
 |
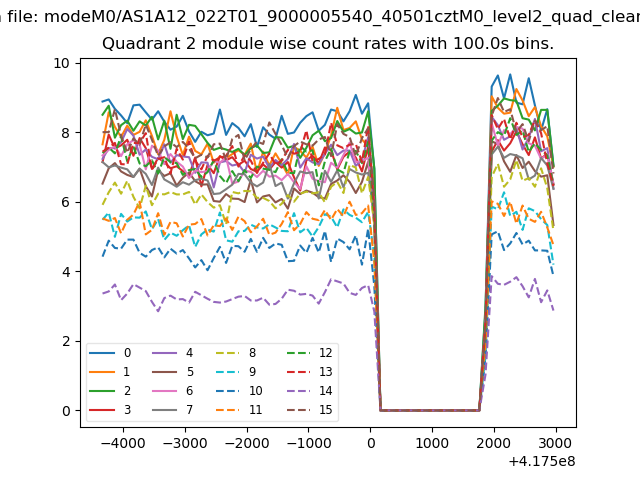
| Module-wise count rates for Quadrant B Data is divided into 100 sec bins |
 |
 |
| Module-wise count rates for Quadrant C Data is divided into 100 sec bins |
 |
 |
| Module-wise count rates for Quadrant D Data is divided into 100 sec bins |
 |
 |
| Parameter | Plot |
|---|---|
| CZT HV Monitor | 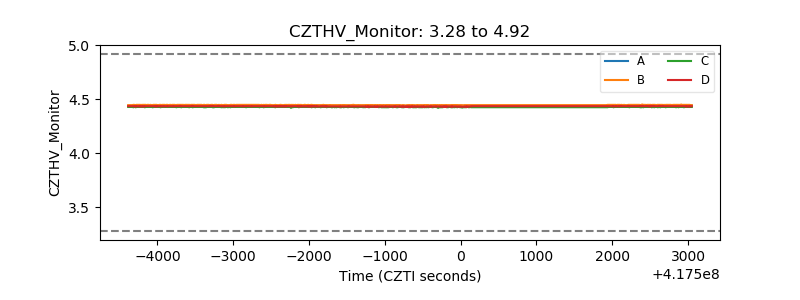 |
| D_VDD | 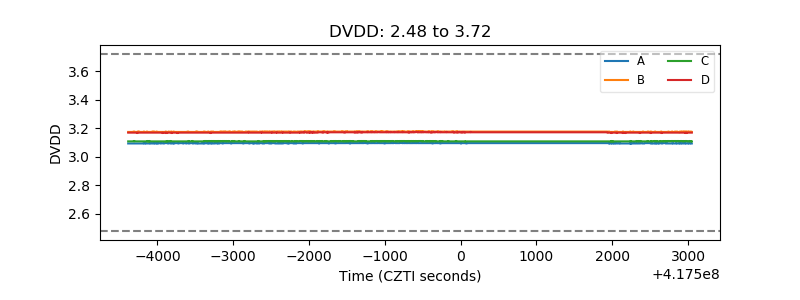 |
| Temperature 1 | 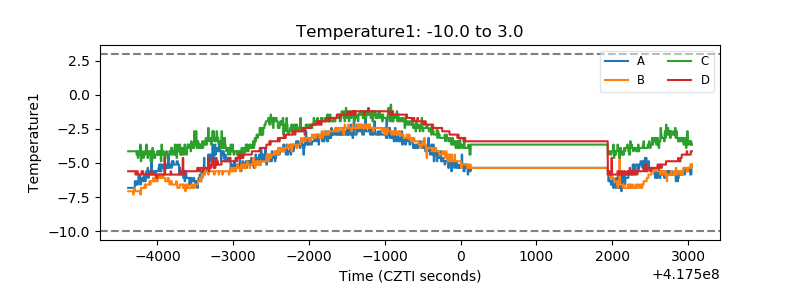 |
| Veto HV Monitor | 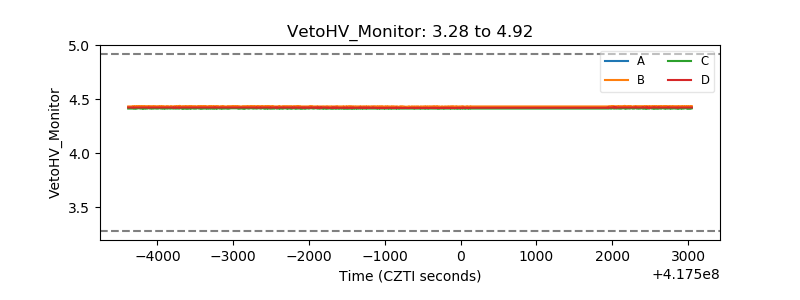 |
| Veto LLD | 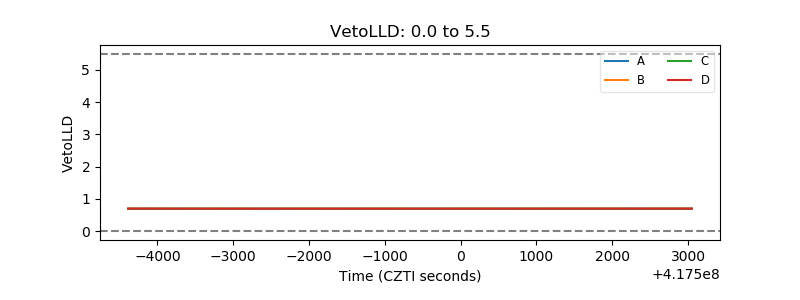 |
| Alpha Counter | 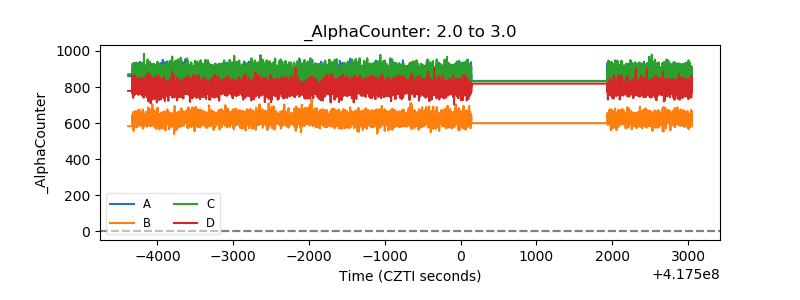 |
| _CPM_Rate | 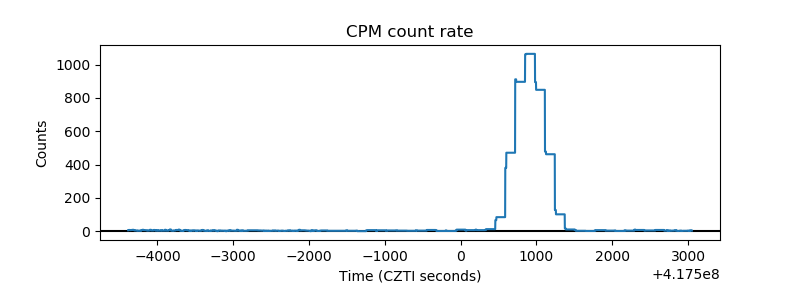 |
| CZT Counter | 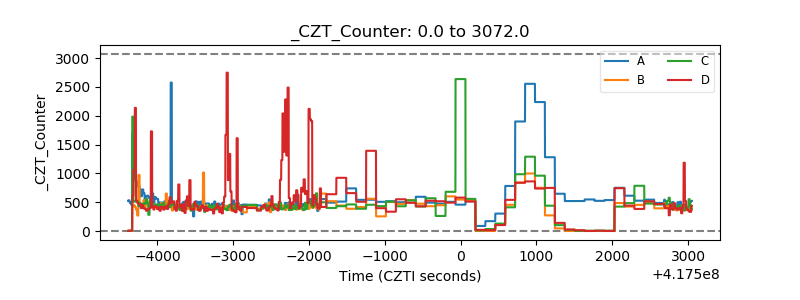 |
| +2.5 Volts monitor | 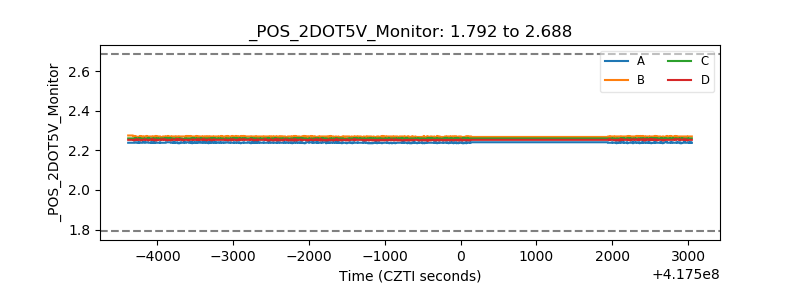 |
| +5 Volts monitor | 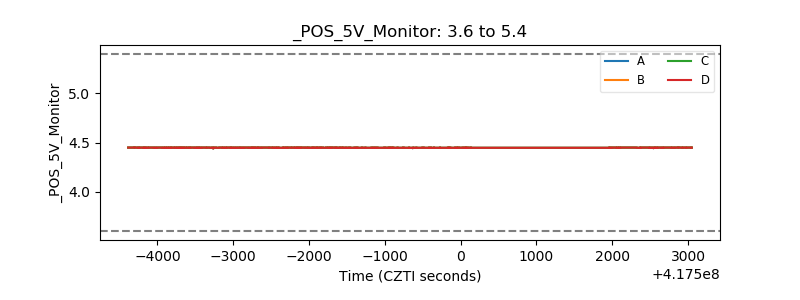 |
| _ROLL_ROT | 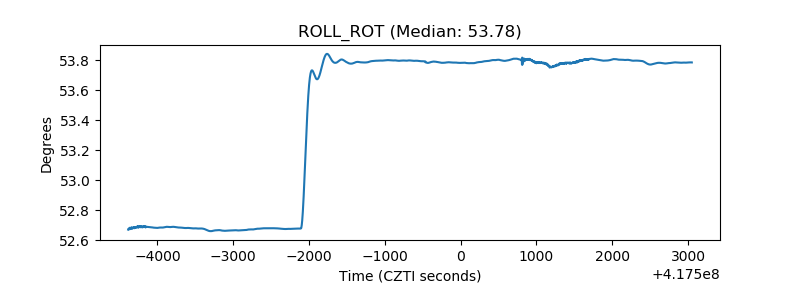 |
| _Roll_DEC | 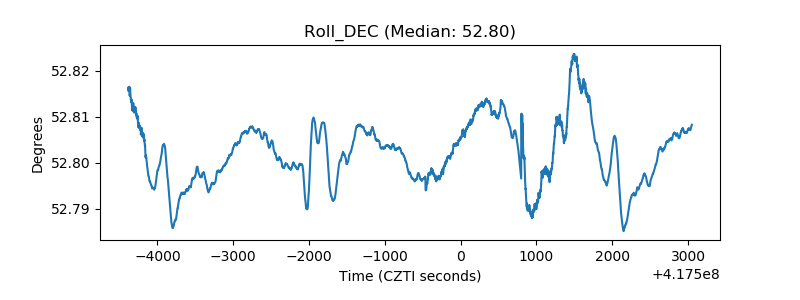 |
| _Roll_RA | 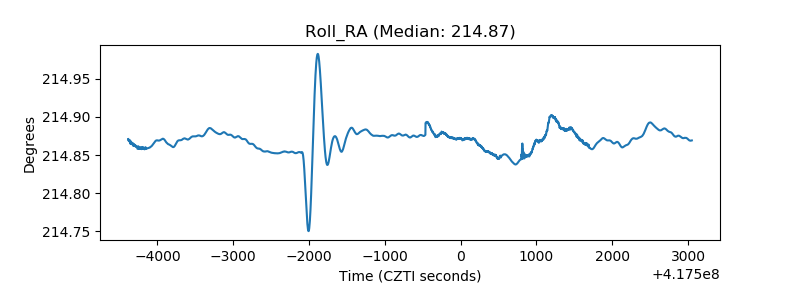 |
| Veto Counter | 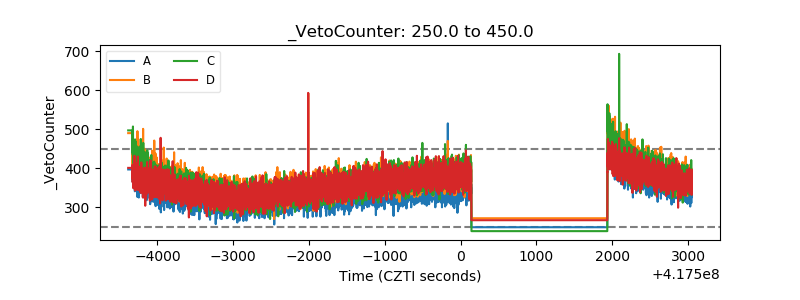 |